Browse the full archive by month →
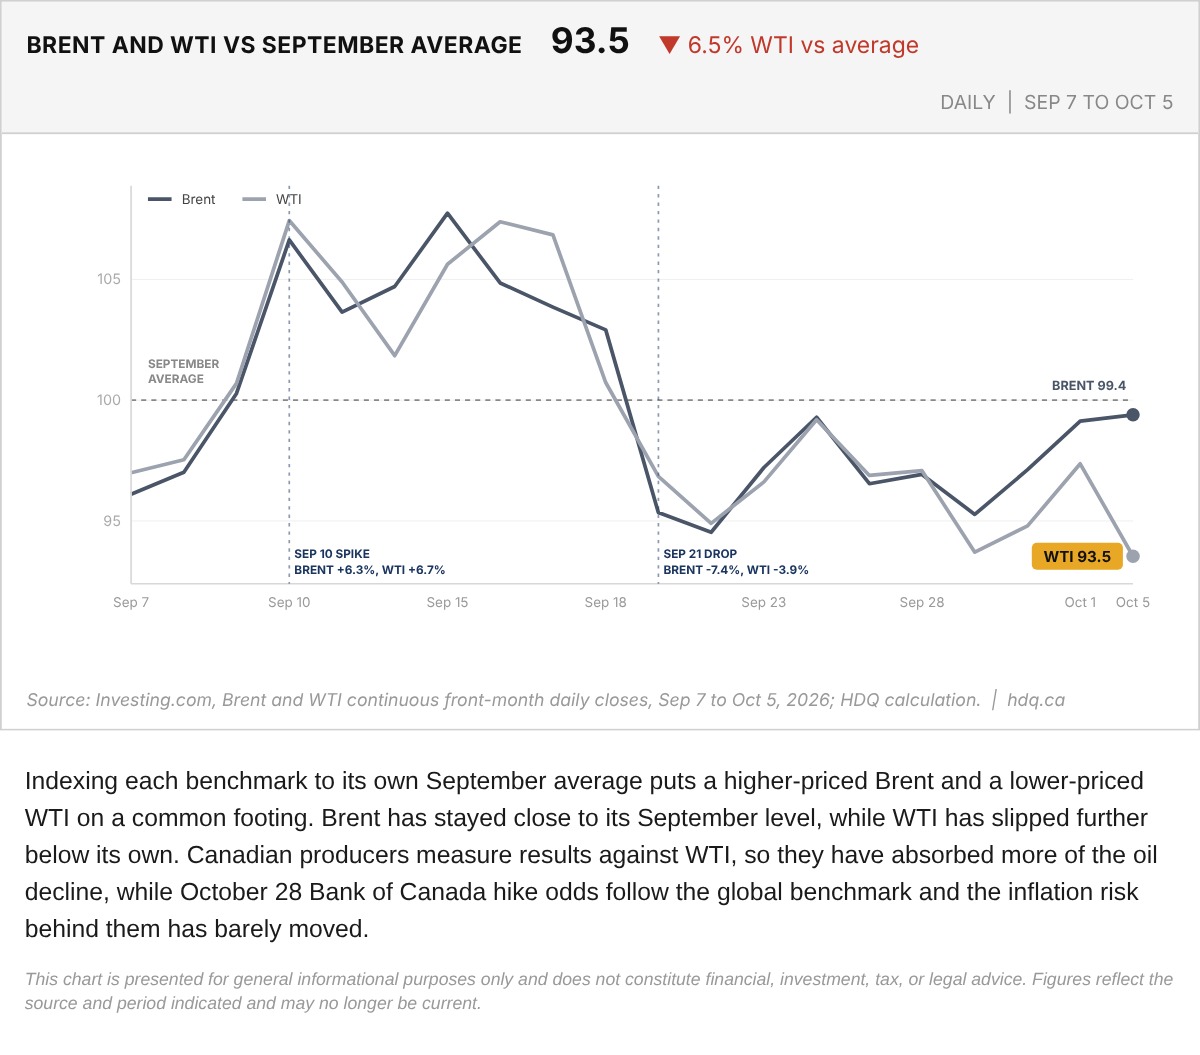
Indexing each benchmark to its own September average puts a higher-priced Brent and a lower-priced WTI on a common footing.
Brent and WTI Against Their September Averages
October 6, 2026
View chart & download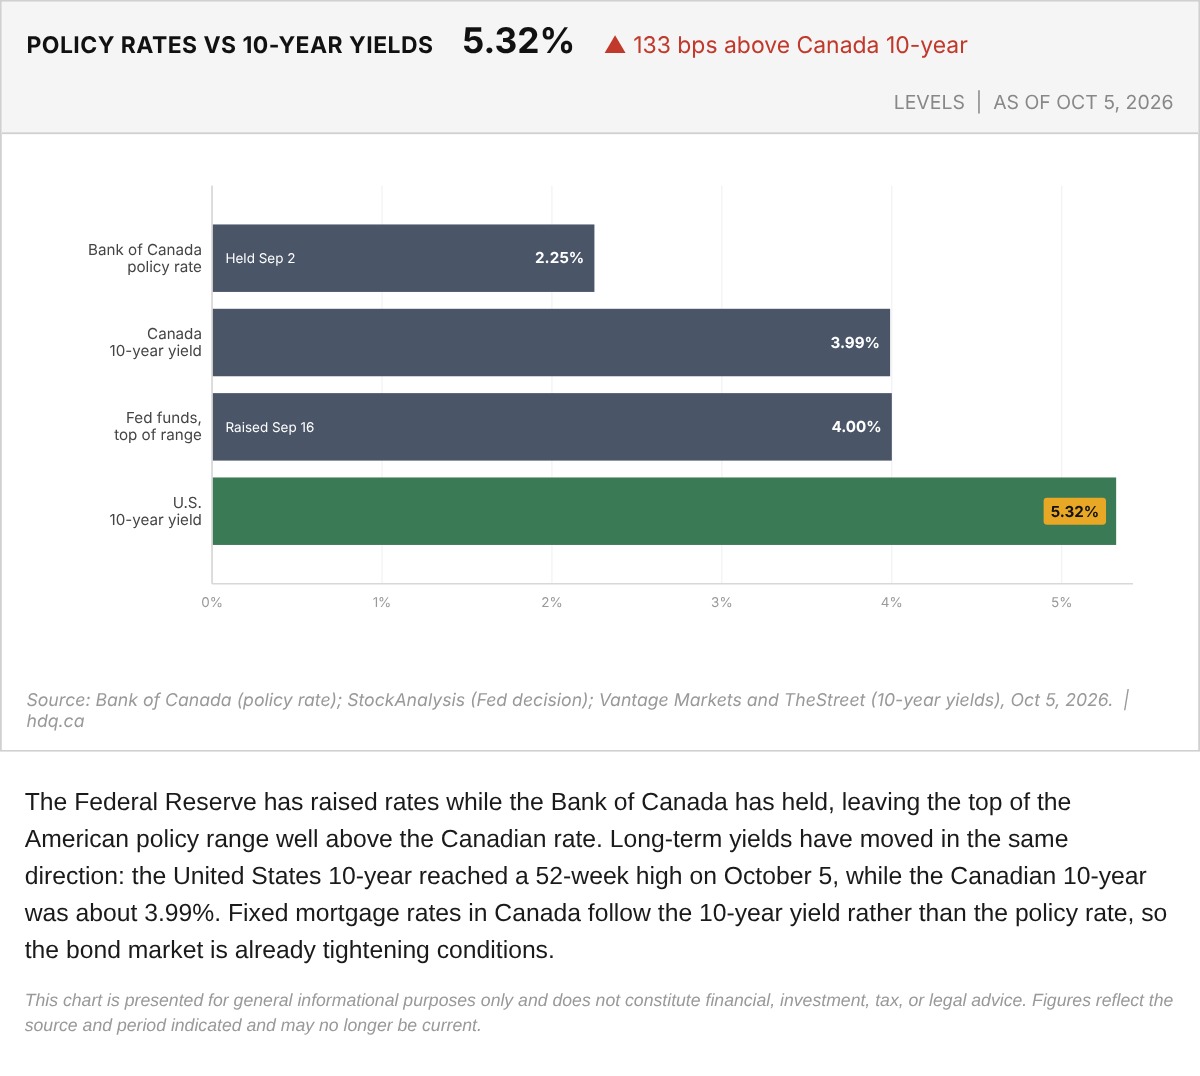
The Federal Reserve has raised rates while the Bank of Canada has held, leaving the top of the American policy range well above the Canadian rate.
Policy Rates and 10-Year Yields in Canada and the United States
October 6, 2026
View chart & download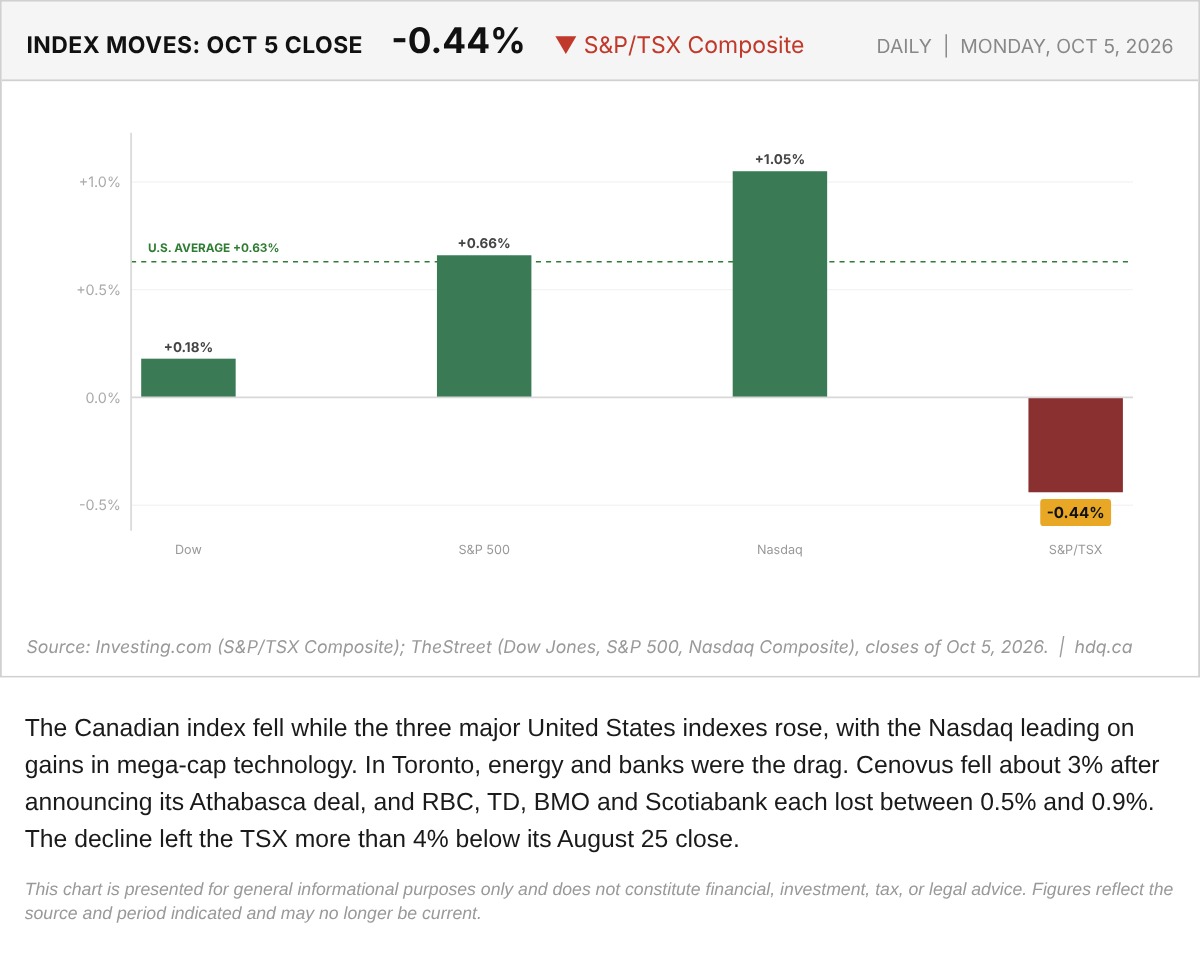
The Canadian index fell while the three major United States indexes rose, with the Nasdaq leading on gains in mega-cap technology.
North American Index Moves on October 5, 2026
October 6, 2026
View chart & download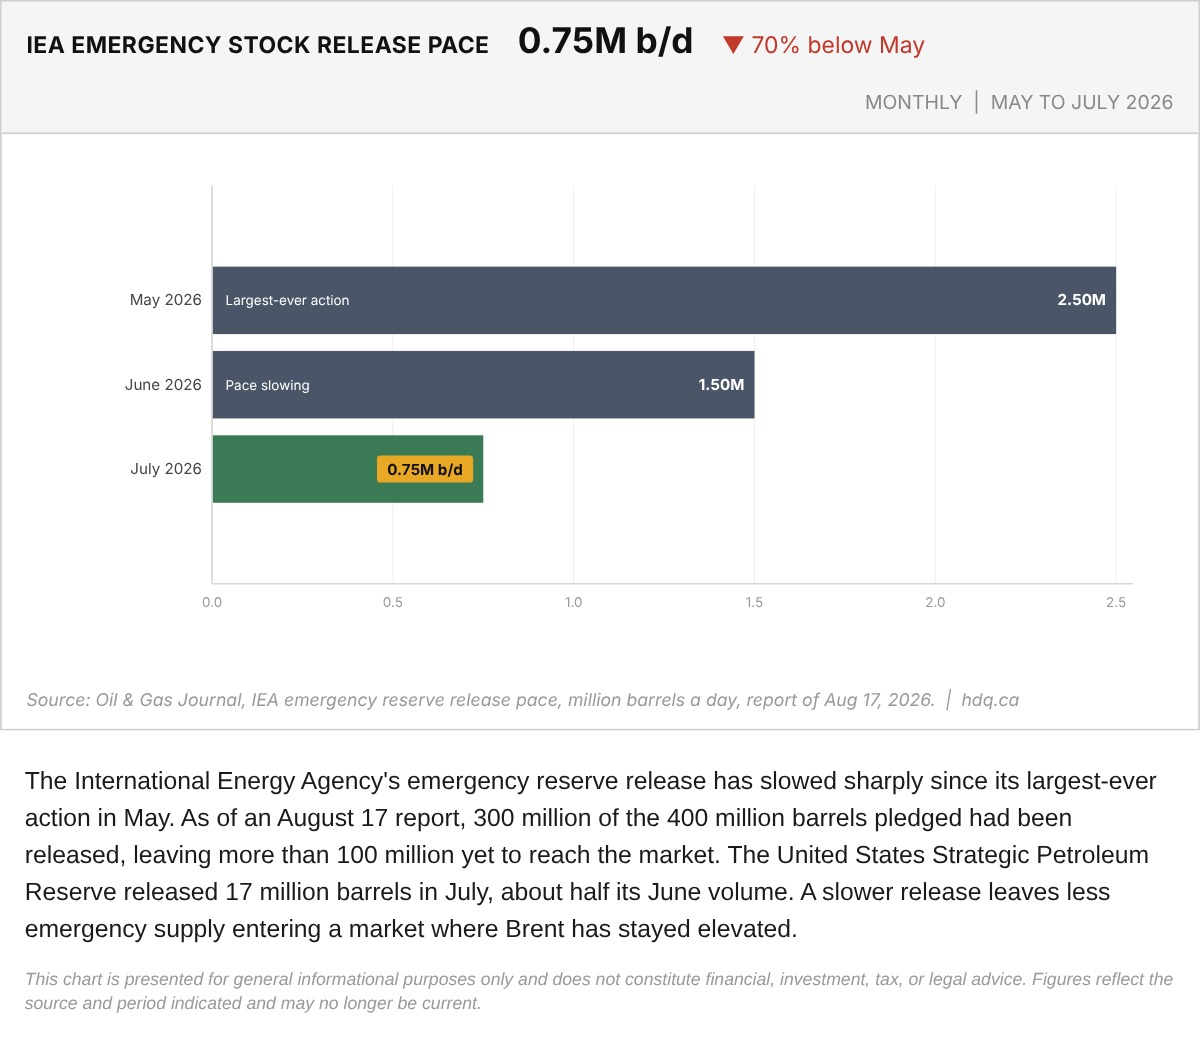
The International Energy Agency's emergency reserve release has slowed sharply since its largest-ever action in May.
IEA Emergency Oil Stock Release Pace, May to July 2026
October 6, 2026
View chart & download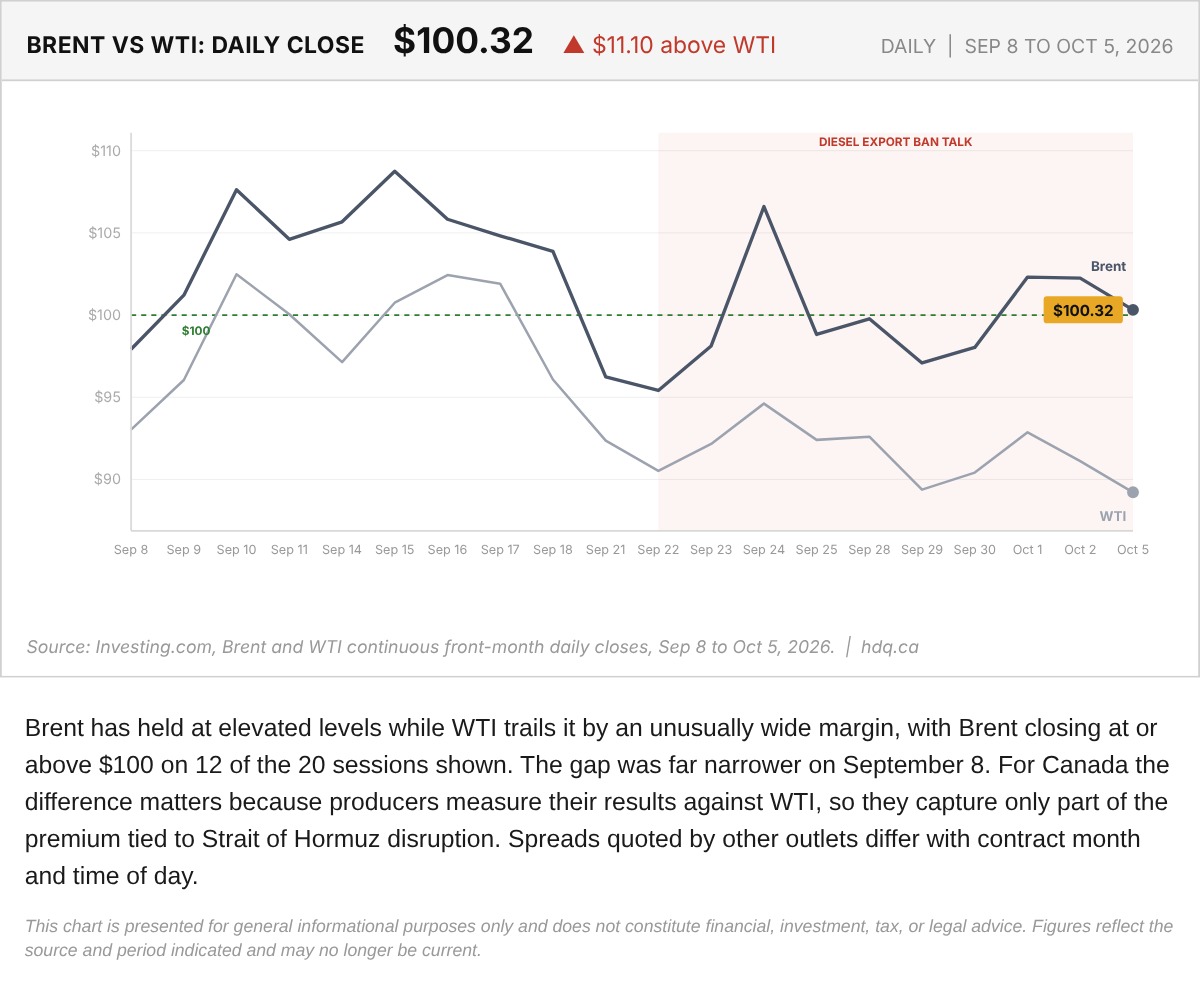
Brent has held at elevated levels while WTI trails it by an unusually wide margin, with Brent closing at or above $100 on 12 of the 20 sessions shown.
Brent and WTI Daily Closes, September 8 to October 5
October 6, 2026
View chart & download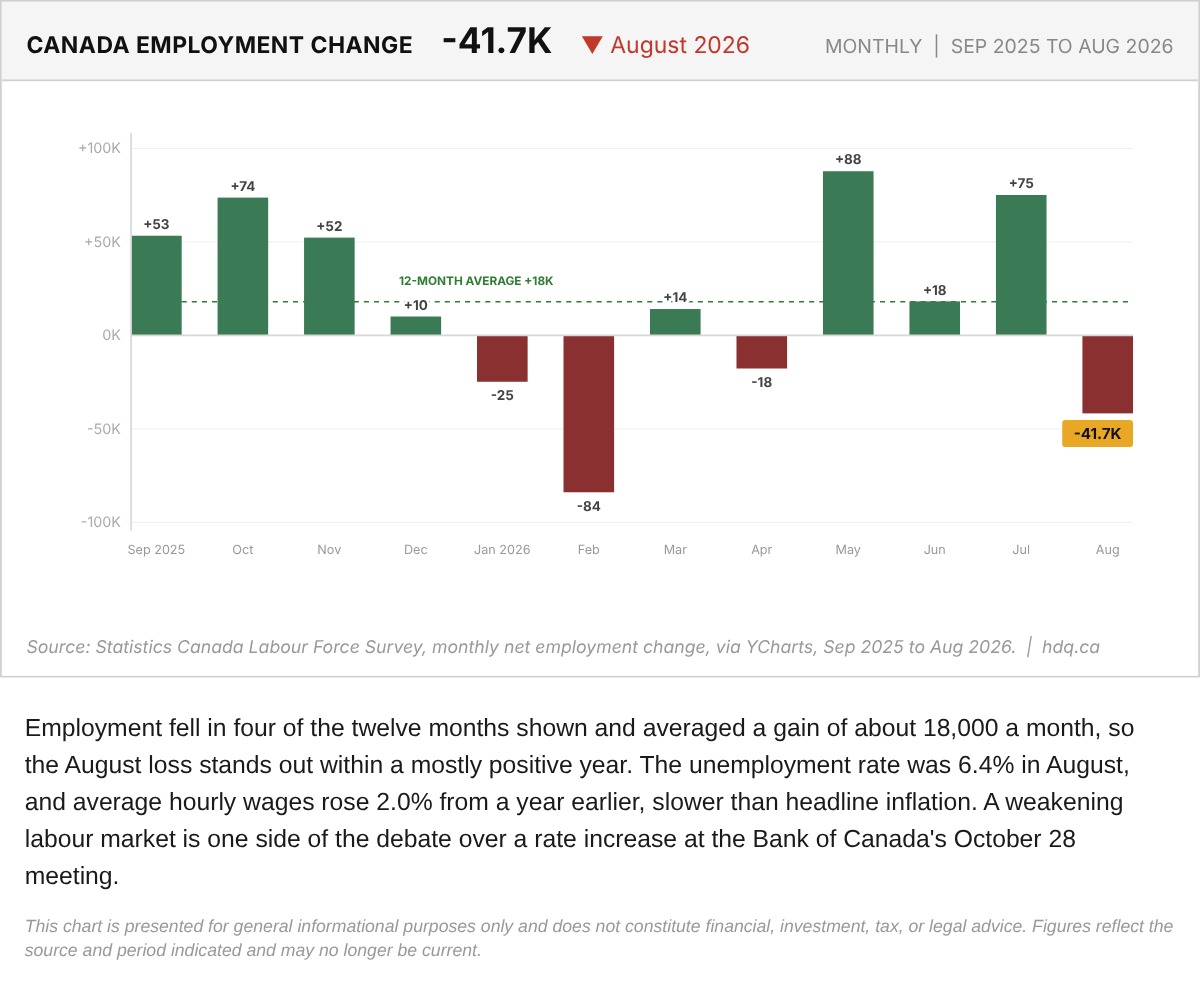
Employment fell in four of the twelve months shown and averaged a gain of about 18,000 a month, so the August loss stands out within a mostly positive year.
Canada Monthly Net Employment Change, September 2025 to August 2026
October 6, 2026
View chart & download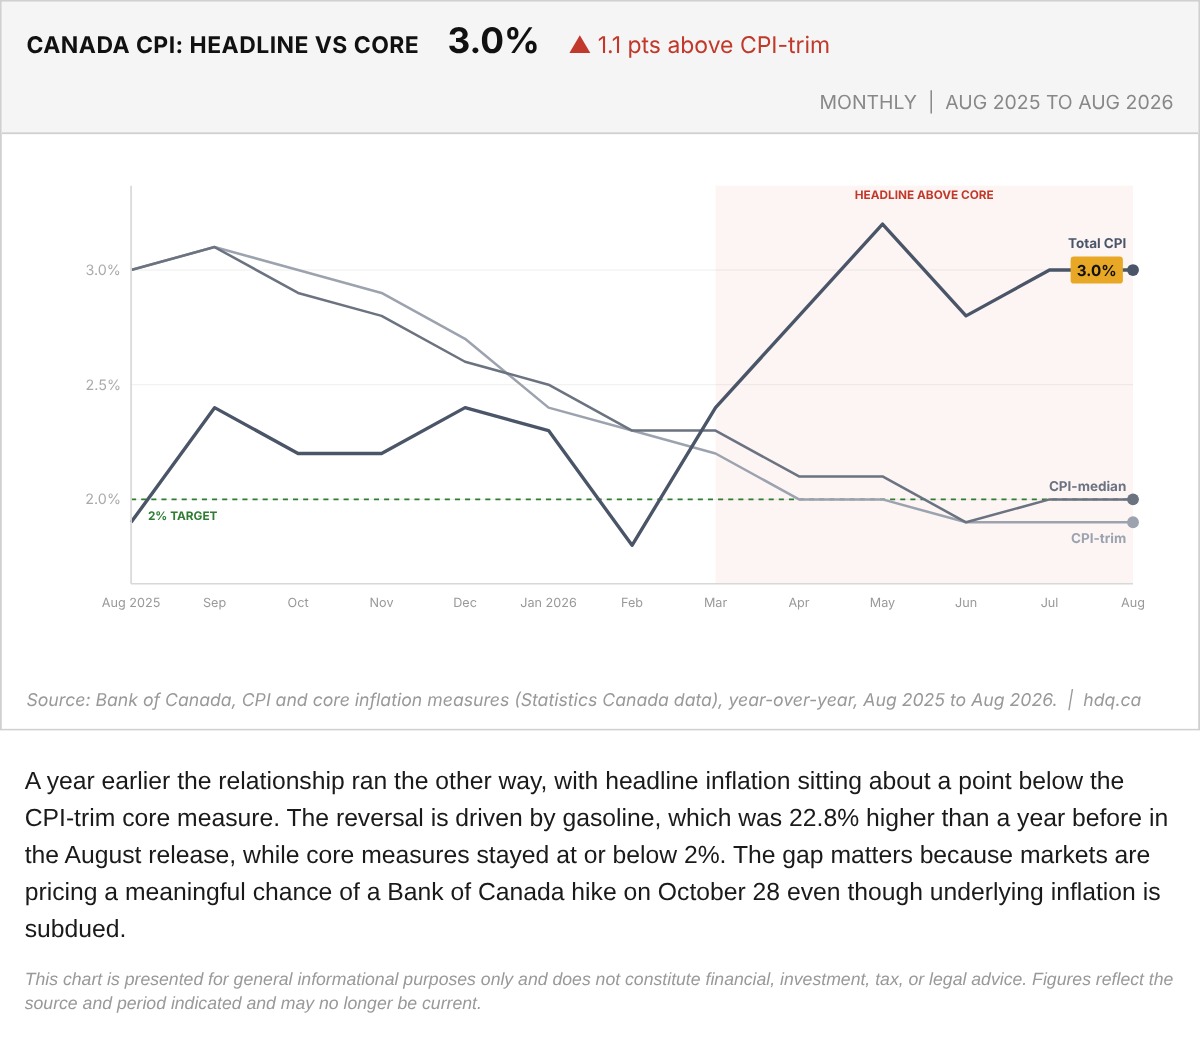
A year earlier the relationship ran the other way, with headline inflation sitting about a point below the CPI-trim core measure.
Canada Headline CPI Against Bank of Canada Core Measures, August 2026
October 6, 2026
View chart & download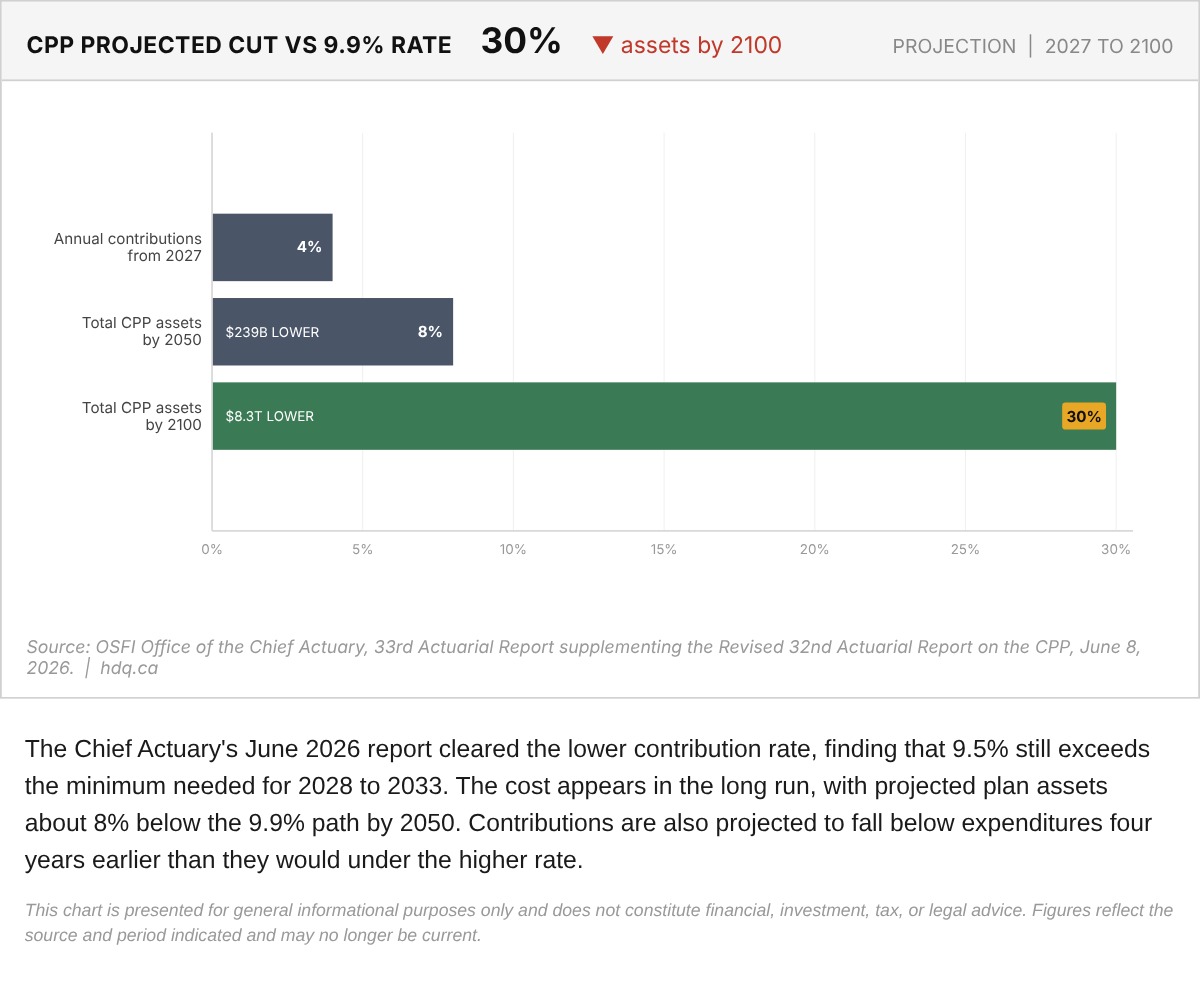
The Chief Actuary's June 2026 report cleared the lower contribution rate, finding that 9.5% still exceeds the minimum needed for 2028 to 2033.
Projected CPP Contributions and Assets Under the 9.5% Rate Versus 9.9%
October 6, 2026
View chart & download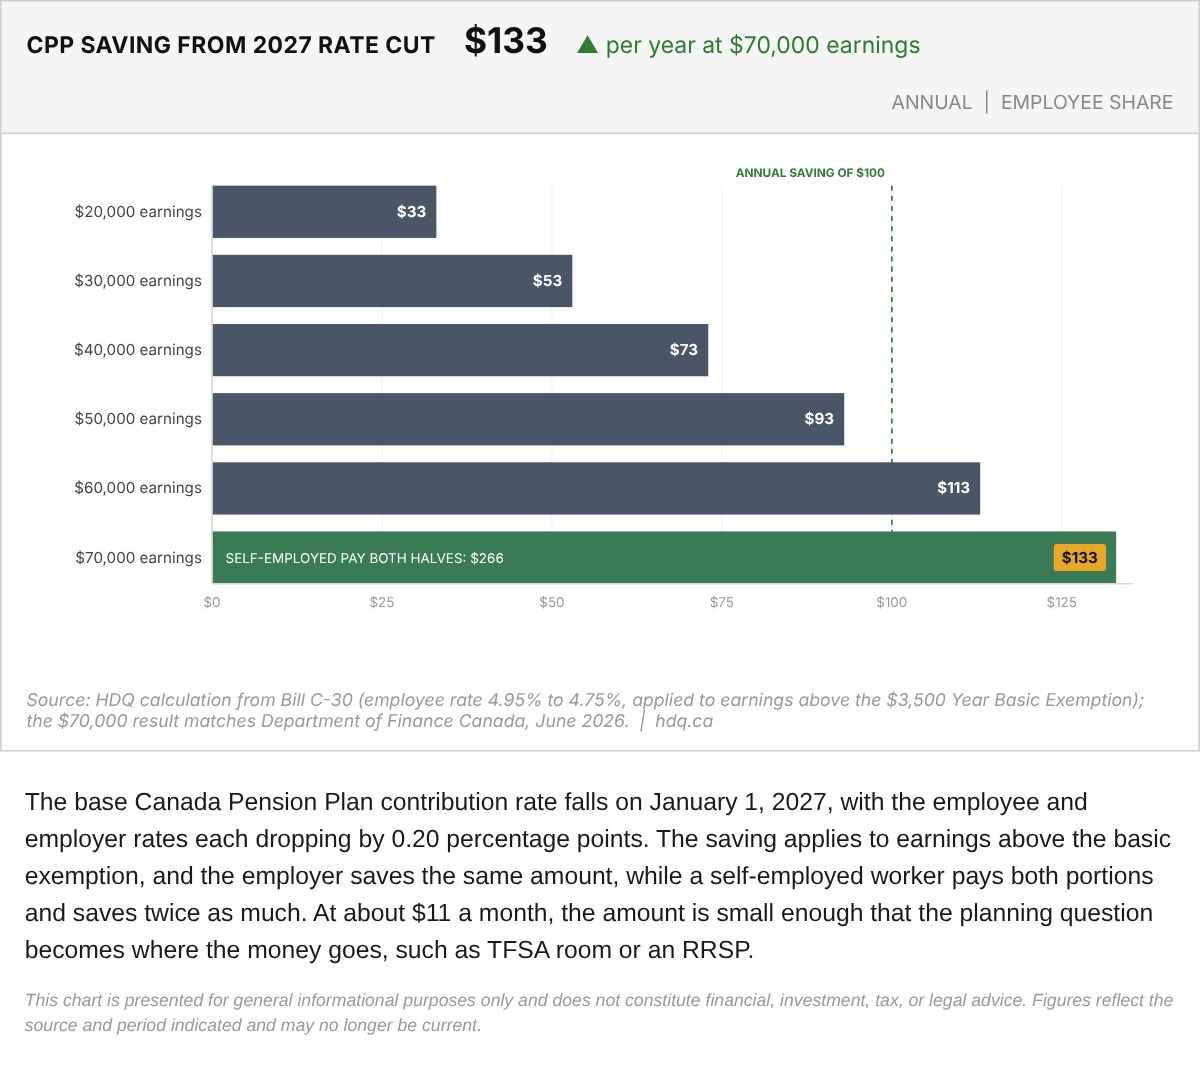
The base Canada Pension Plan contribution rate falls on January 1, 2027, with the employee and employer rates each dropping by 0.20 percentage points.
CPP Contribution Saving From the 2027 Rate Cut by Earnings Level
October 6, 2026
View chart & download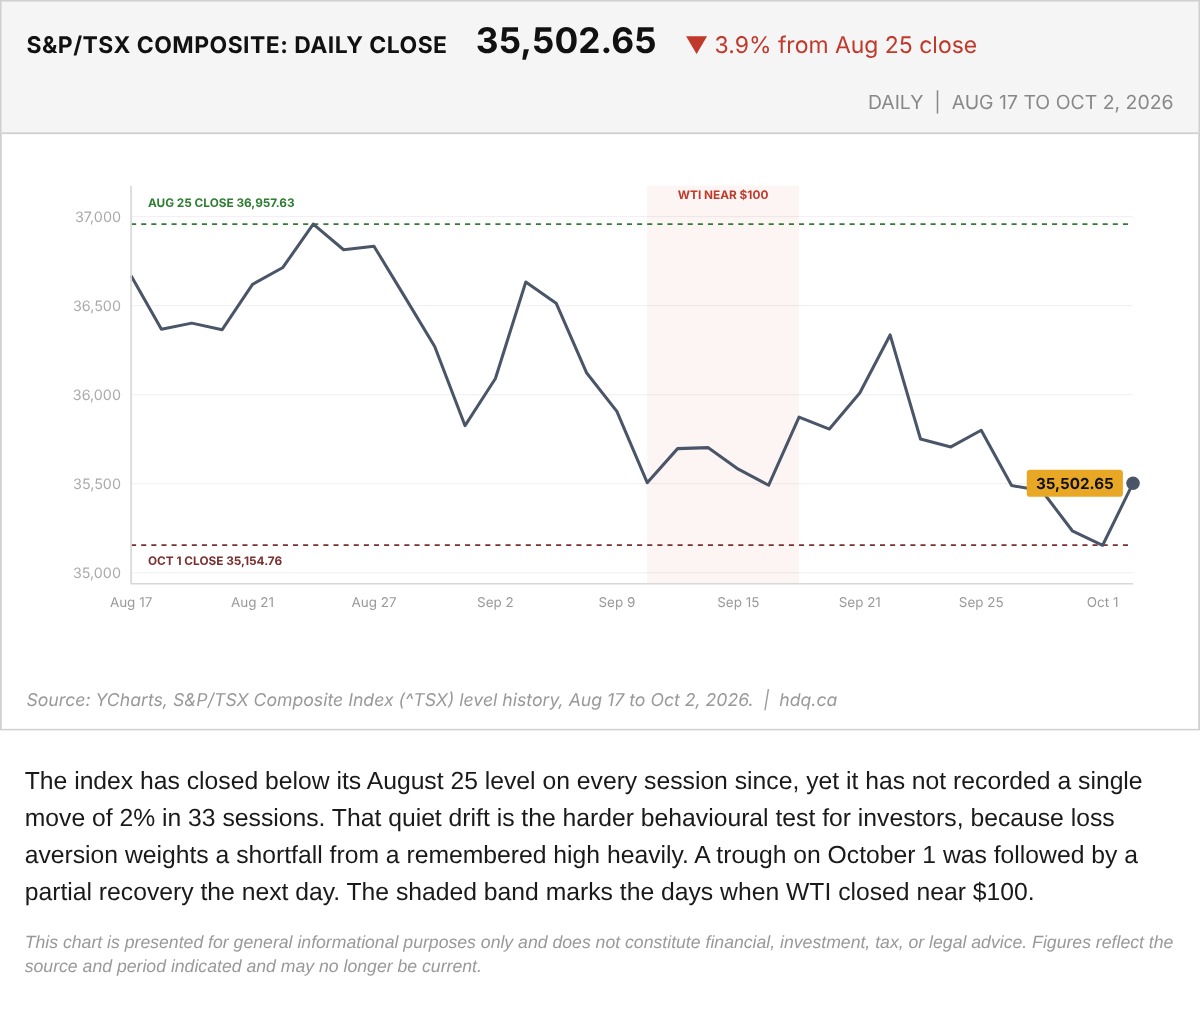
The index has closed below its August 25 level on every session since, yet it has not recorded a single move of 2% in 33 sessions.
S&P/TSX Composite Slide From the August 25 Close, to October 2
October 6, 2026
View chart & download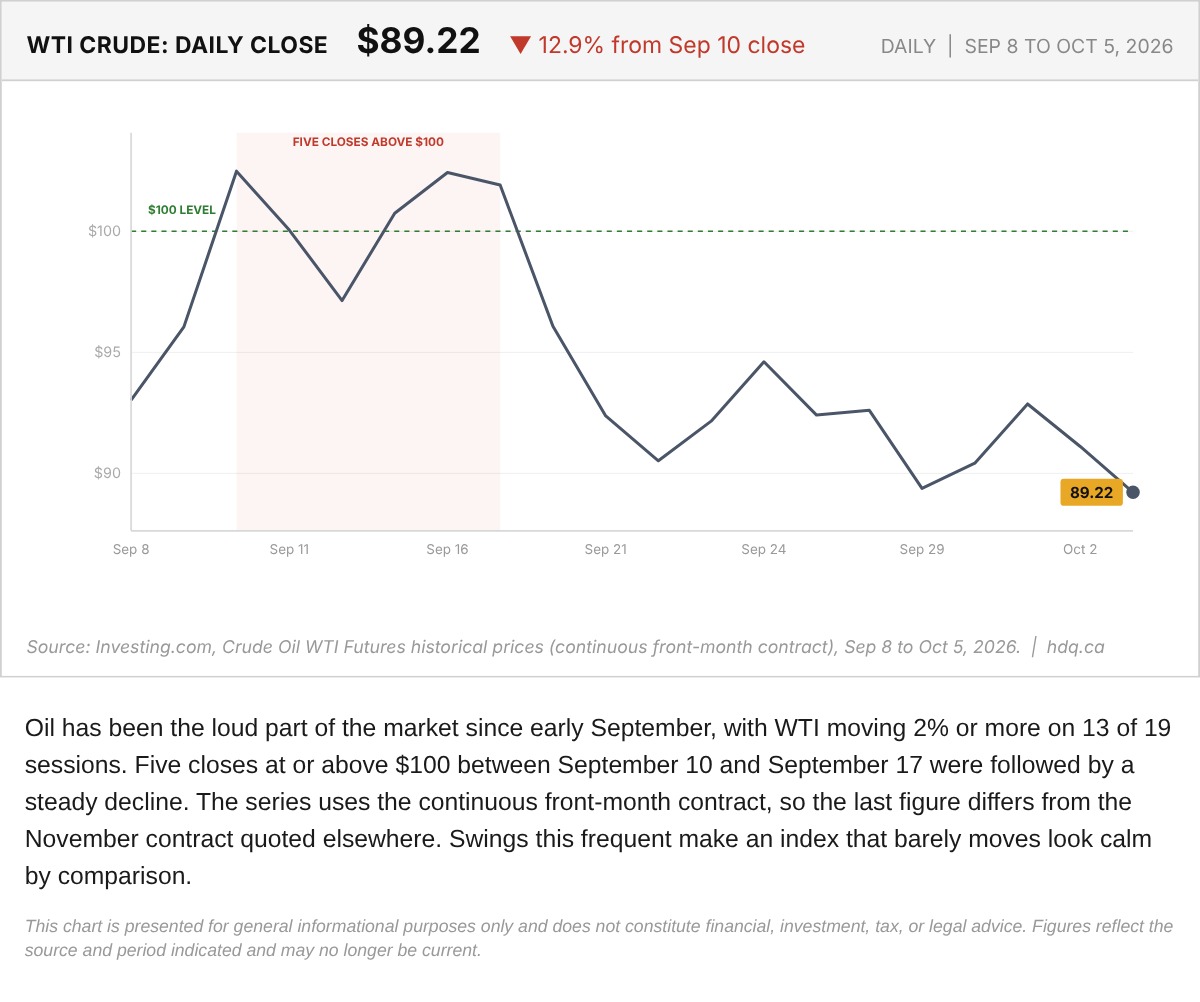
Oil has been the loud part of the market since early September, with WTI moving 2% or more on 13 of 19 sessions.
WTI Crude Oil Daily Closes, September 8 to October 5
October 6, 2026
View chart & download
Brent was the only one of the three to finish above its starting level, while the index and gold both fell.
Brent, TSX and Gold Rebased to the August 31 Close
September 30, 2026
View chart & download
The Bank of Canada held its policy rate at 2.25% for a seventh straight time, yet Canadian yields rose as United States yields surged.
Government of Canada Benchmark Yields, September 2026
September 30, 2026
View chart & download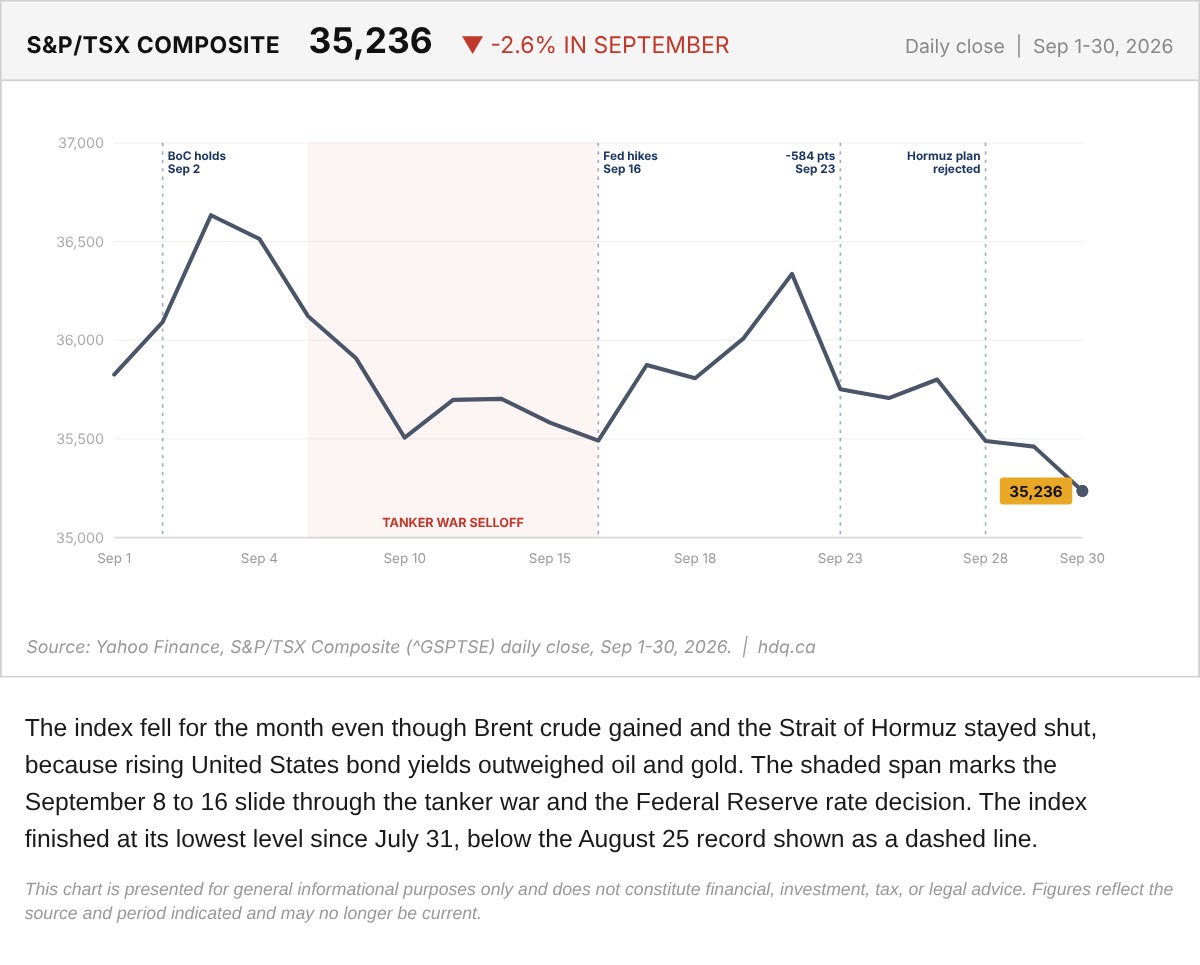
The index fell for the month even though Brent crude gained and the Strait of Hormuz stayed shut, because rising United States bond yields outweighed oil and gold.
S&P/TSX Composite Daily Close Through September 2026
September 30, 2026
View chart & download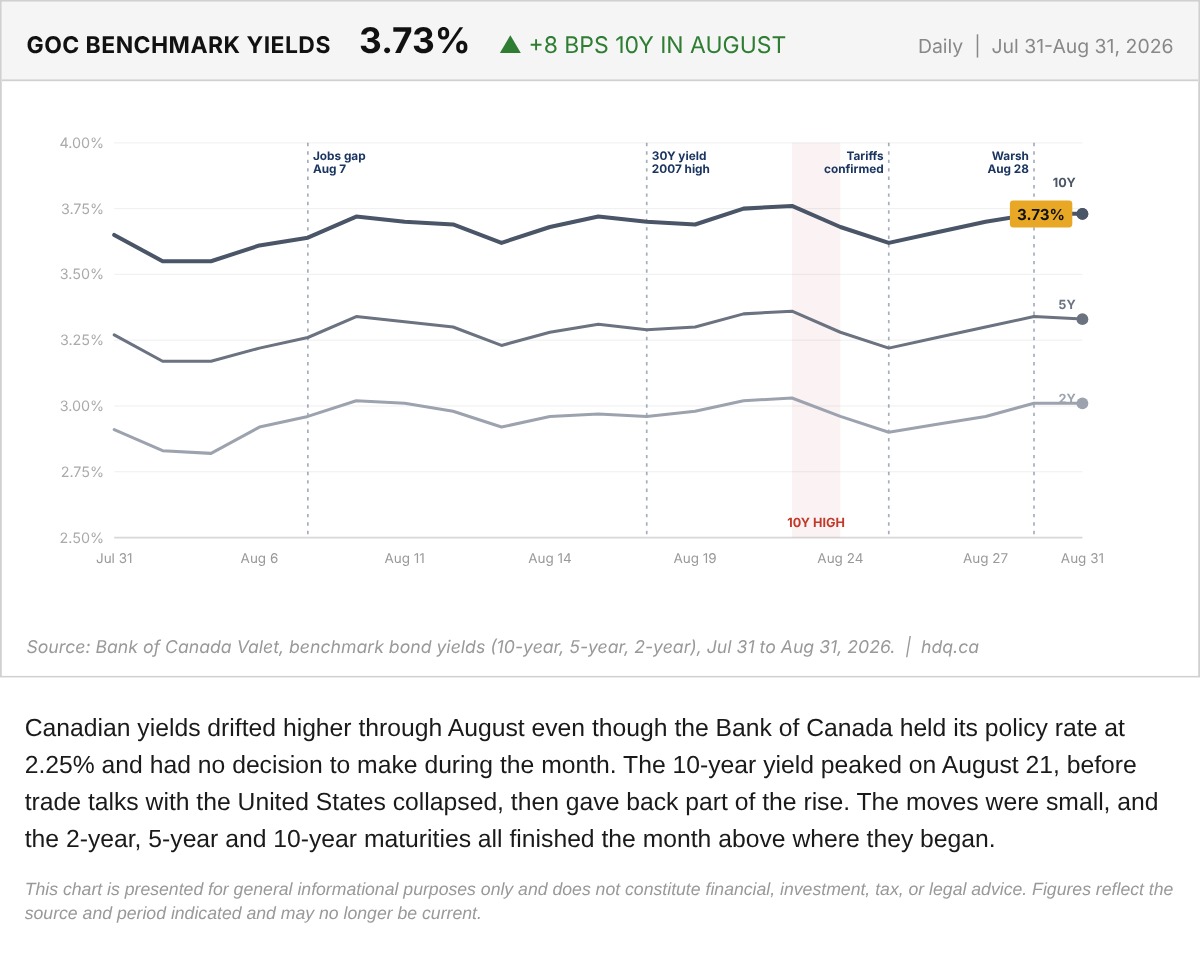
Canadian yields drifted higher through August even though the Bank of Canada held its policy rate at 2.25% and had no decision to make during the month.
Government of Canada Benchmark Yields, August 2026
August 31, 2026
View chart & download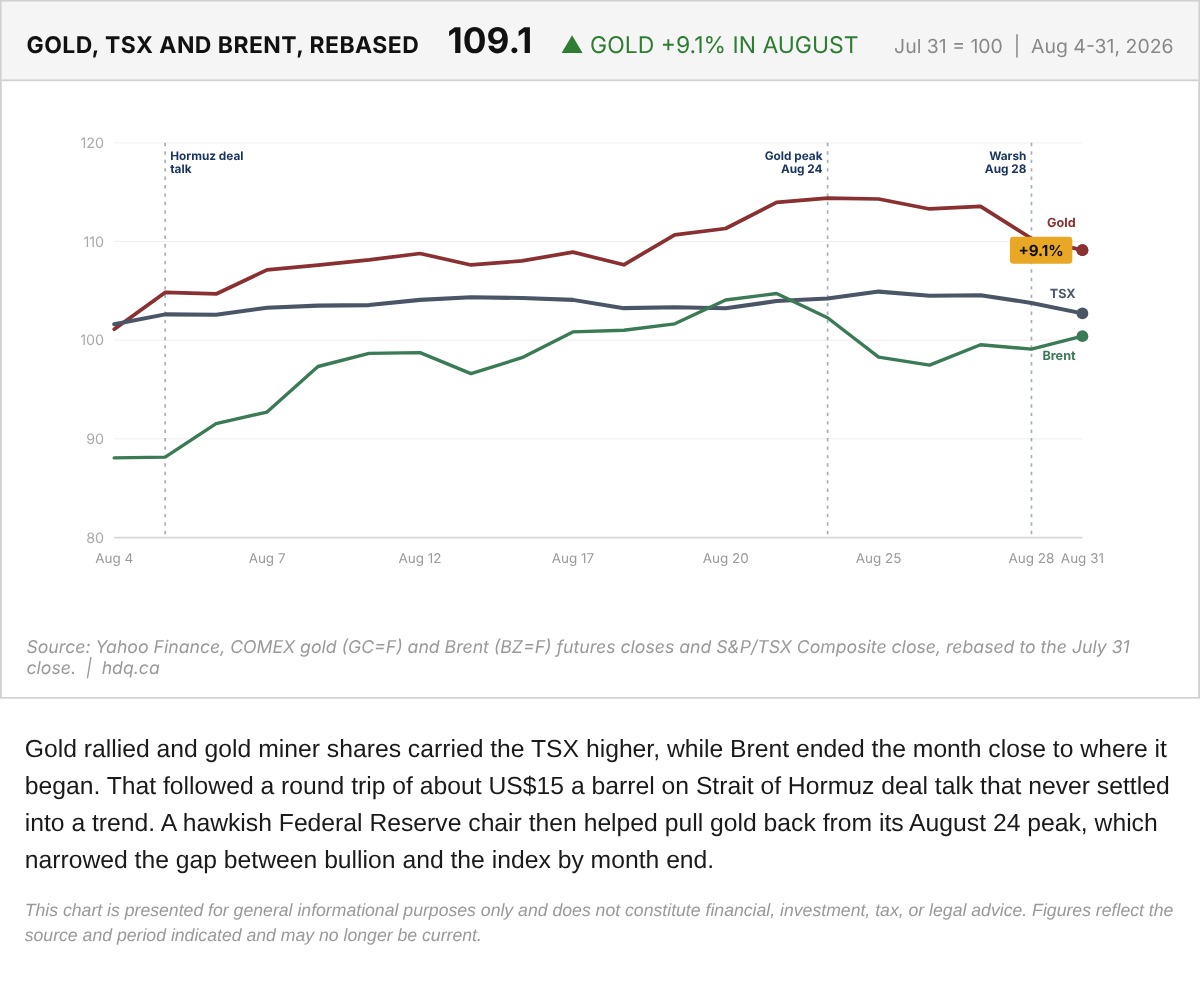
Gold rallied and gold miner shares carried the TSX higher, while Brent ended the month close to where it began.
Gold, TSX and Brent Rebased to the July 31 Close
August 31, 2026
View chart & download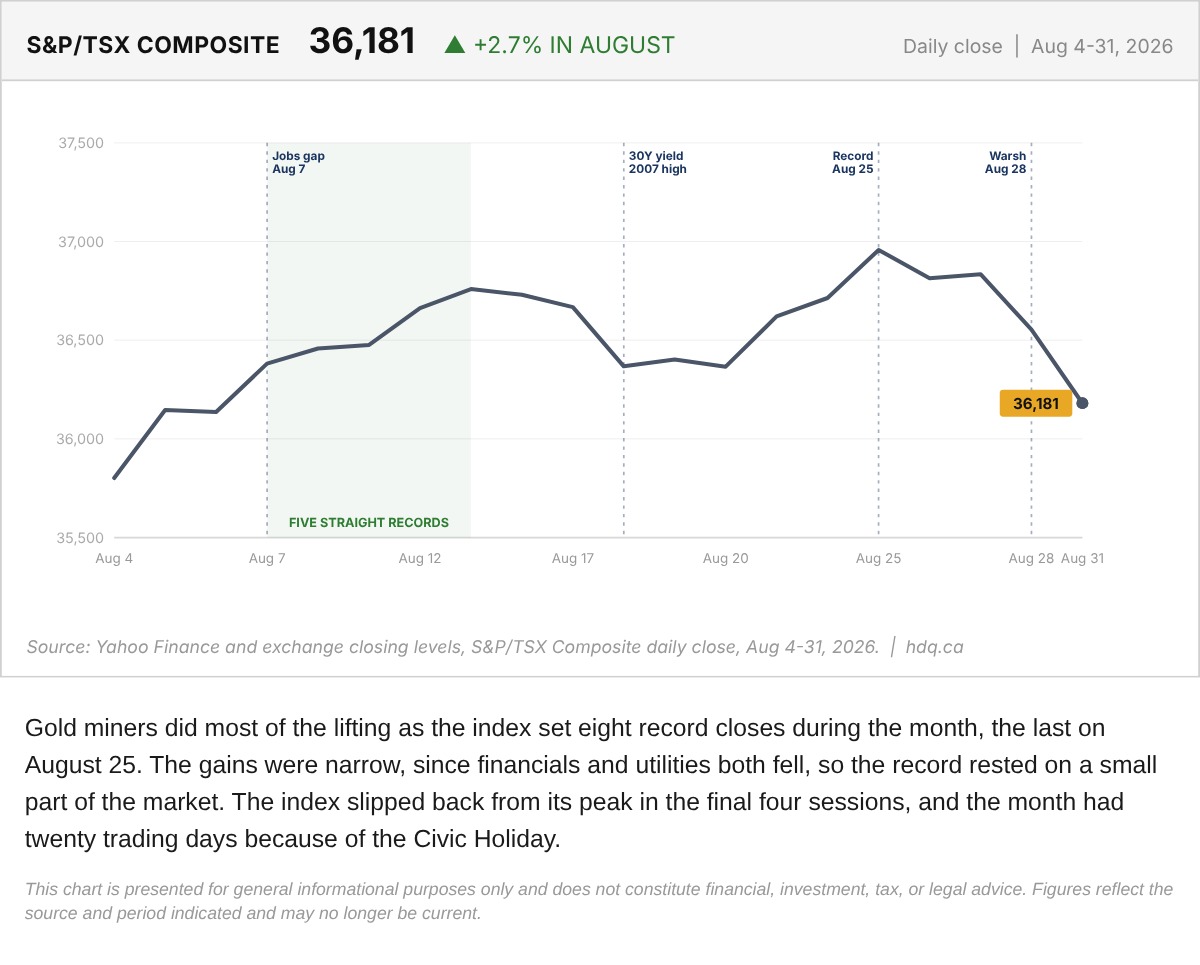
Gold miners did most of the lifting as the index set eight record closes during the month, the last on August 25.
S&P/TSX Composite Daily Close Through August 2026
August 31, 2026
View chart & download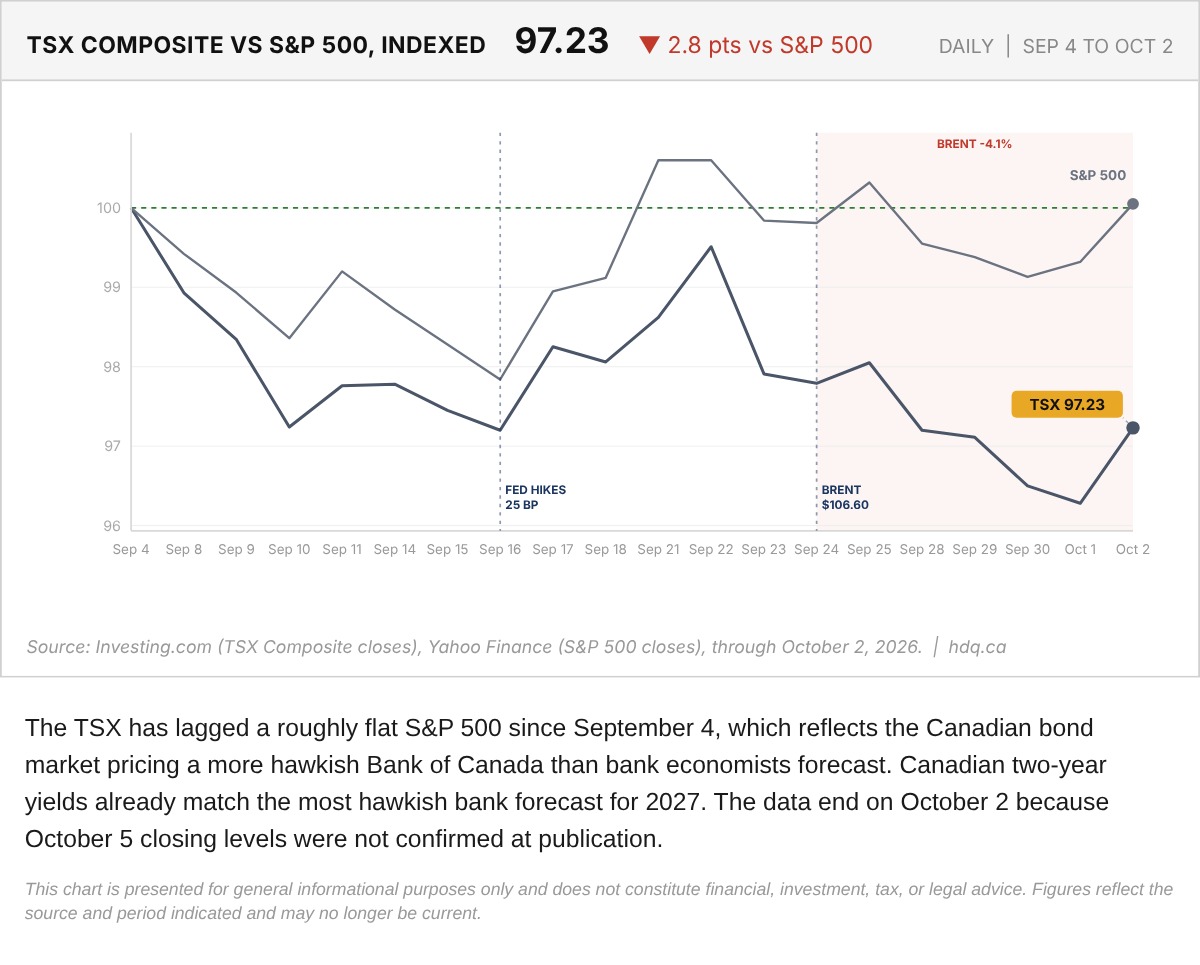
The TSX has lagged a roughly flat S&P 500 since September 4, which reflects the Canadian bond market pricing a more hawkish Bank of Canada than bank economists forecast.
TSX Composite Versus S&P 500, Indexed to September 4, 2026
October 5, 2026
View chart & download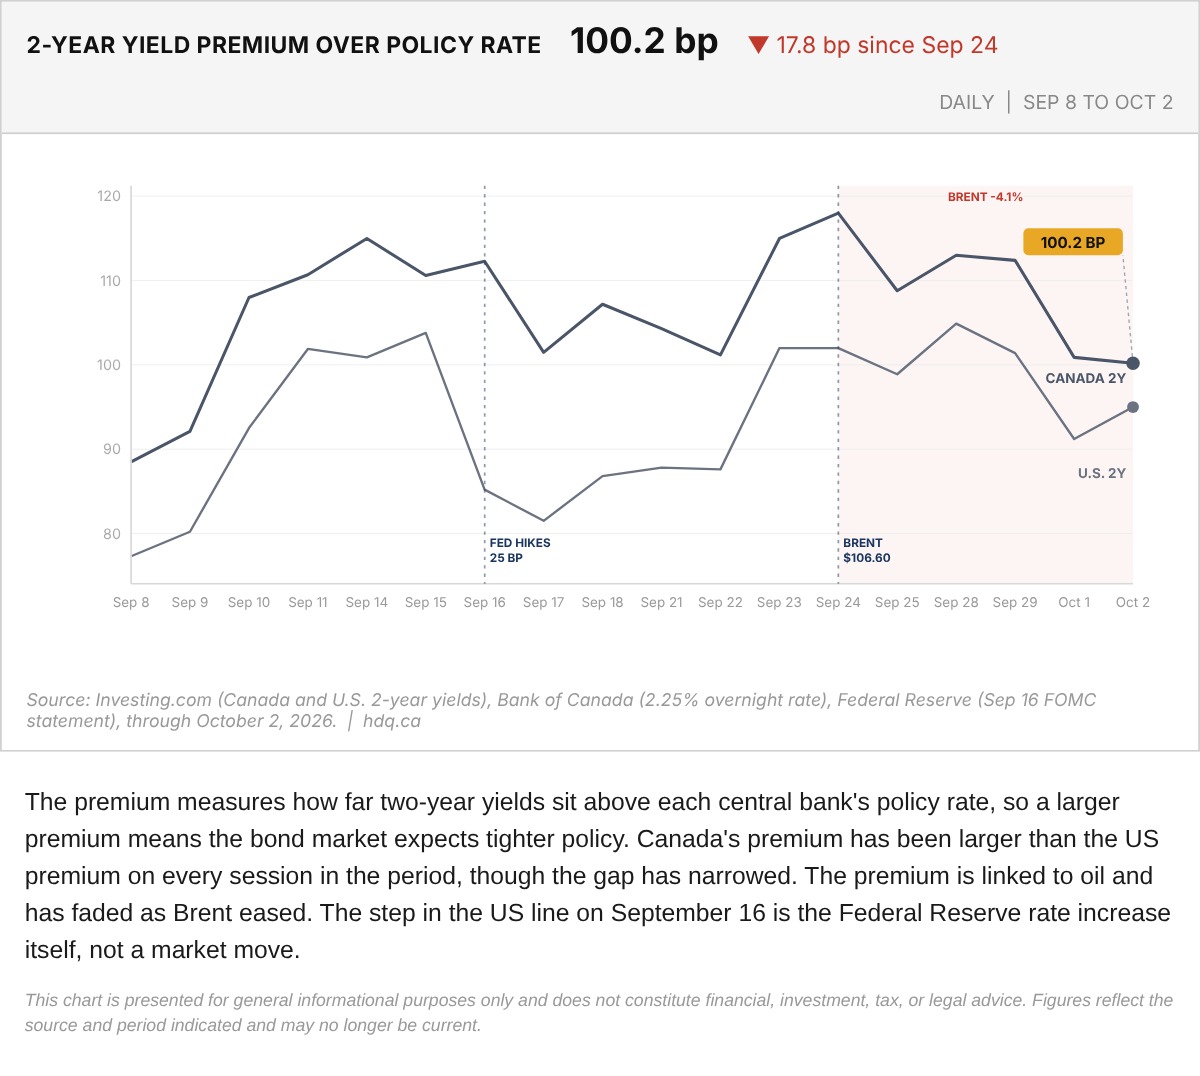
The premium measures how far two-year yields sit above each central bank's policy rate, so a larger premium means the bond market expects tighter policy.
Two-Year Yield Premium Over Policy Rate: Canada and the US, September 8 to October 2, 2026
October 5, 2026
View chart & download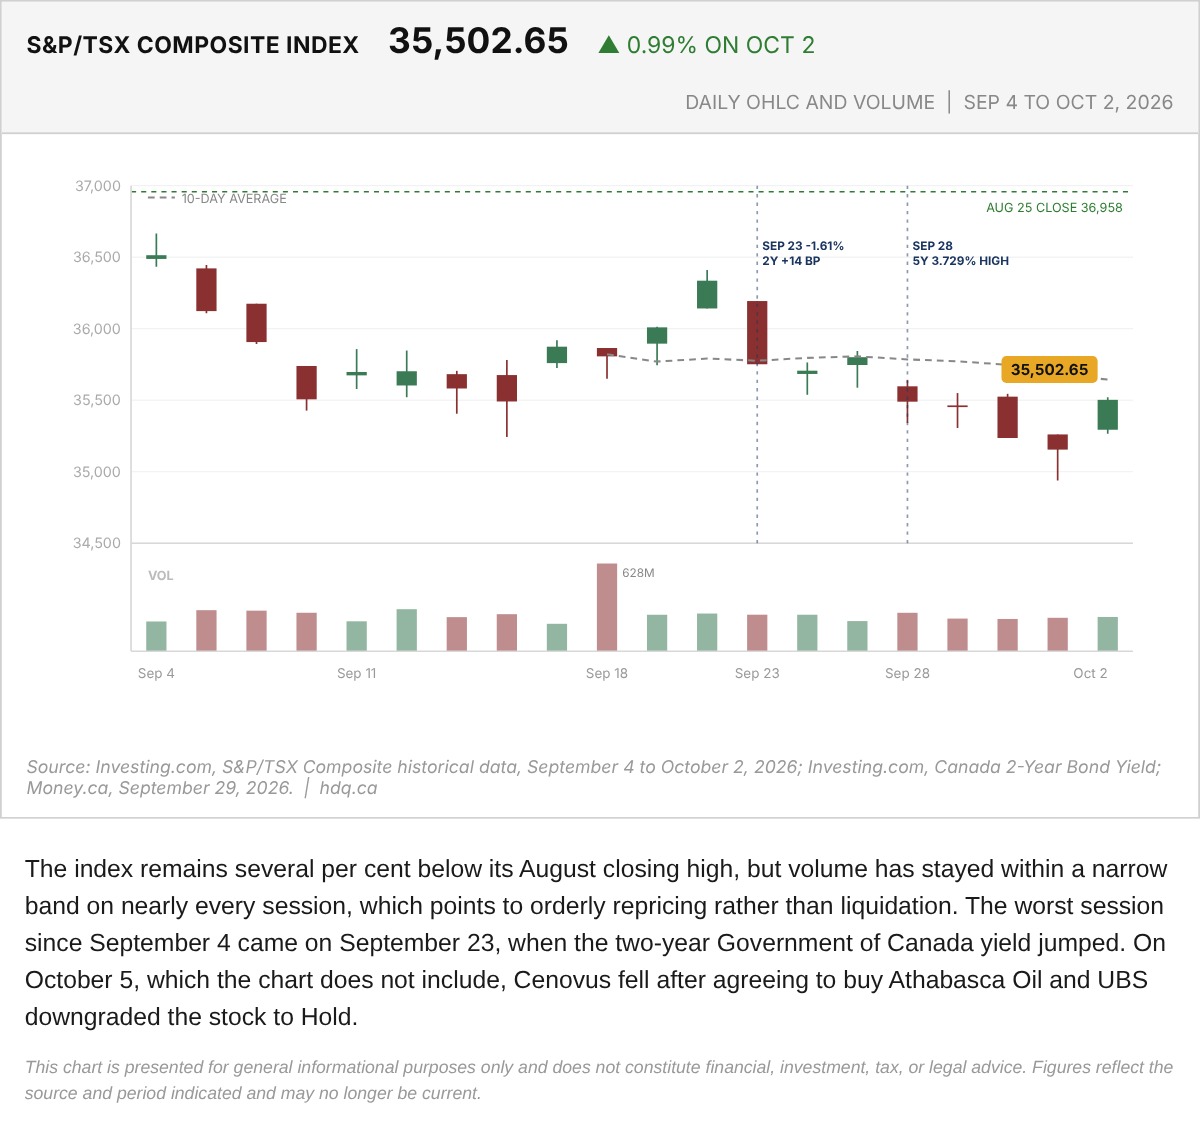
The index remains several per cent below its August closing high, but volume has stayed within a narrow band on nearly every session, which…
S&P/TSX Composite Daily Price Action and Volume, September 4 to October 2, 2026
October 5, 2026
View chart & download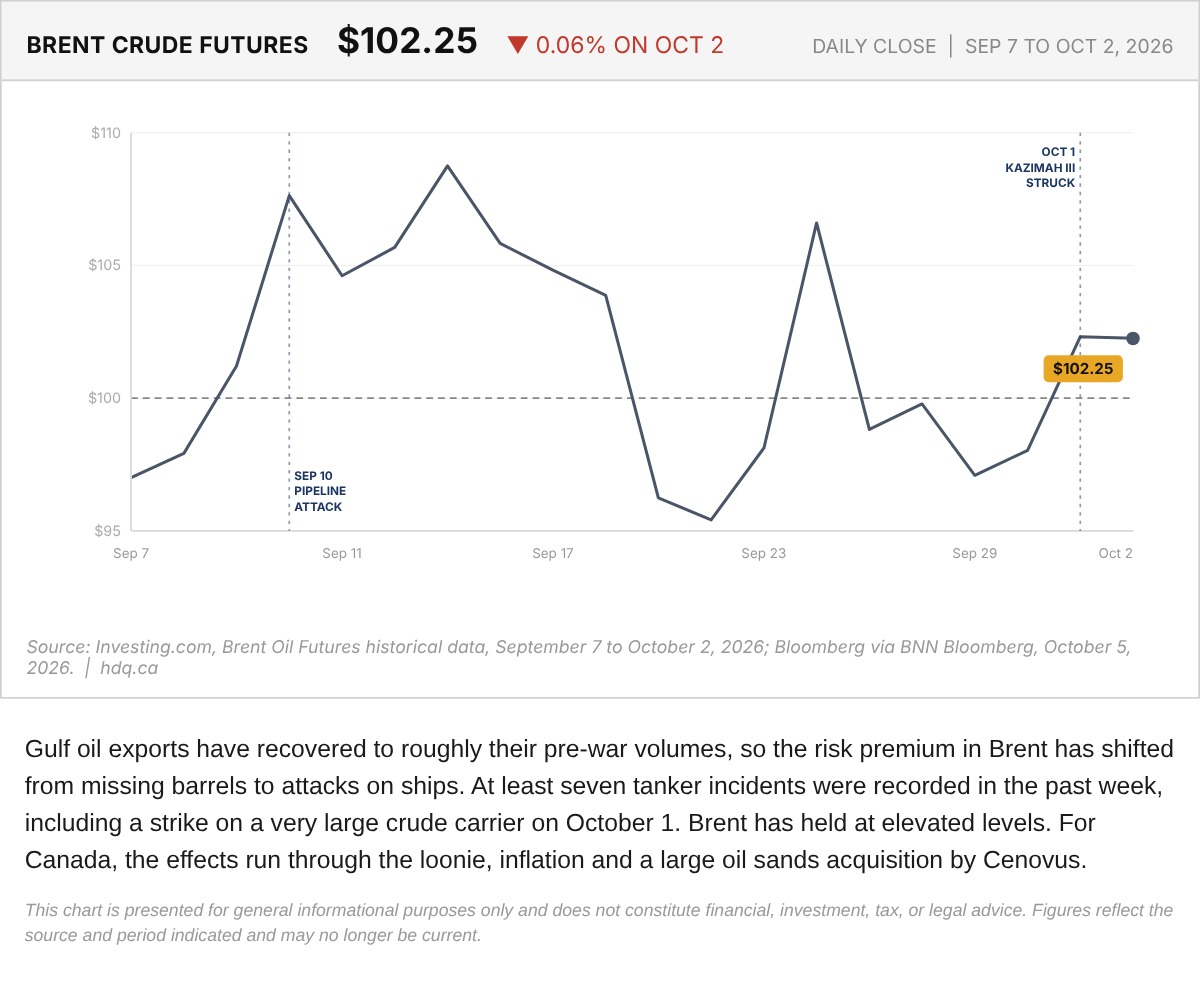
Gulf oil exports have recovered to roughly their pre-war volumes, so the risk premium in Brent has shifted from missing barrels to attacks on ships.
Brent Crude Futures Daily Close, September 7 to October 2, 2026
October 5, 2026
View chart & download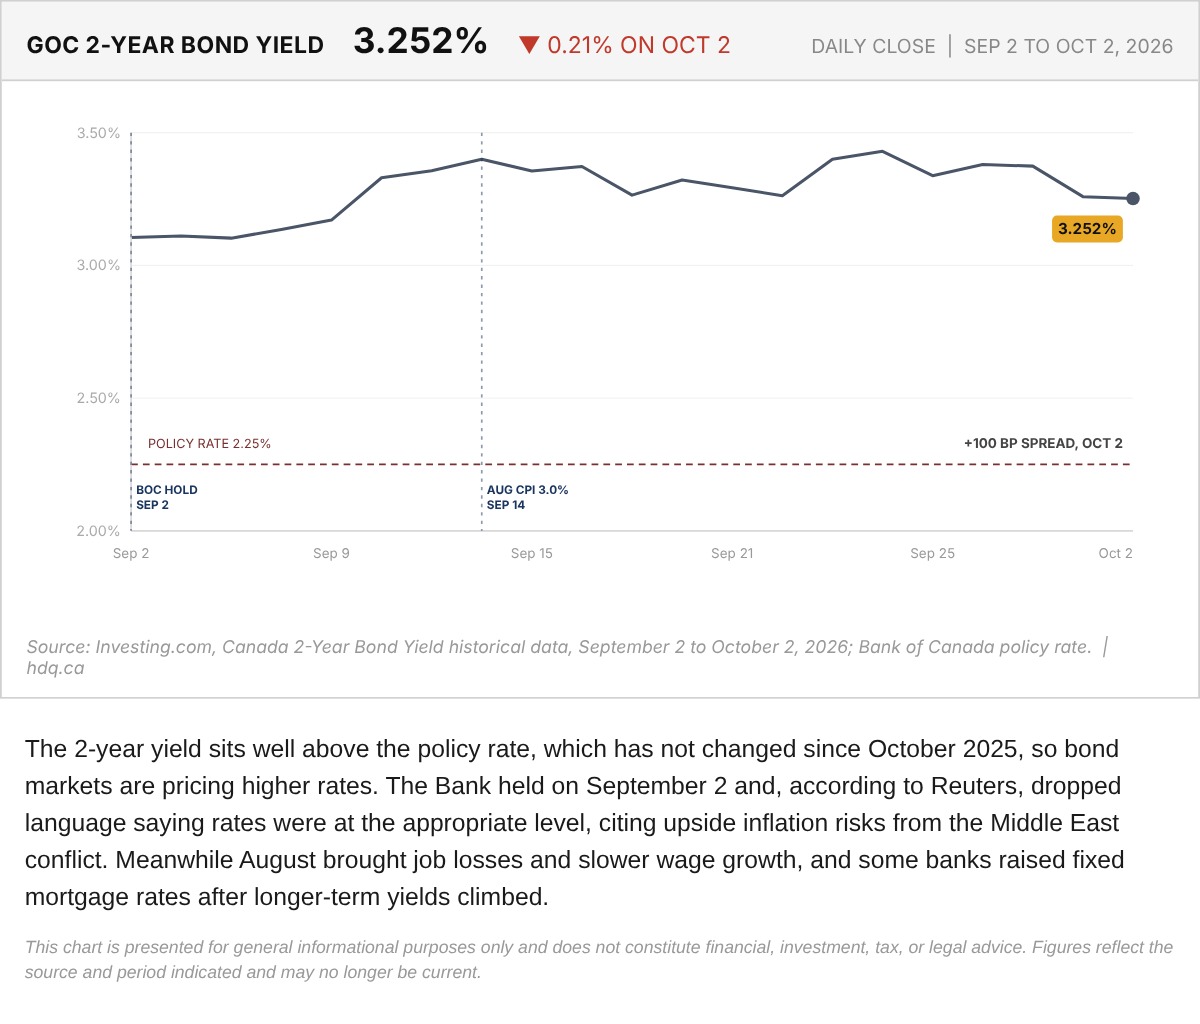
The 2-year yield sits well above the policy rate, which has not changed since October 2025, so bond markets are pricing higher rates.
Government of Canada 2-Year Bond Yield, September 2 to October 2, 2026
October 5, 2026
View chart & download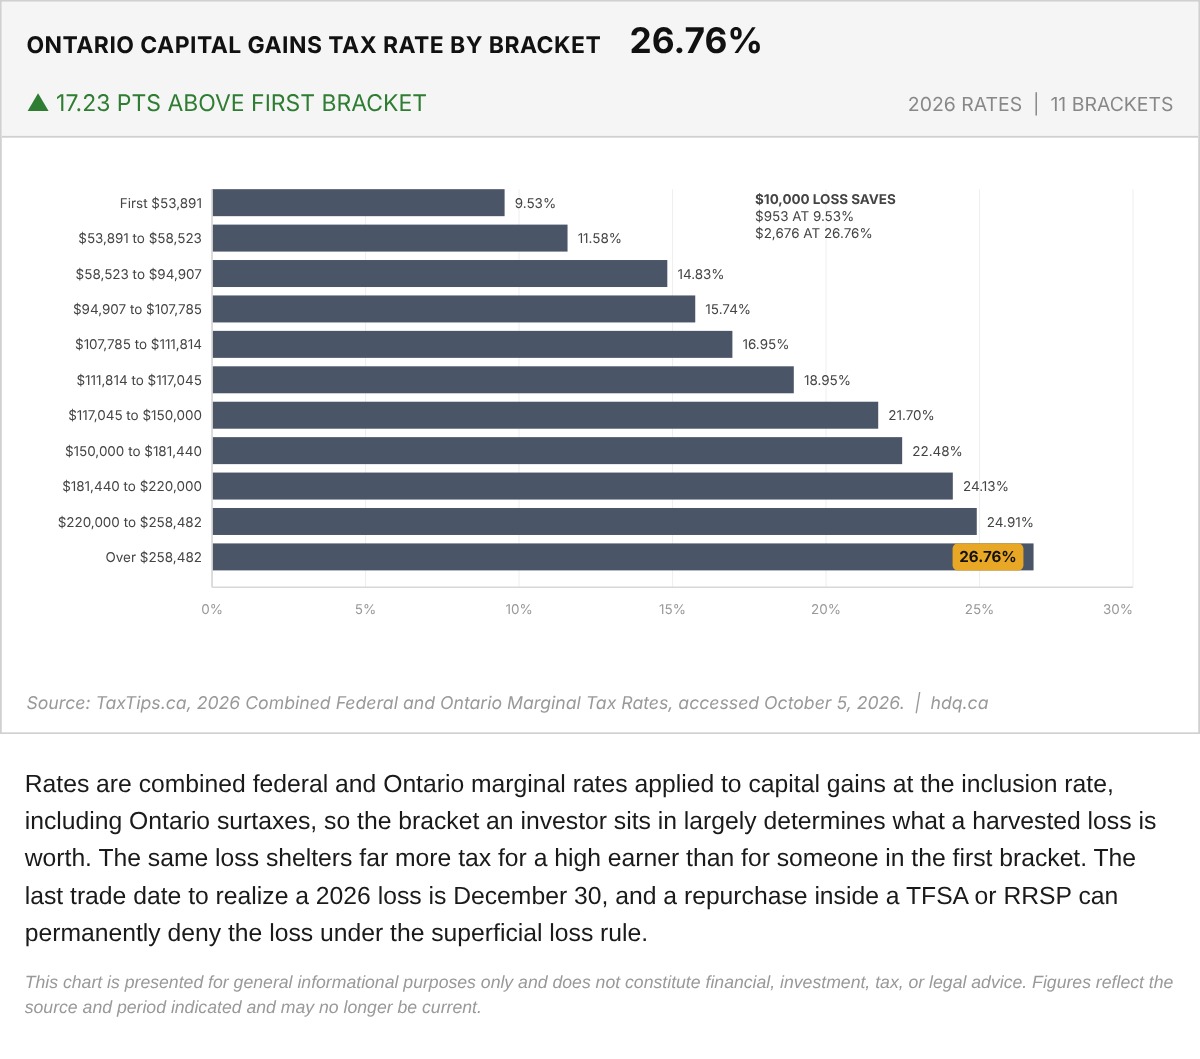
Rates are combined federal and Ontario marginal rates applied to capital gains at the inclusion rate, including Ontario surtaxes, so the…
Ontario Capital Gains Tax Rates by Income Bracket, 2026
October 5, 2026
View chart & download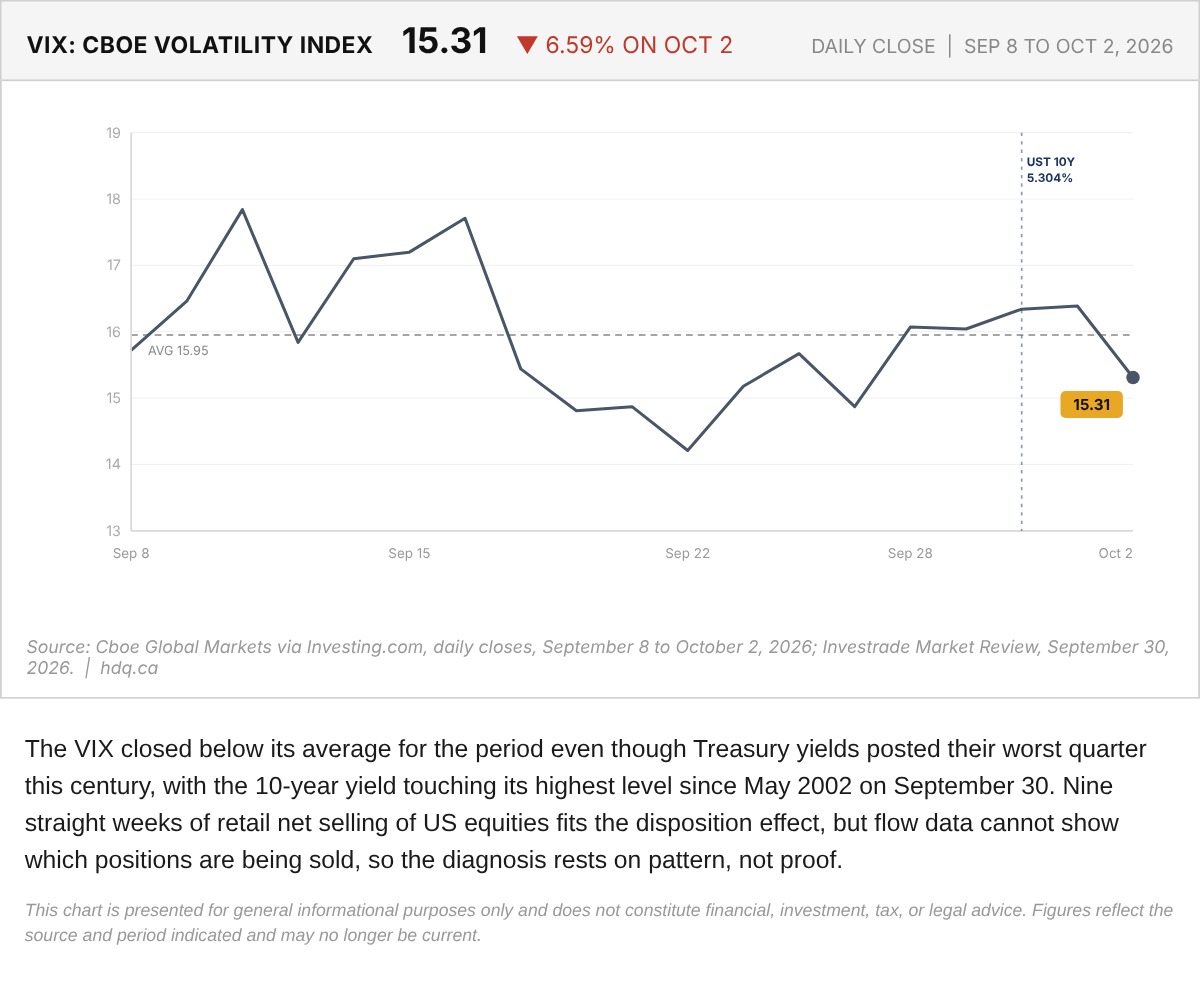
The VIX closed below its average for the period even though Treasury yields posted their worst quarter this century, with the 10-year yield…
Cboe Volatility Index (VIX), September 8 to October 2, 2026
October 5, 2026
View chart & download