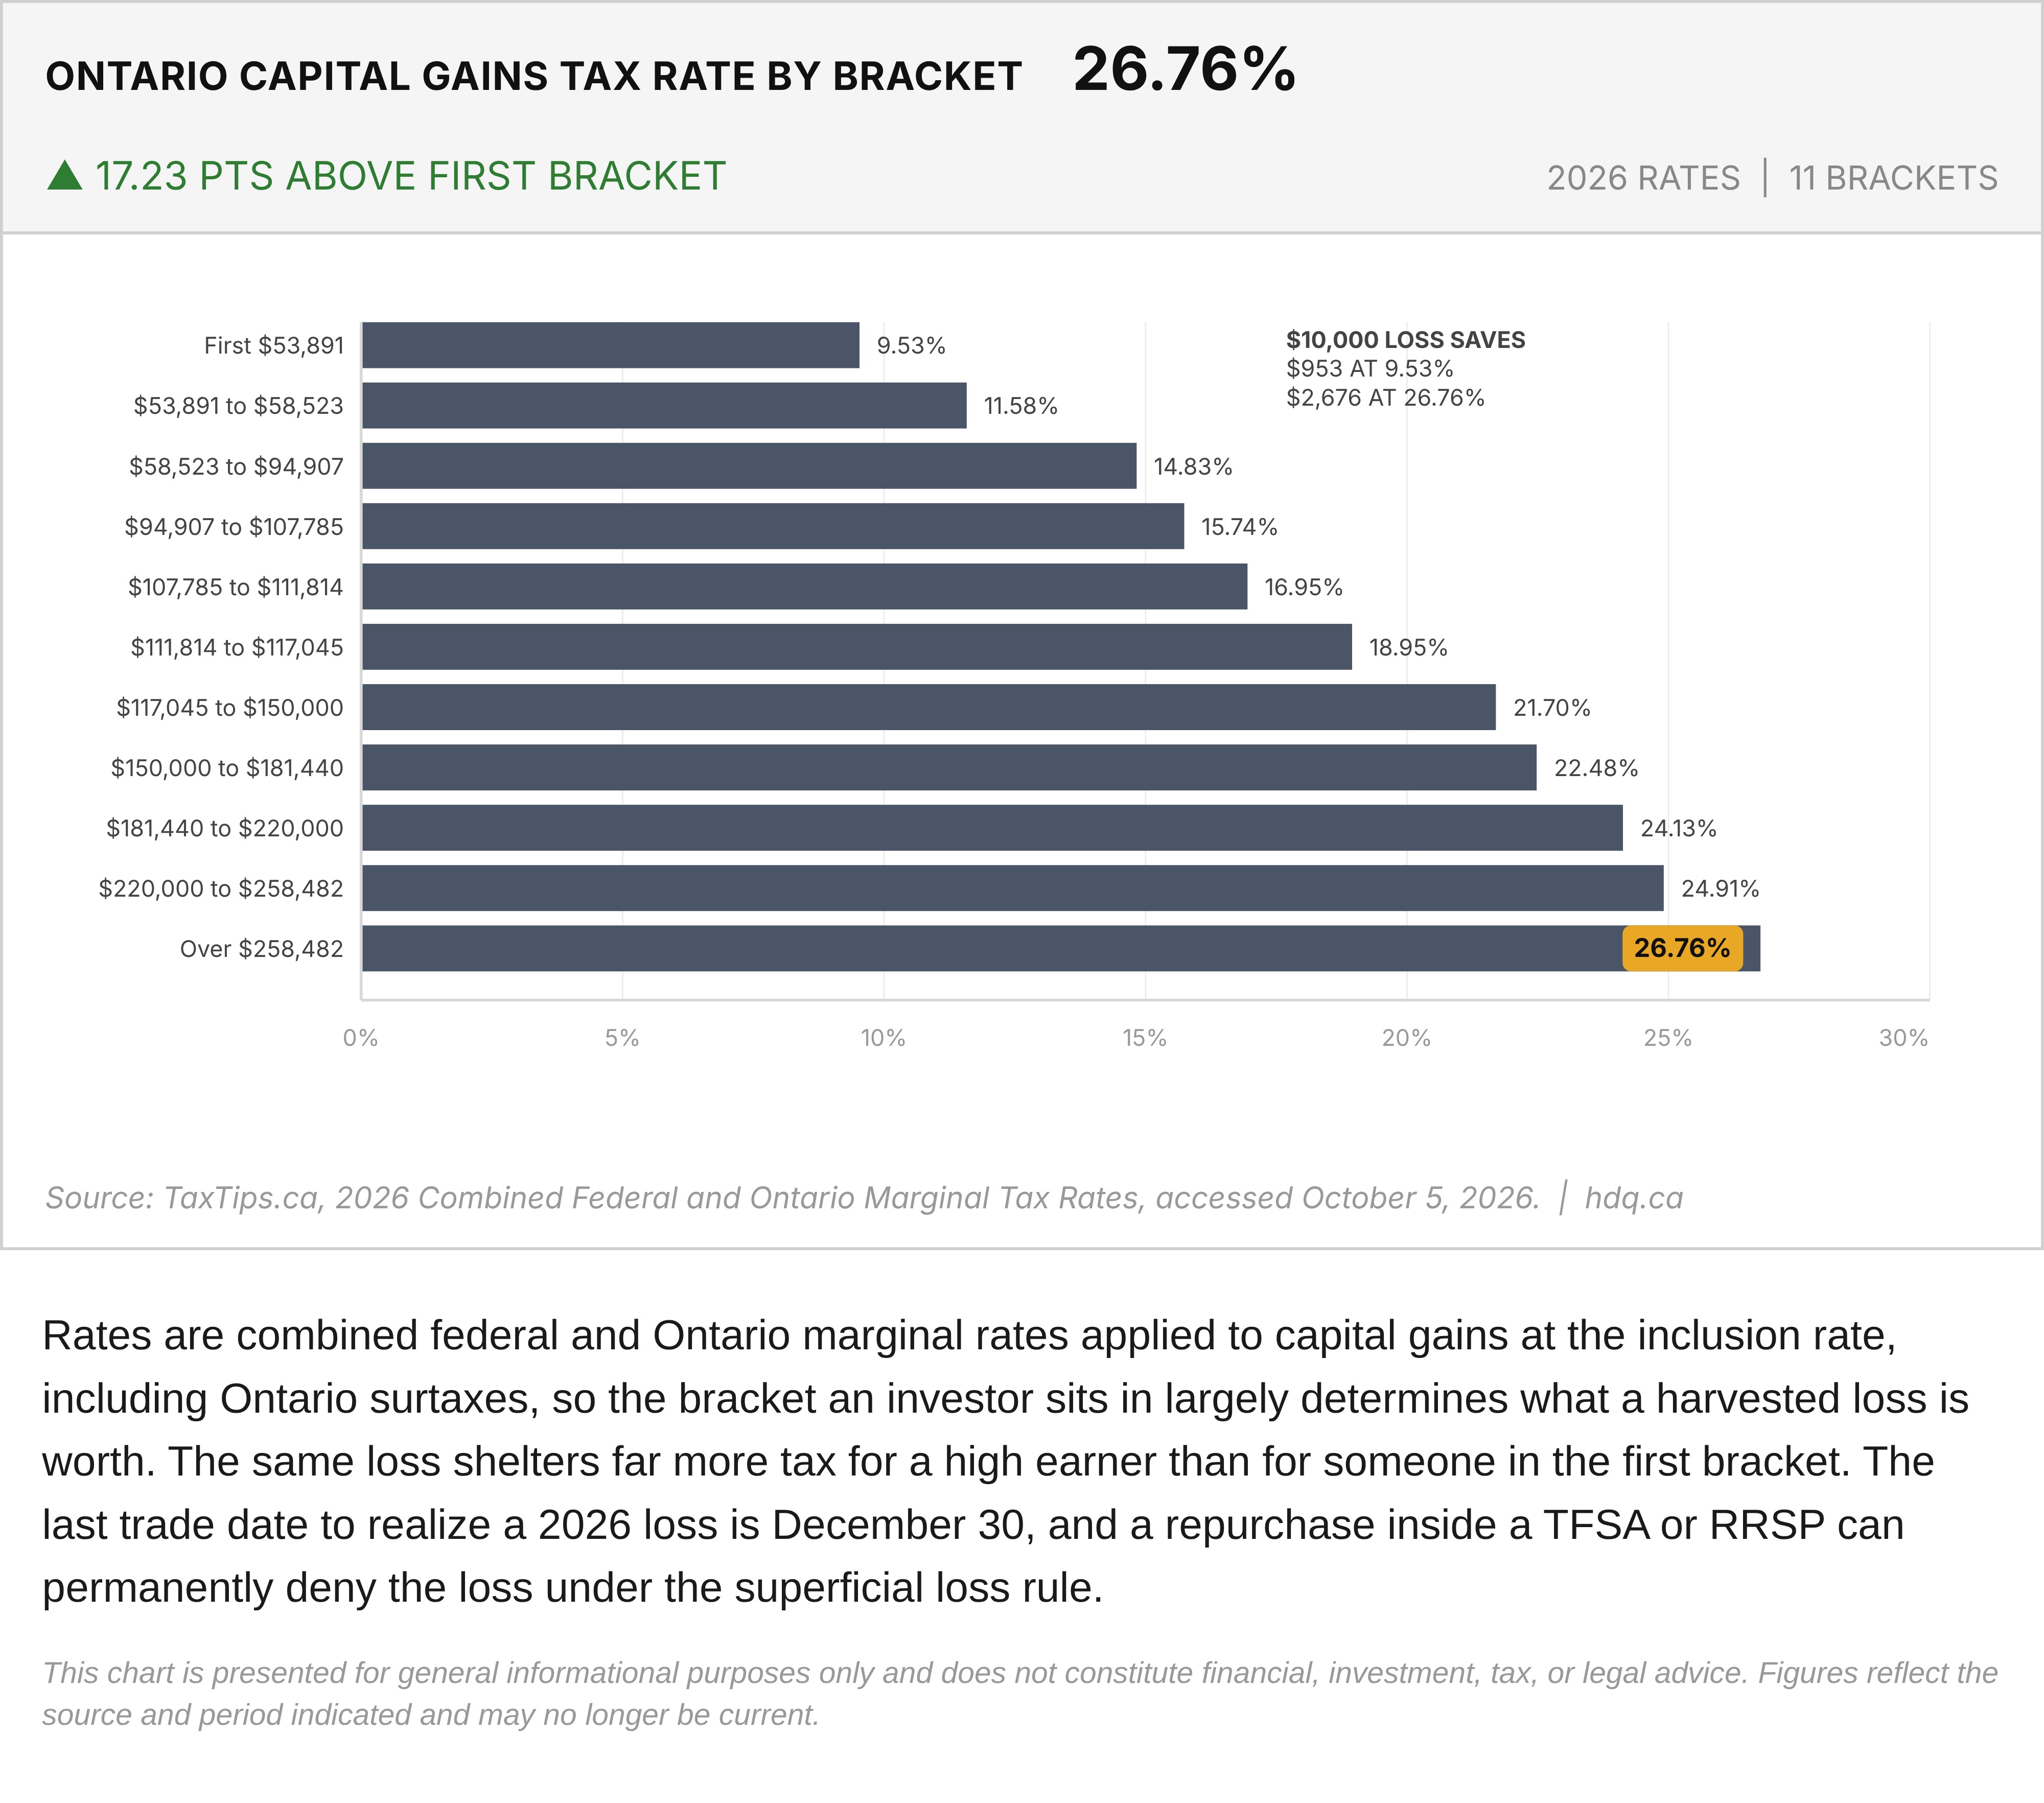
Rates are combined federal and Ontario marginal rates applied to capital gains at the inclusion rate, including Ontario surtaxes, so the bracket an investor sits in largely determines what a harvested loss is worth. The same loss shelters far more tax for a high earner than for someone in the first bracket. The last trade date to realize a 2026 loss is December 30, and a repurchase inside a TFSA or RRSP can permanently deny the loss under the superficial loss rule.
This chart is presented for general informational purposes only and does not constitute financial, investment, tax, or legal advice. Figures reflect the source and period indicated and may no longer be current.
Related charts
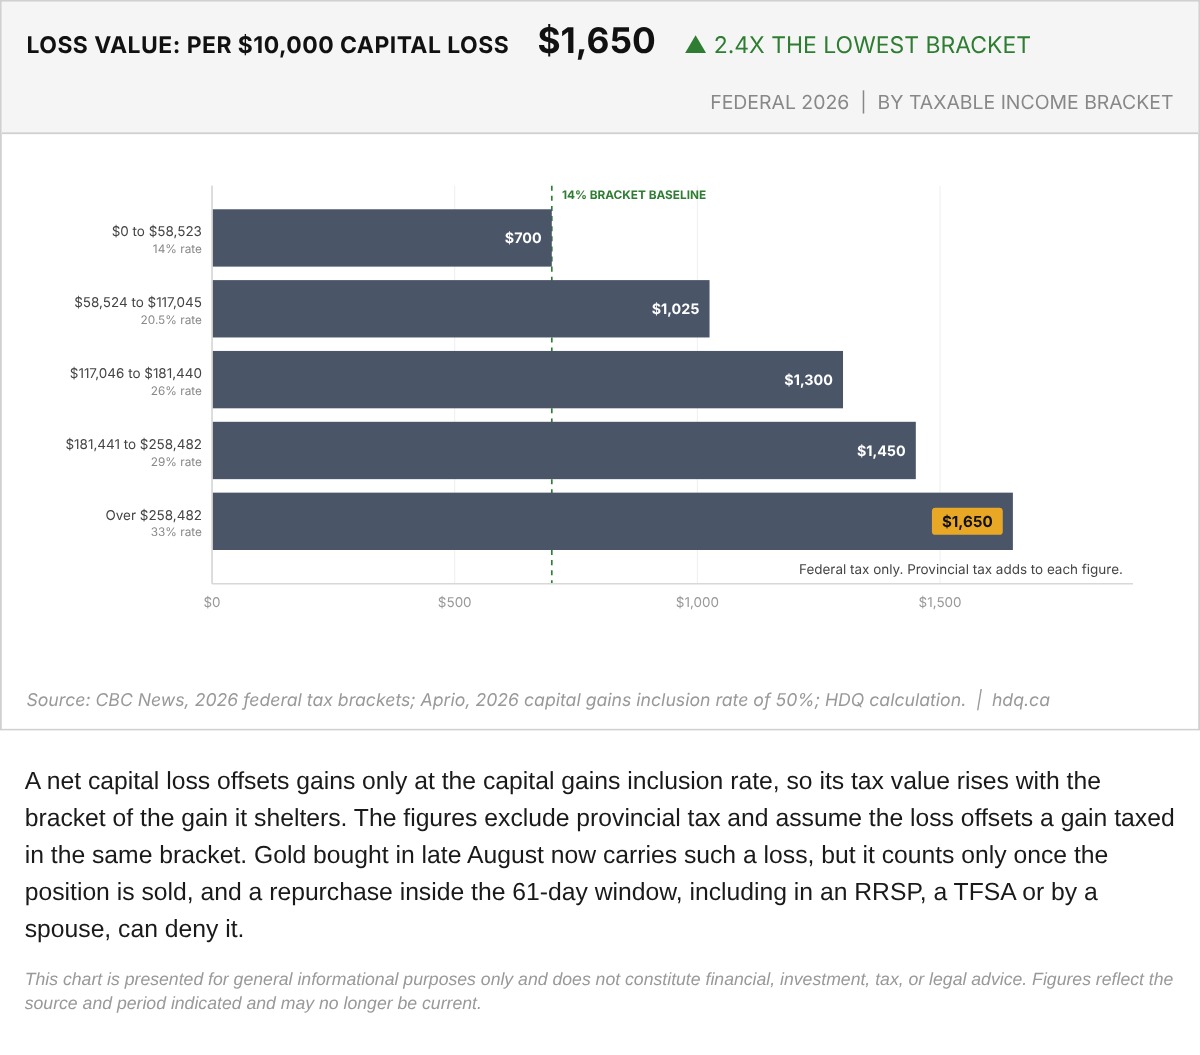
A net capital loss offsets gains only at the capital gains inclusion rate, so its tax value rises with the bracket of the gain it shelters.
Federal Tax Value of a $10,000 Capital Loss by Income Bracket, 2026
September 29, 2026
View chart & download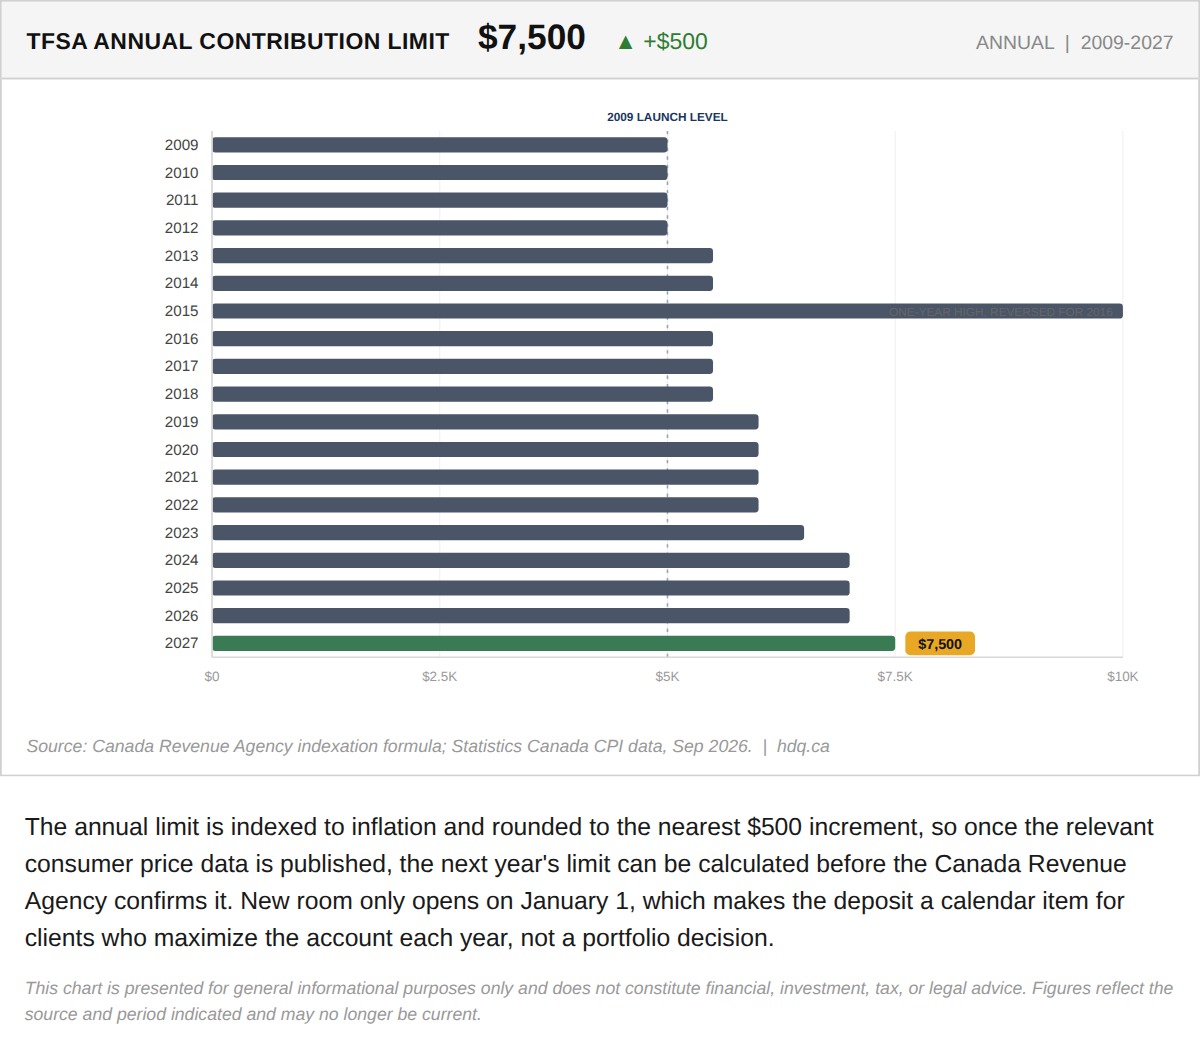
The annual limit is indexed to inflation and rounded to the nearest $500 increment, so once the relevant consumer price data is published,…
TFSA Annual Limit Set to Reach $7,500 in 2027
September 28, 2026
View chart & download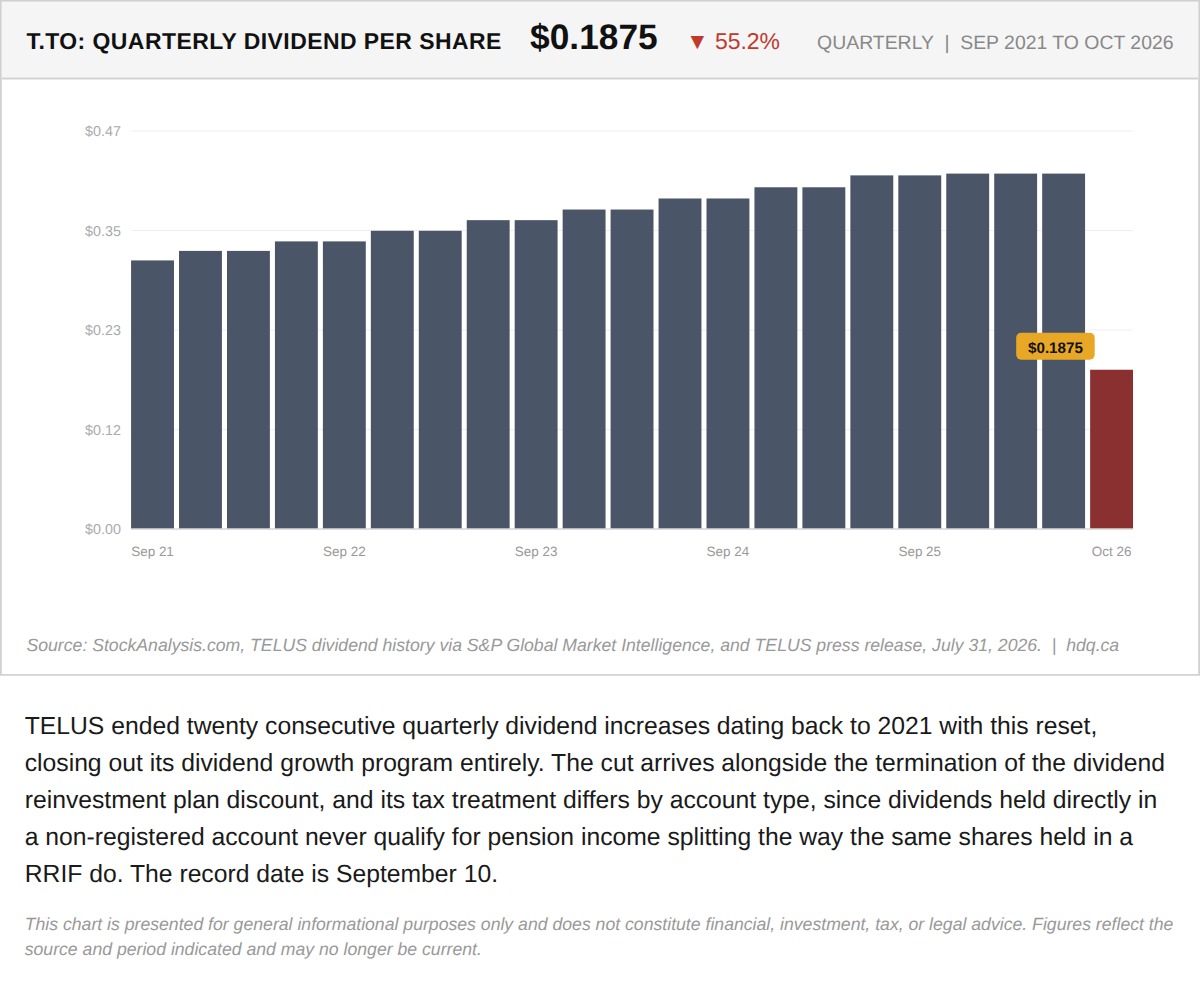
TELUS ended twenty consecutive quarterly dividend increases dating back to 2021 with this reset, closing out its dividend growth program entirely.
TELUS's Dividend Cut Ends a Five-Year Run of Increases
August 4, 2026
View chart & download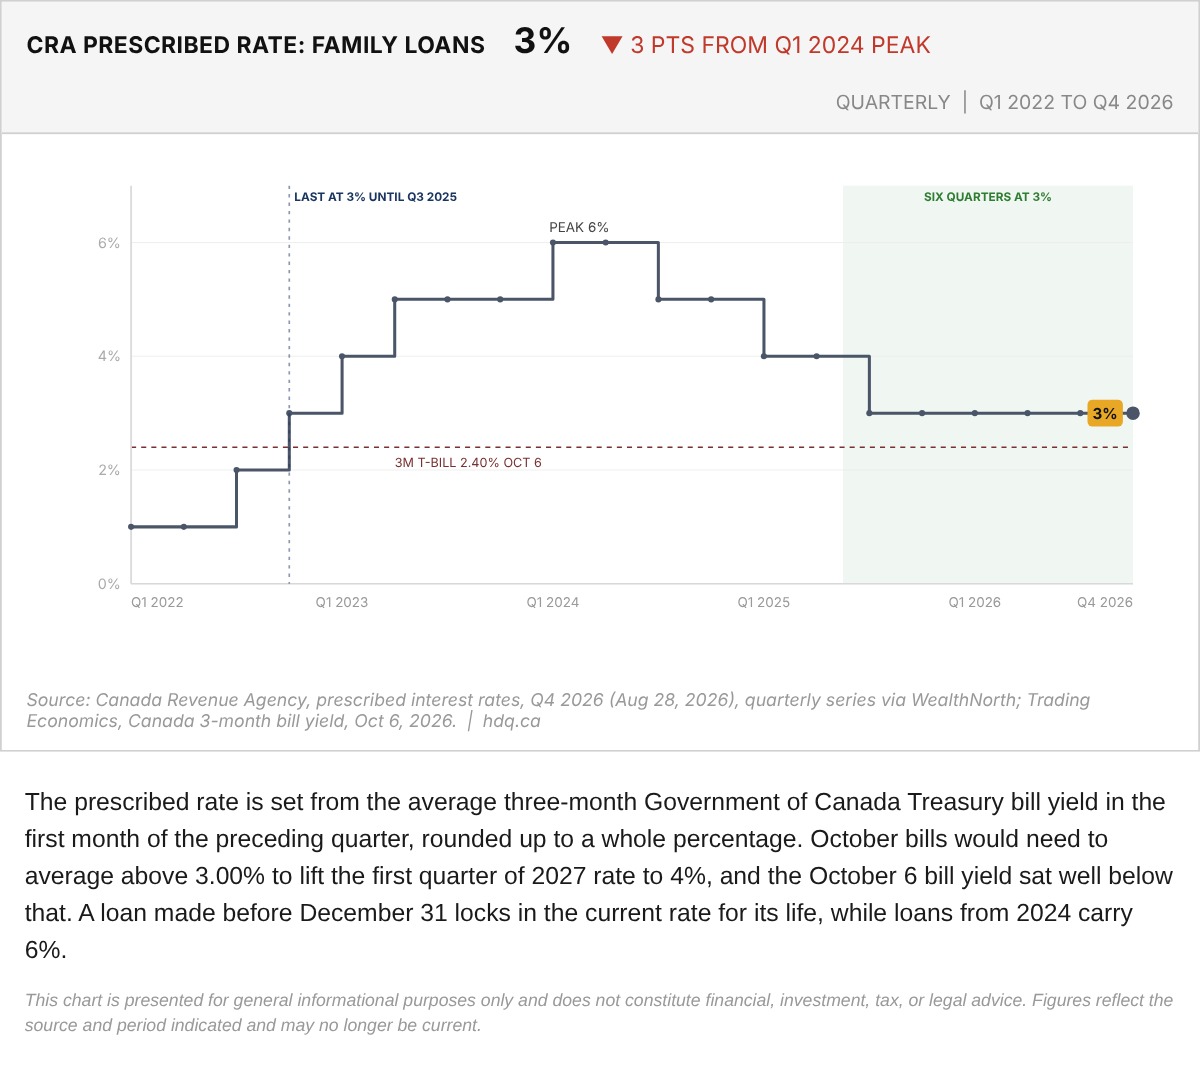
The prescribed rate is set from the average three-month Government of Canada Treasury bill yield in the first month of the preceding quarter, rounded up to a whole percentage.
CRA Prescribed Rate for Family Loans, Q1 2022 to Q4 2026
October 7, 2026
View chart & download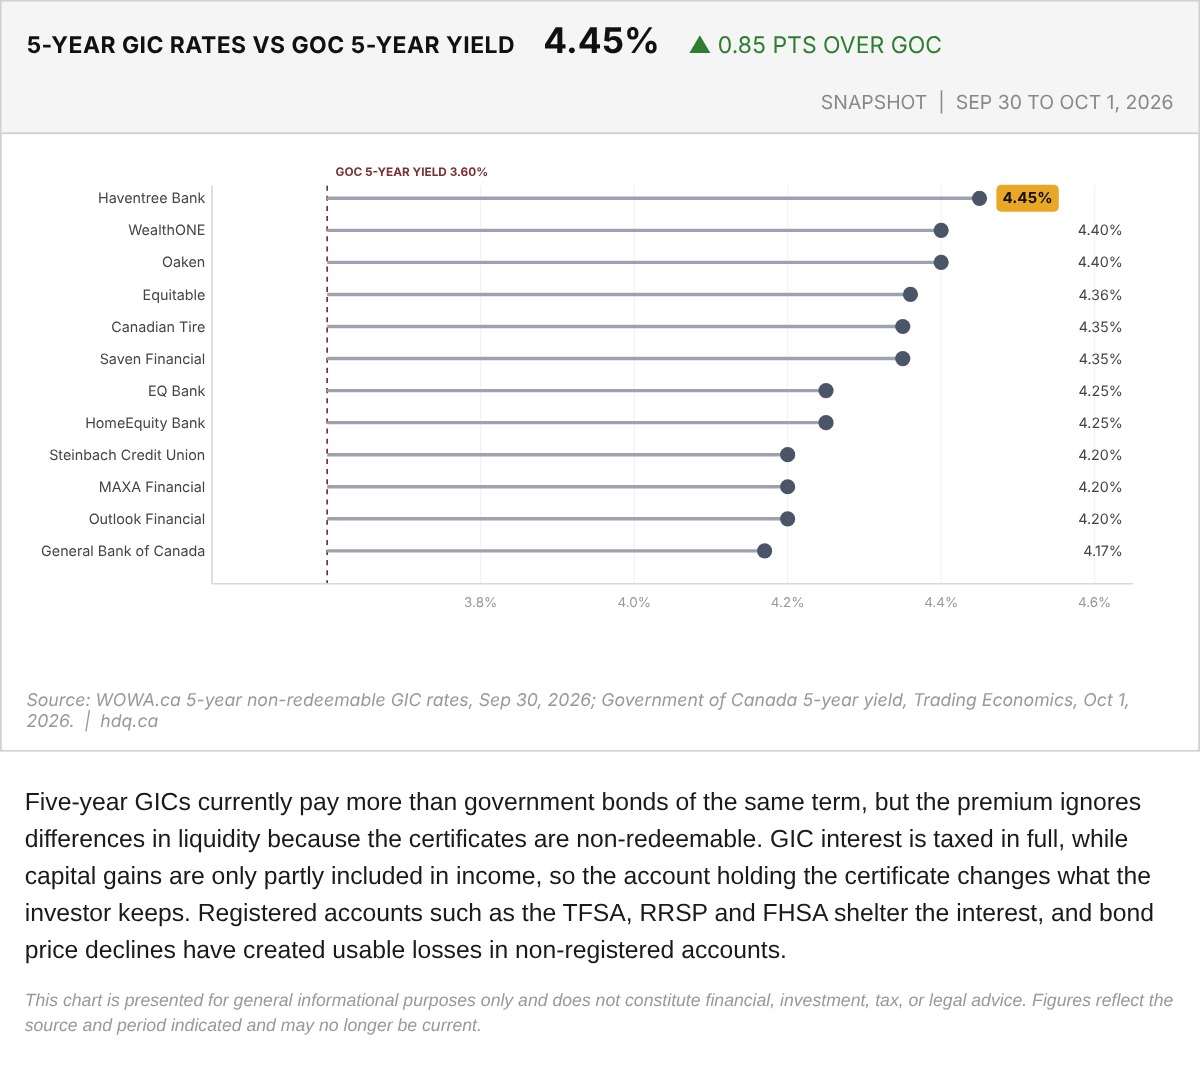
Five-year GICs currently pay more than government bonds of the same term, but the premium ignores differences in liquidity because the certificates are non-redeemable.
Five-Year GIC Rates Versus the Government of Canada 5-Year Yield, September 30 to October 1, 2026
October 2, 2026
View chart & download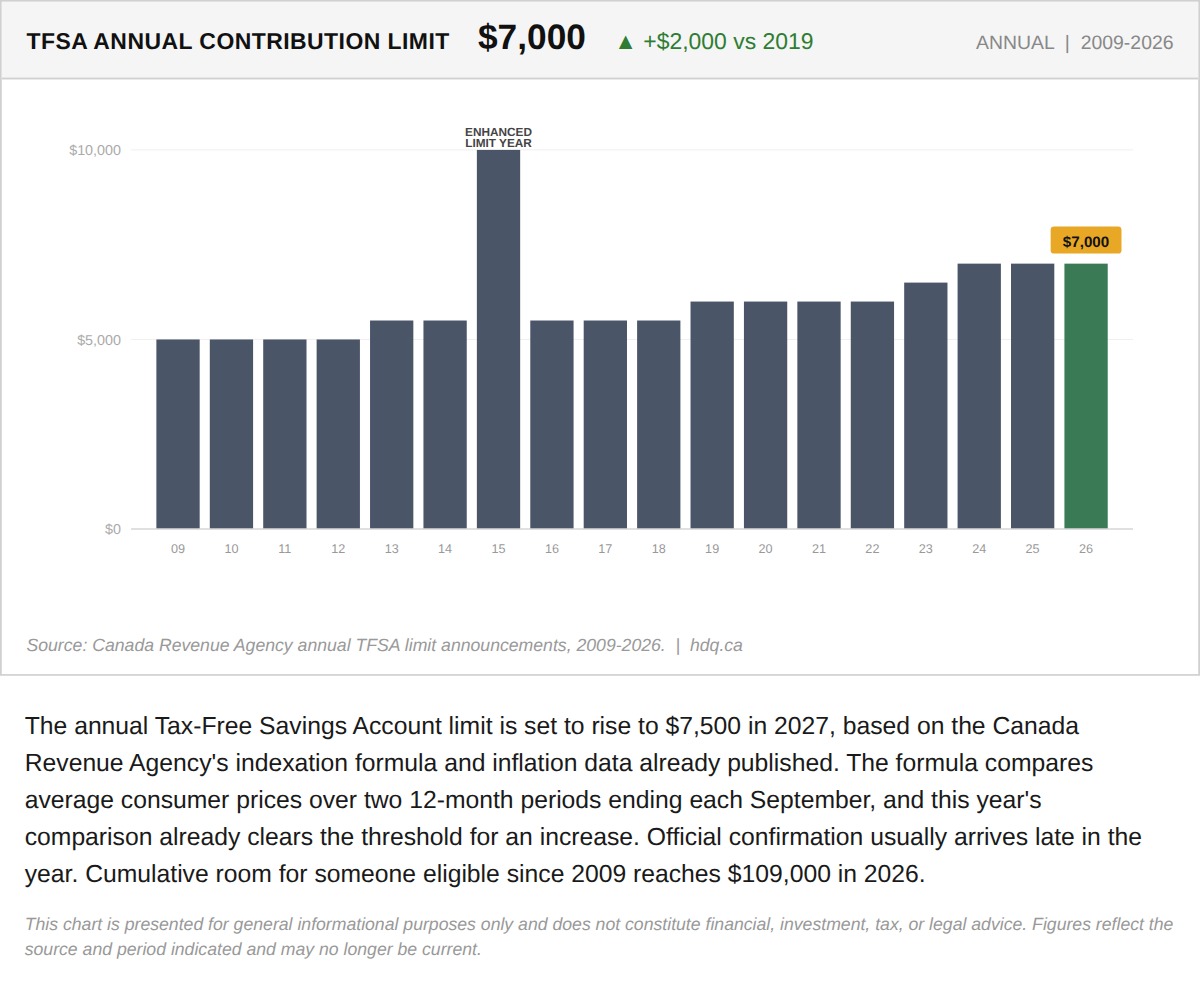
The annual Tax-Free Savings Account limit is set to rise to $7,500 in 2027, based on the Canada Revenue Agency's indexation formula and inflation data already published.
The 2027 TFSA Limit Is Already Locked In at $7,500
September 23, 2026
View chart & download