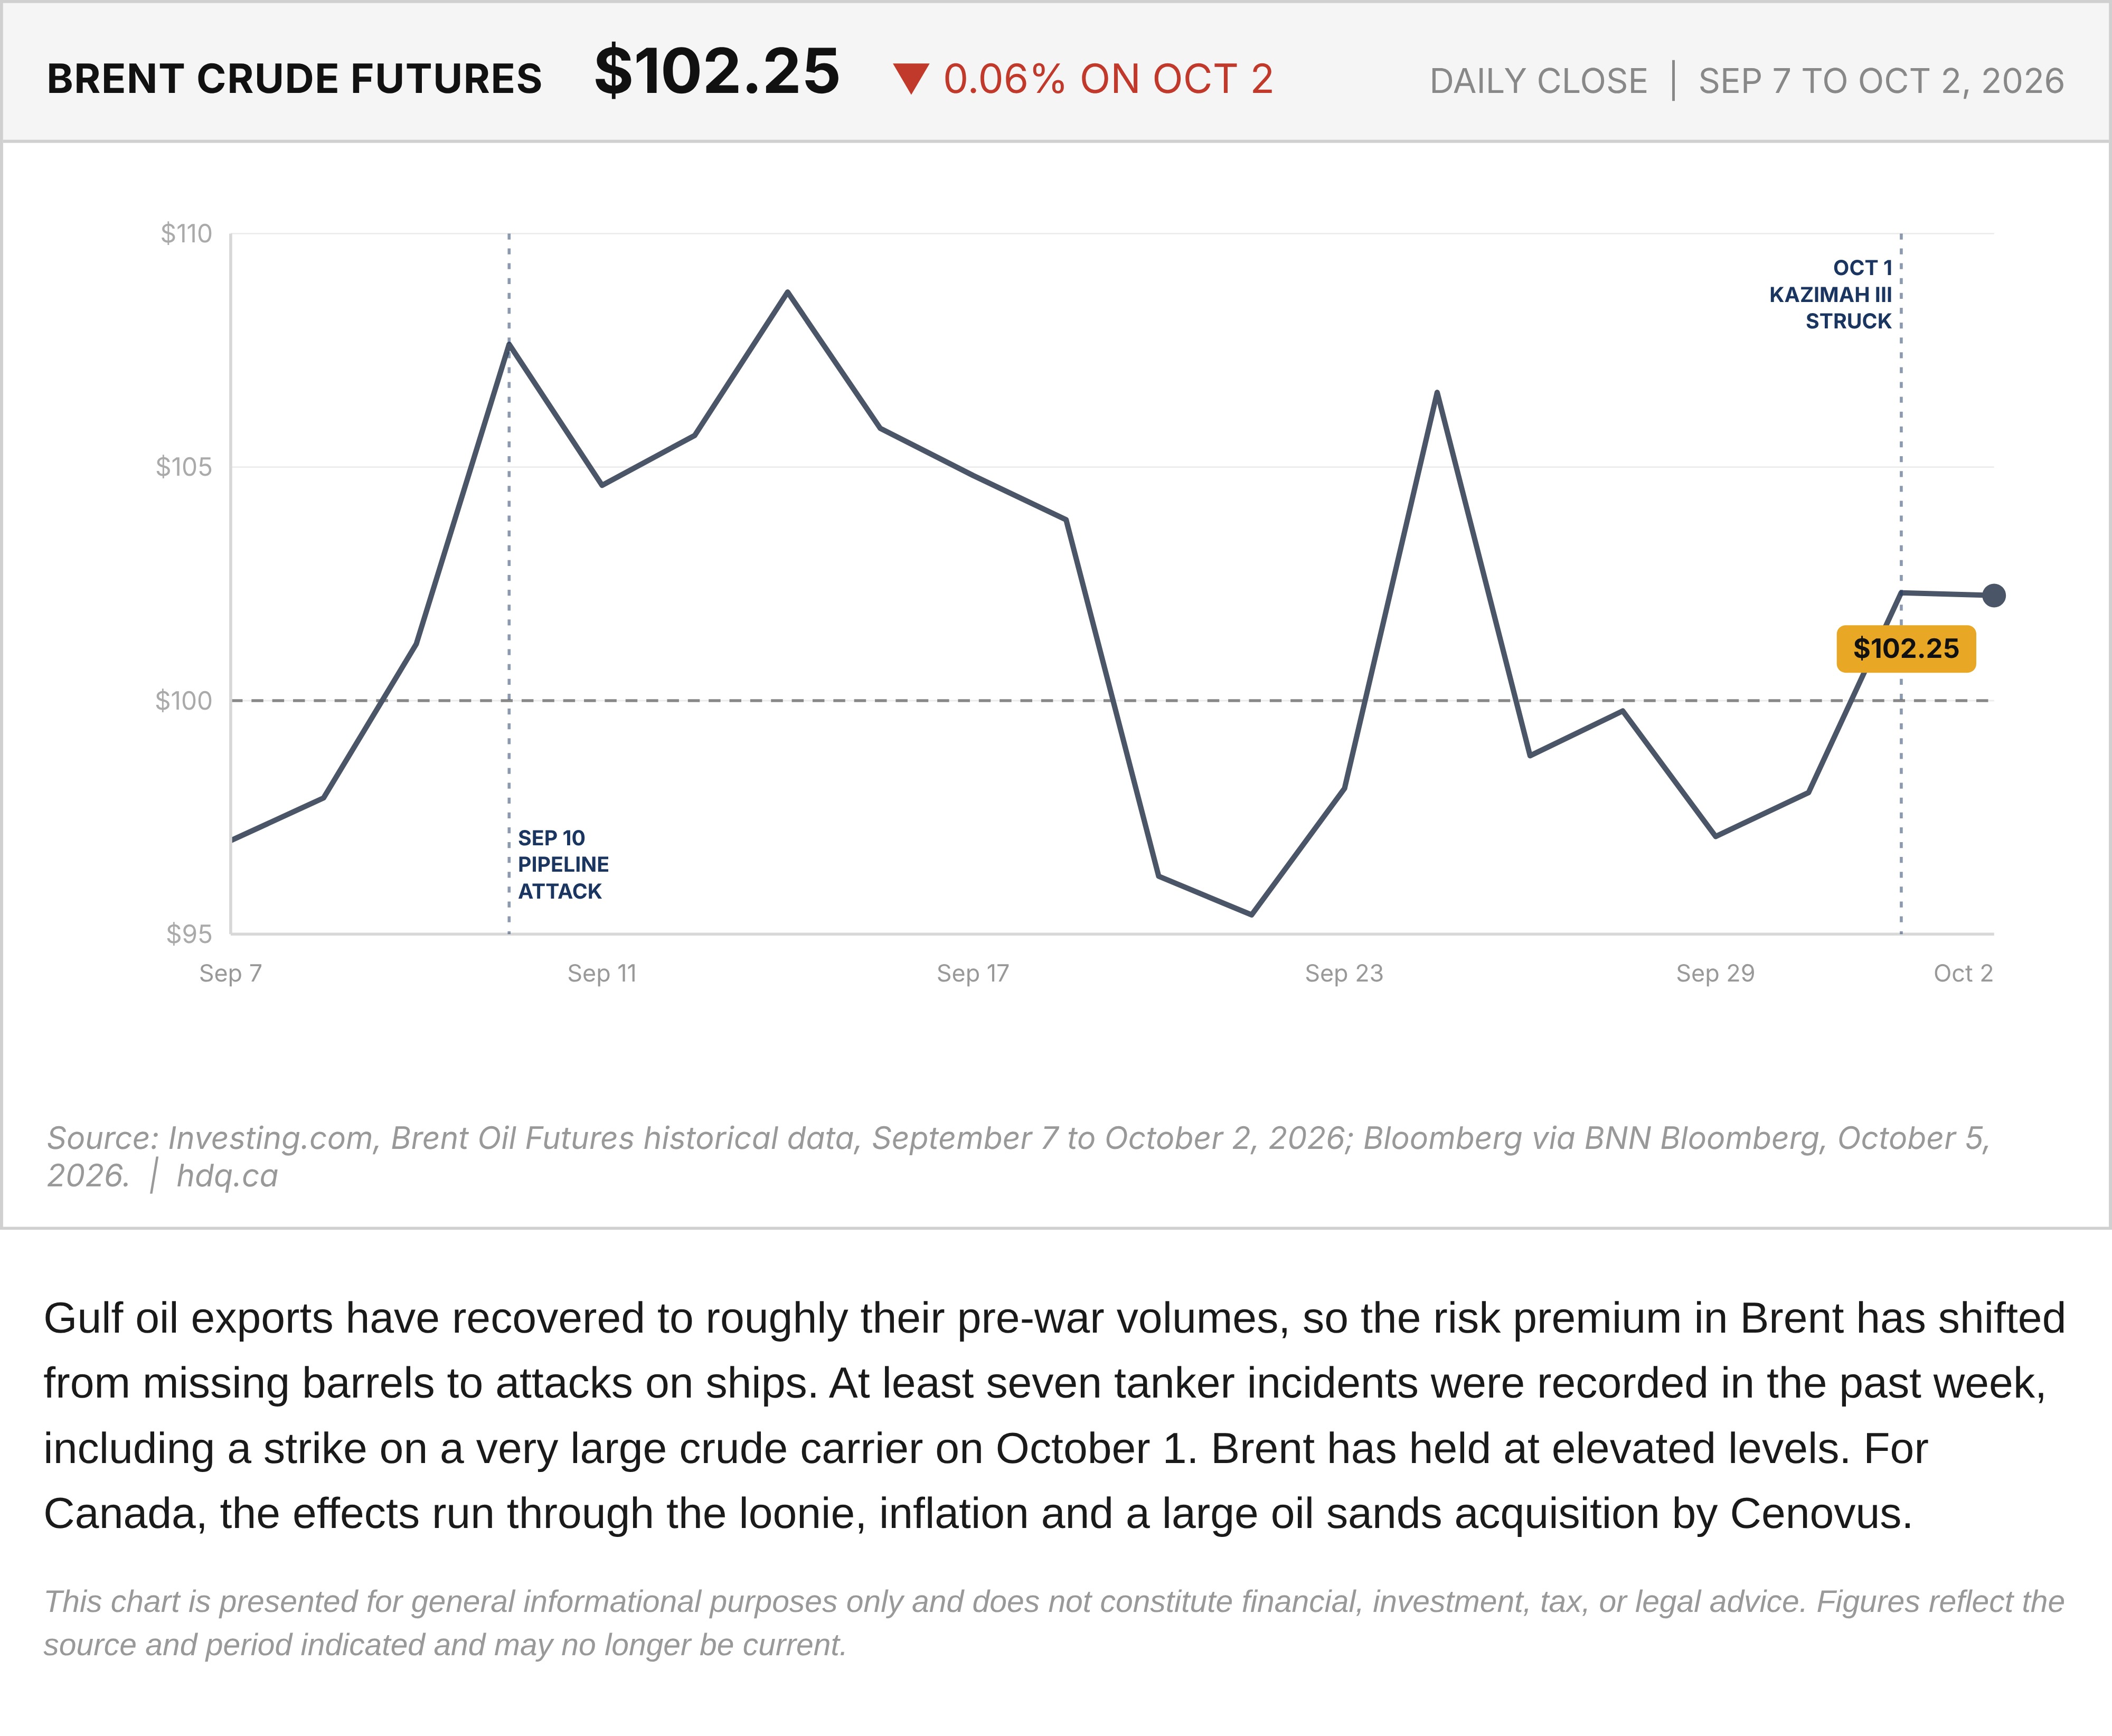
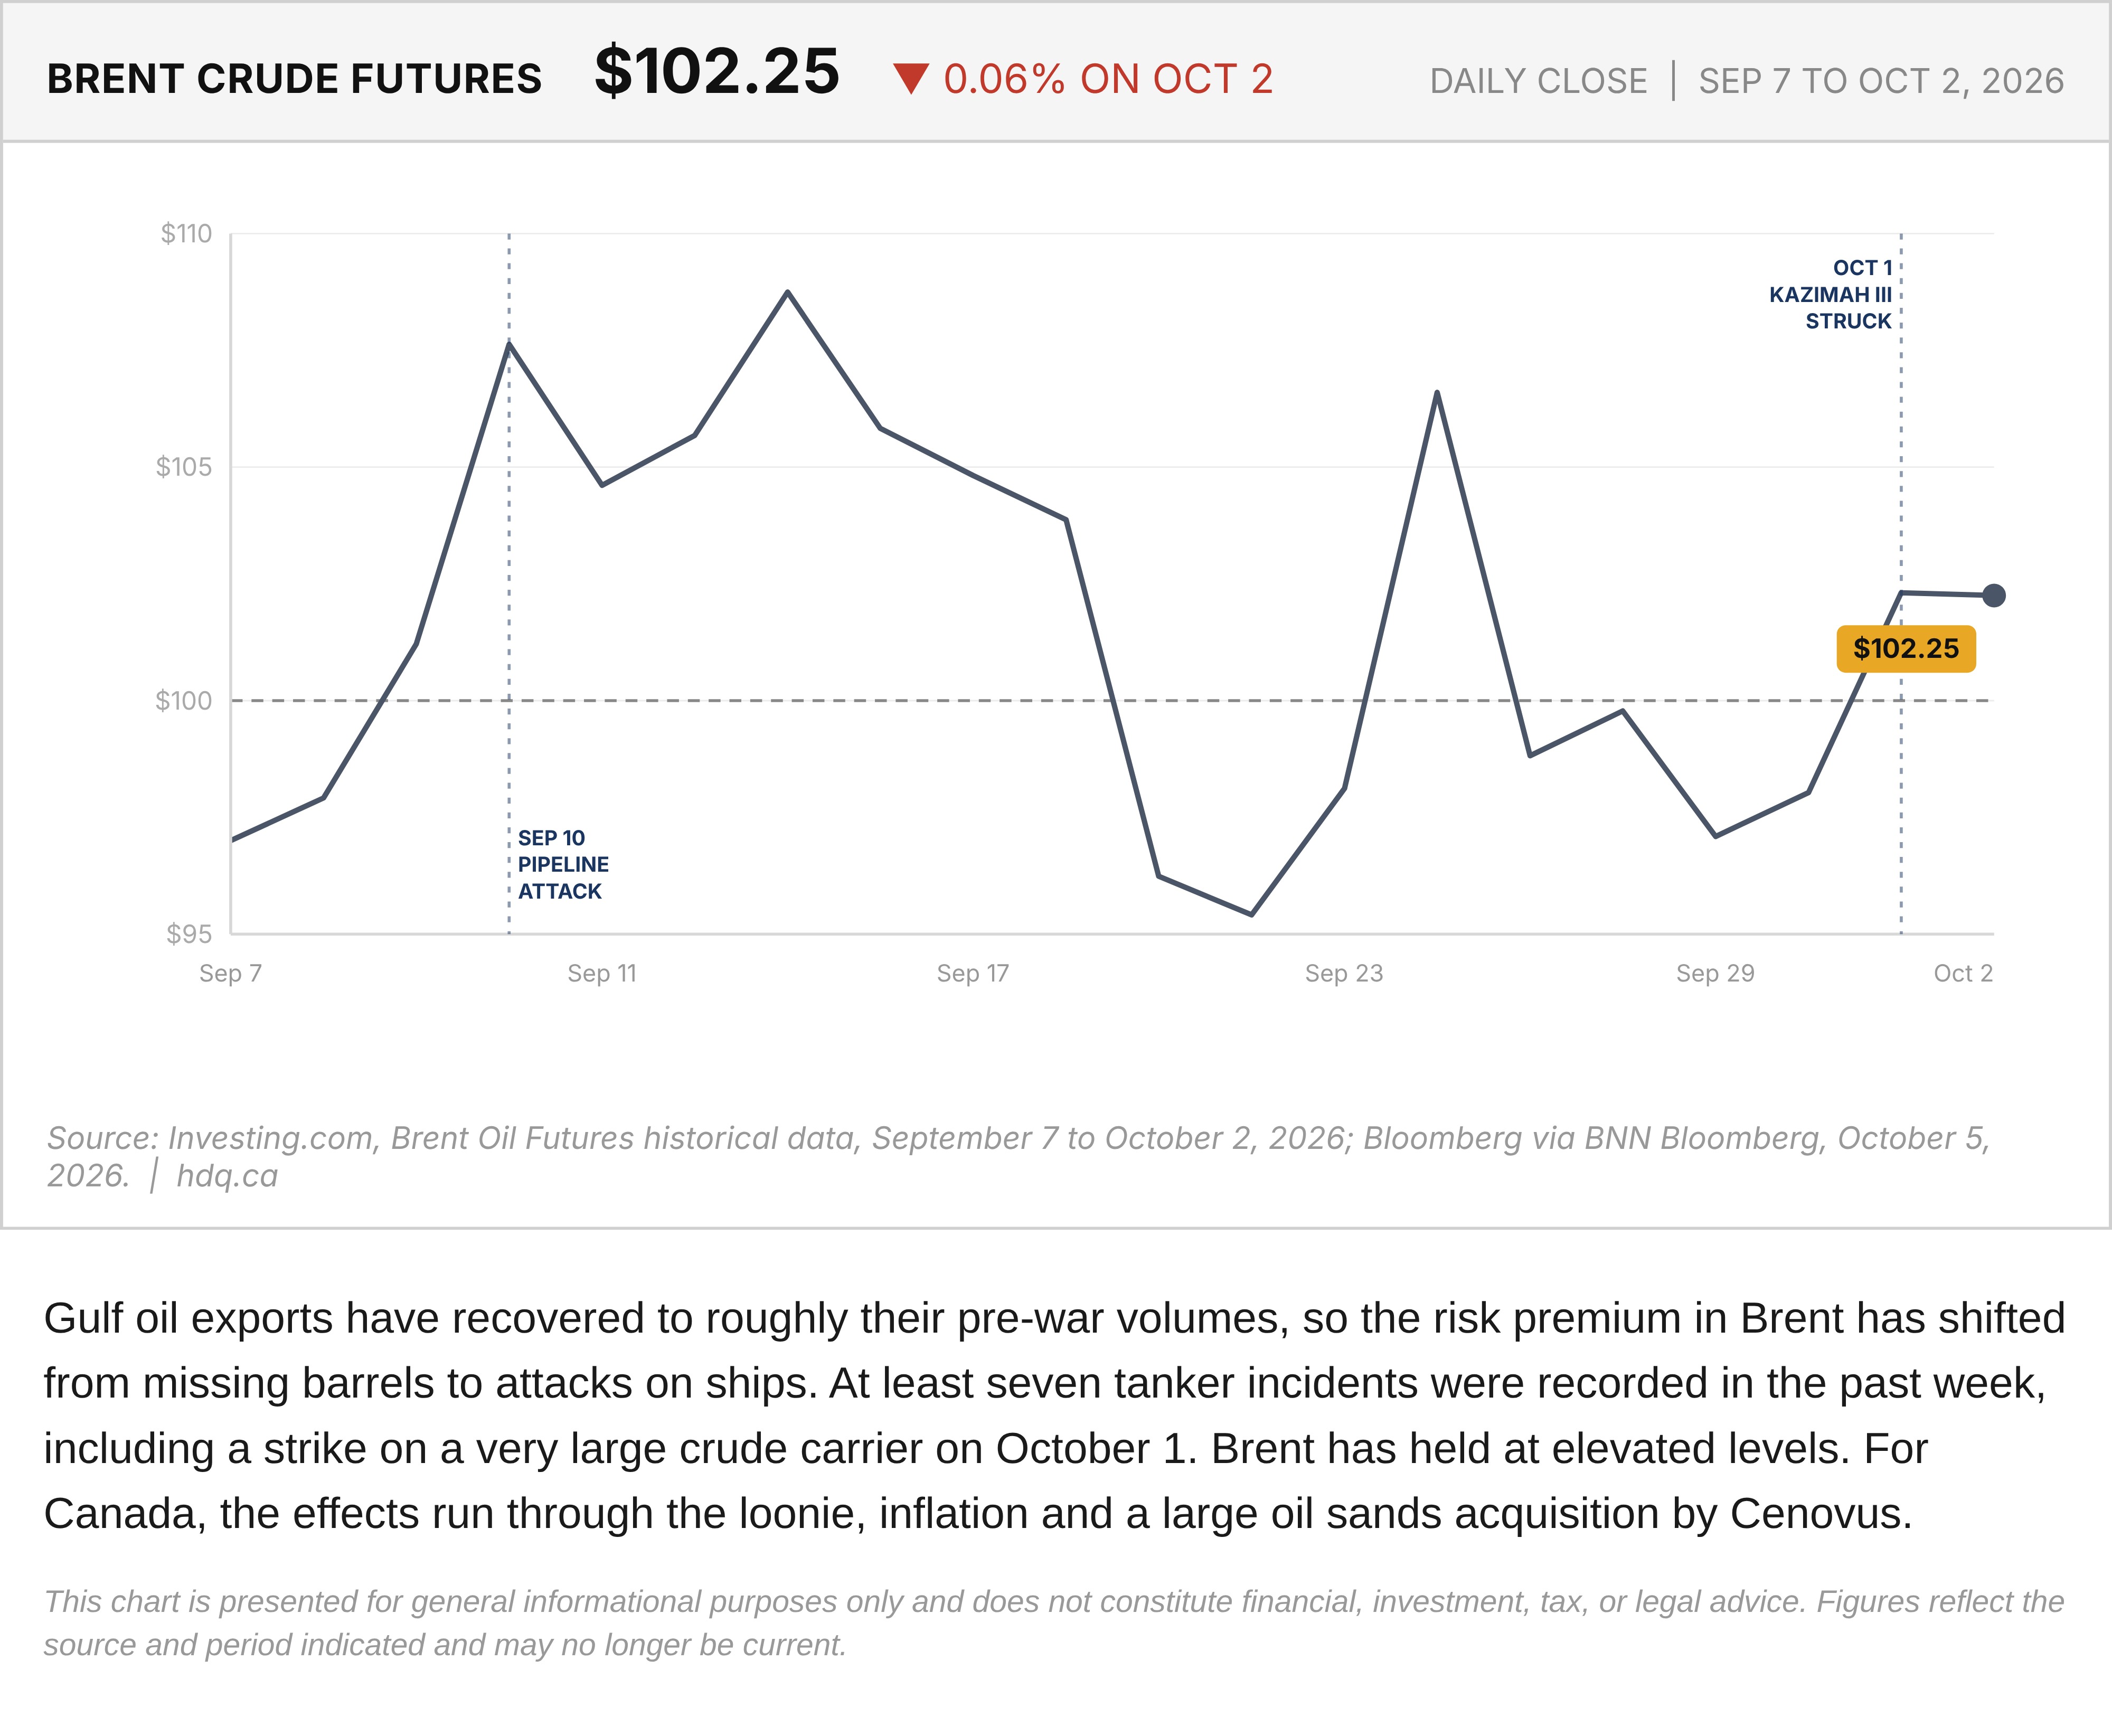
Gulf oil exports have recovered to roughly their pre-war volumes, so the risk premium in Brent has shifted from missing barrels to attacks on ships. At least seven tanker incidents were recorded in the past week, including a strike on a very large crude carrier on October 1. Brent has held at elevated levels. For Canada, the effects run through the loonie, inflation and a large oil sands acquisition by Cenovus.
This chart is presented for general informational purposes only and does not constitute financial, investment, tax, or legal advice. Figures reflect the source and period indicated and may no longer be current.
Related charts
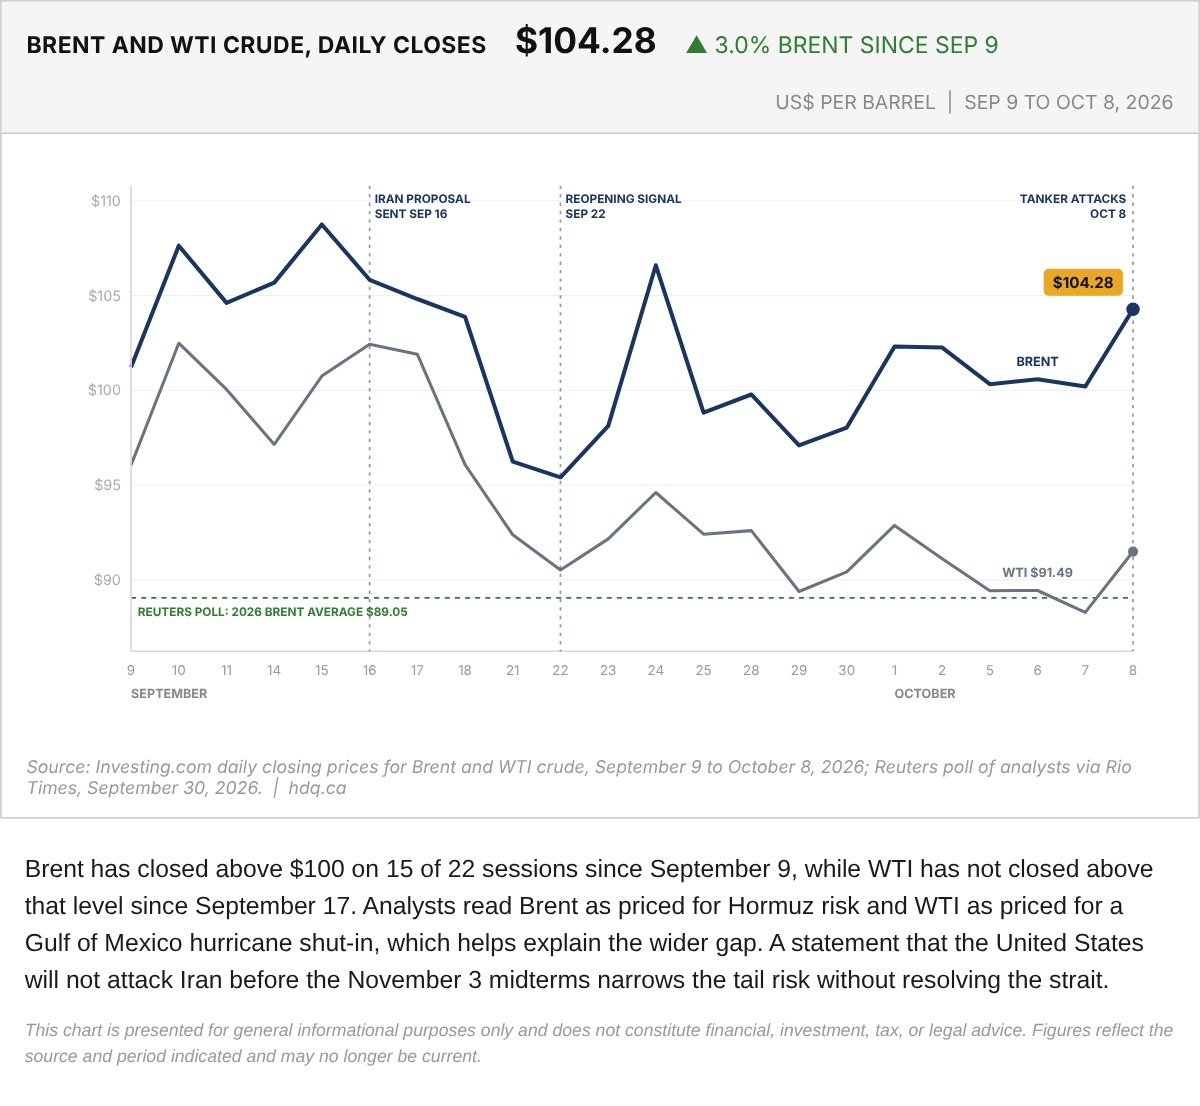
Brent has closed above $100 on 15 of 22 sessions since September 9, while WTI has not closed above that level since September 17.
Brent and WTI Crude Daily Closes, September 9 to October 8
October 9, 2026
View chart & download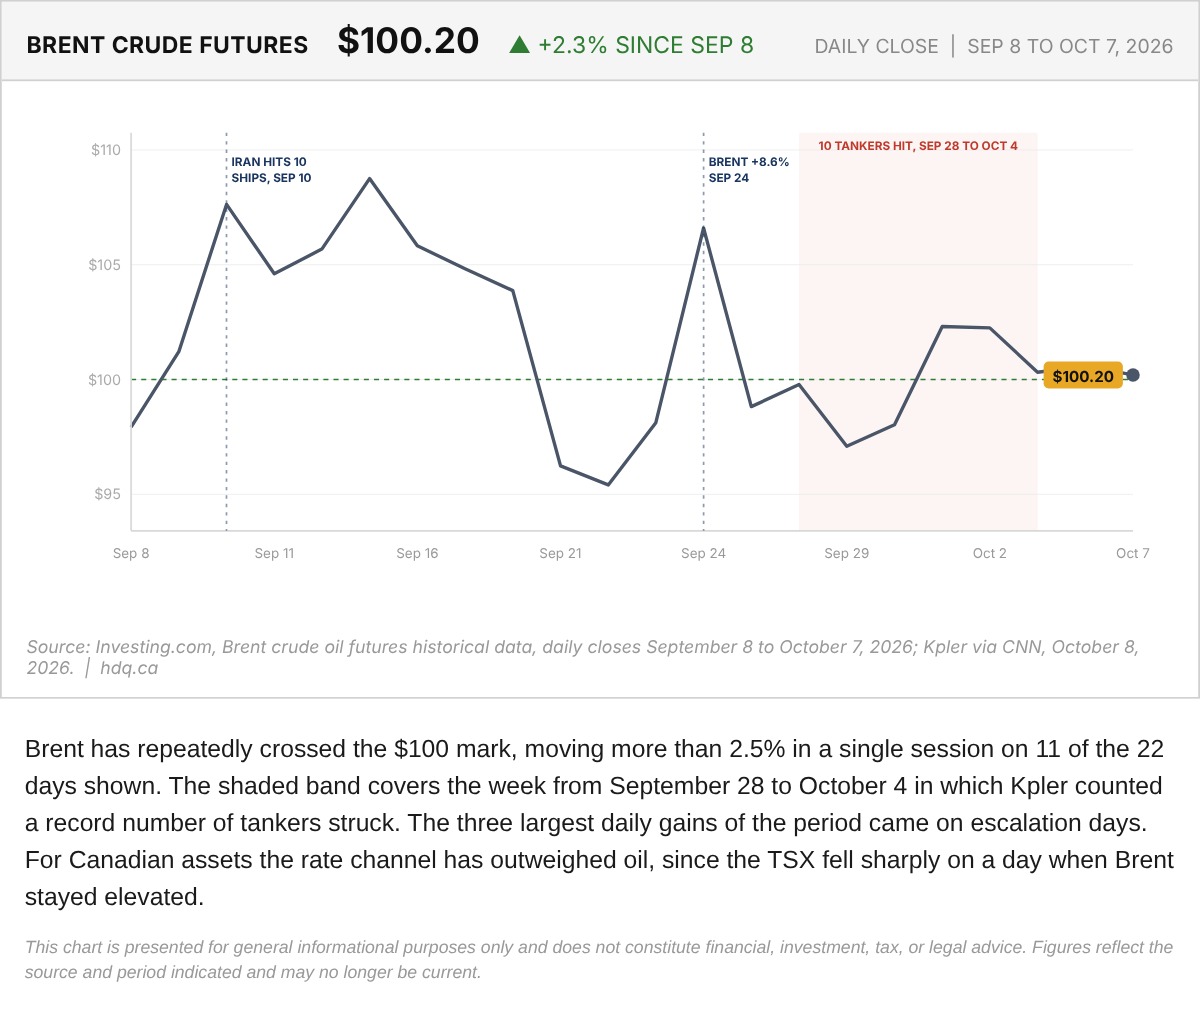
Brent has repeatedly crossed the $100 mark, moving more than 2.5% in a single session on 11 of the 22 days shown.
Brent Crude Futures Daily Close, September 8 to October 7
October 8, 2026
View chart & download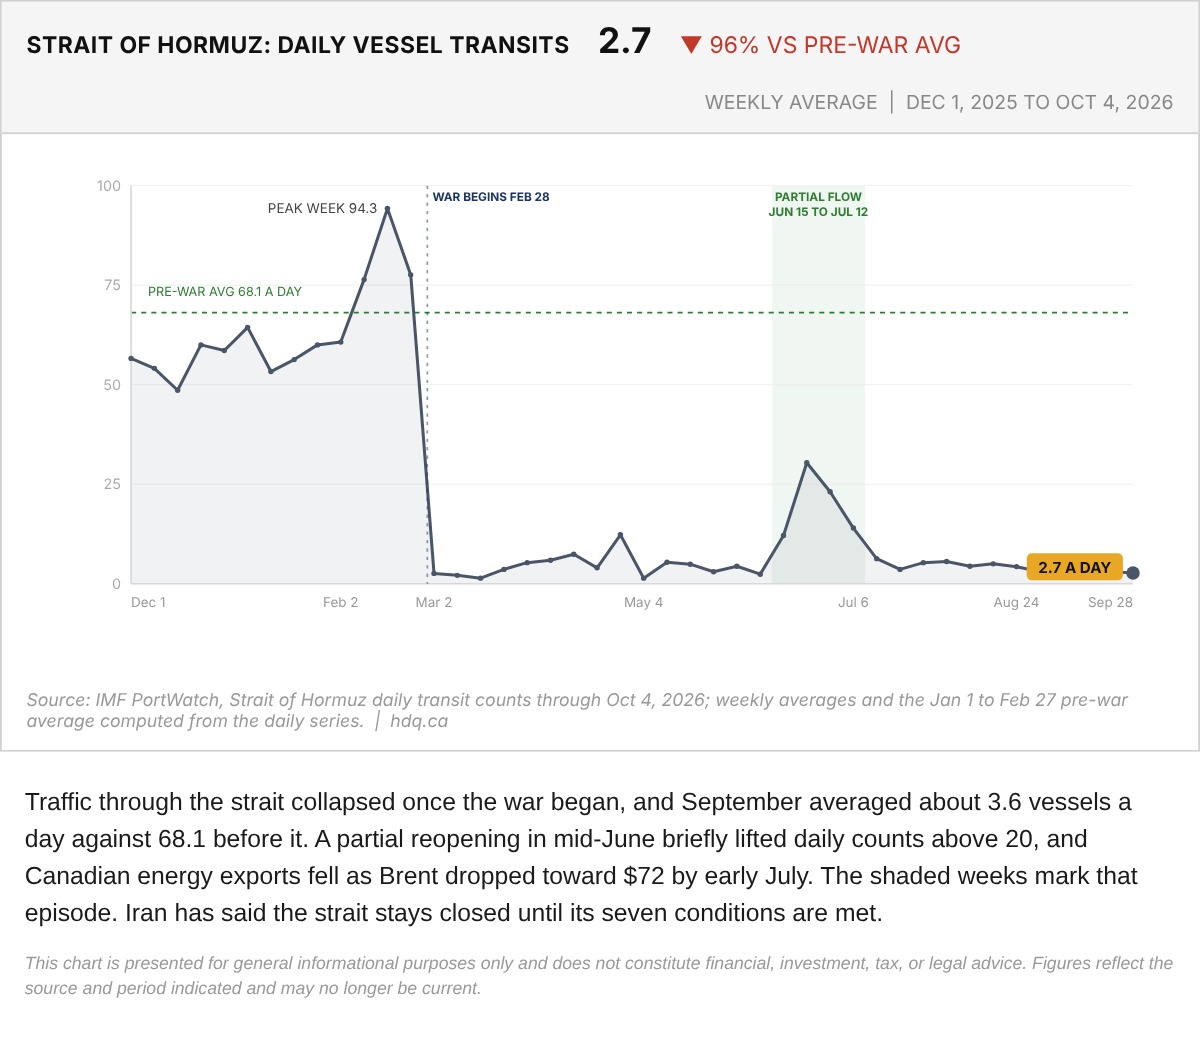
Traffic through the strait collapsed once the war began, and September averaged about 3.6 vessels a day against 68.1 before it.
Strait of Hormuz Weekly Average Vessel Transits, December 2025 to October 2026
October 7, 2026
View chart & download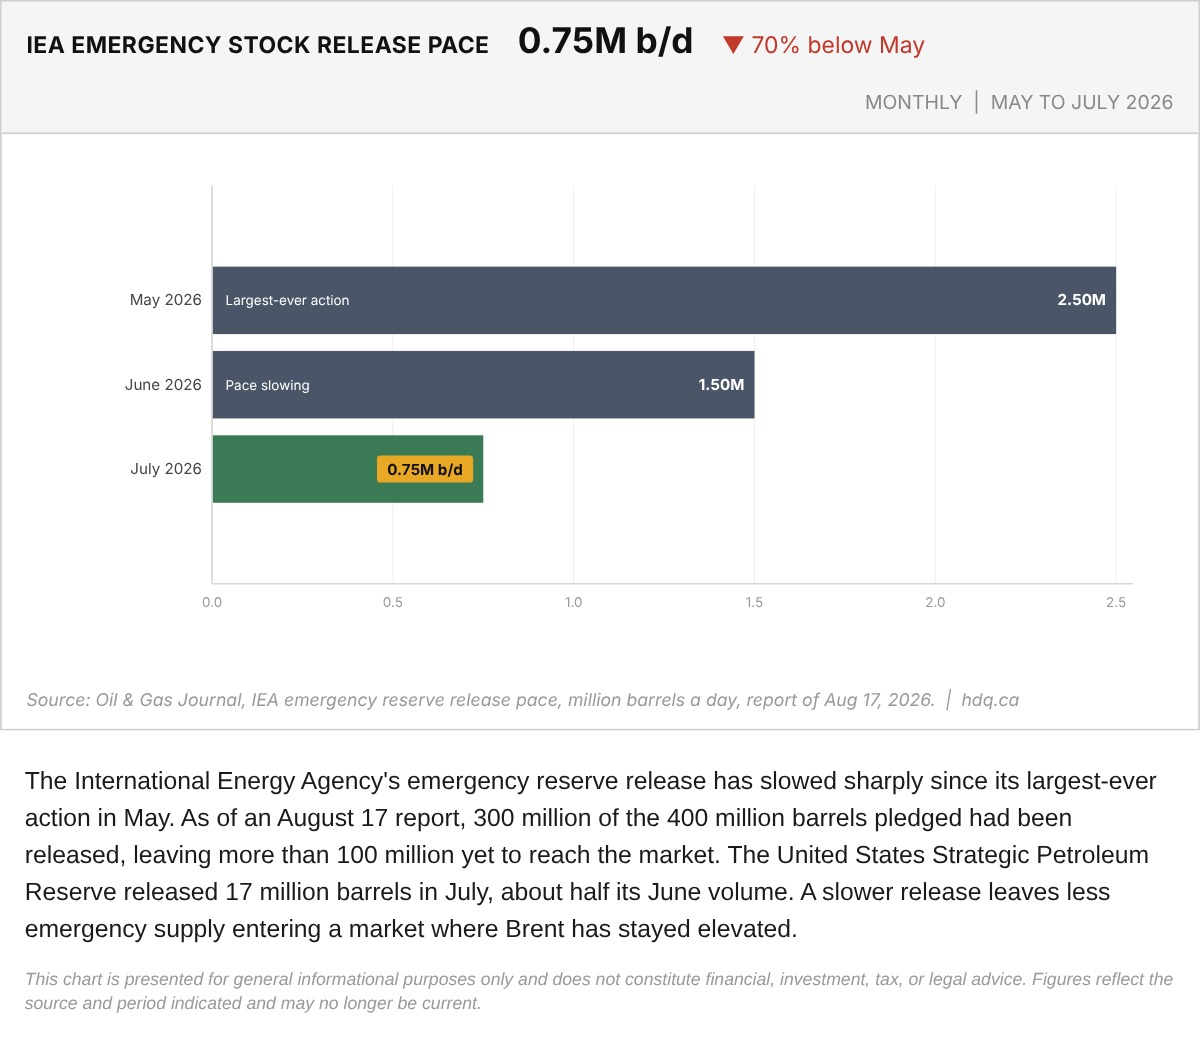
The International Energy Agency's emergency reserve release has slowed sharply since its largest-ever action in May.
IEA Emergency Oil Stock Release Pace, May to July 2026
October 6, 2026
View chart & download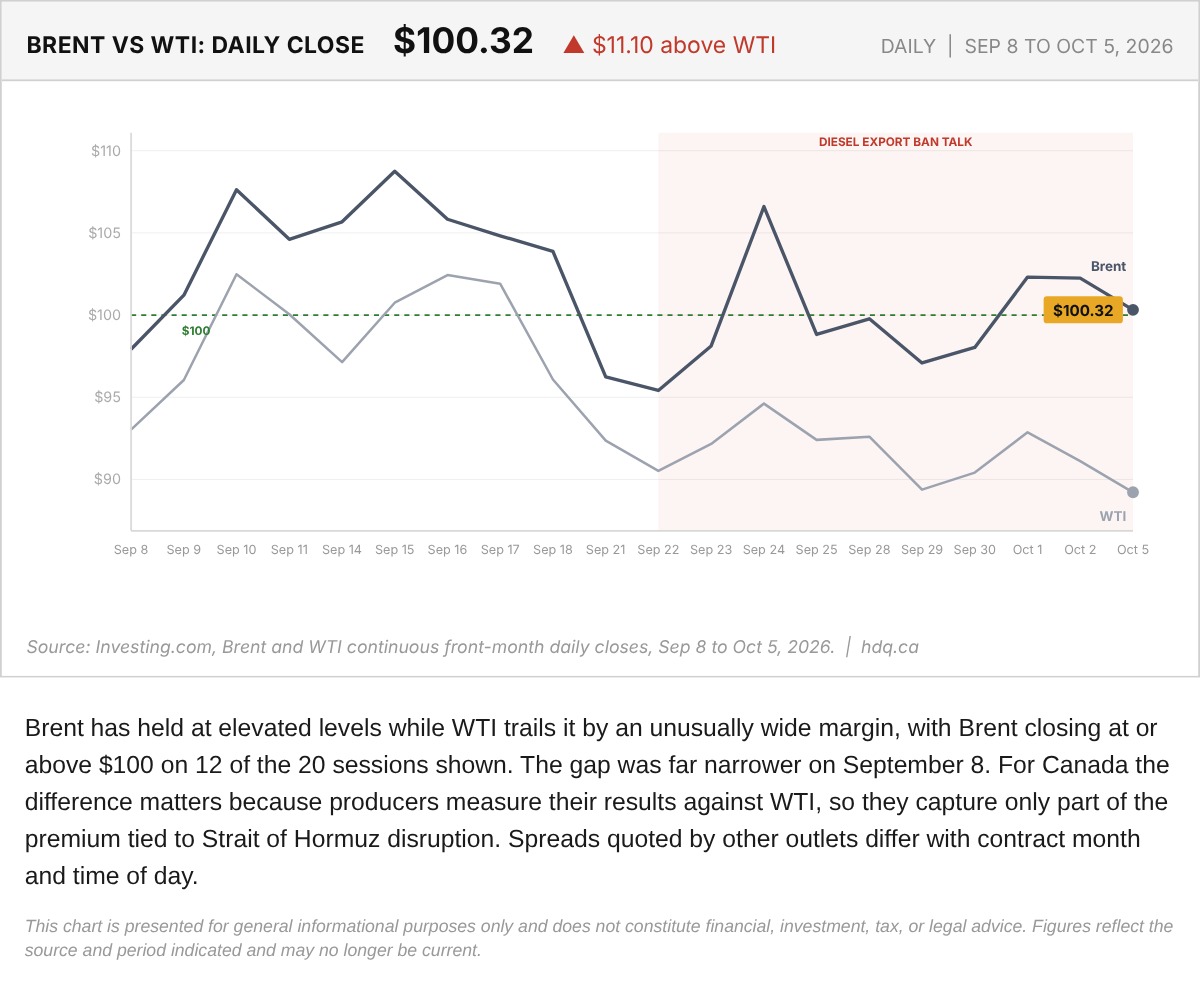
Brent has held at elevated levels while WTI trails it by an unusually wide margin, with Brent closing at or above $100 on 12 of the 20 sessions shown.
Brent and WTI Daily Closes, September 8 to October 5
October 6, 2026
View chart & download
Brent was the only one of the three to finish above its starting level, while the index and gold both fell.
Brent, TSX and Gold Rebased to the August 31 Close
September 30, 2026
View chart & download