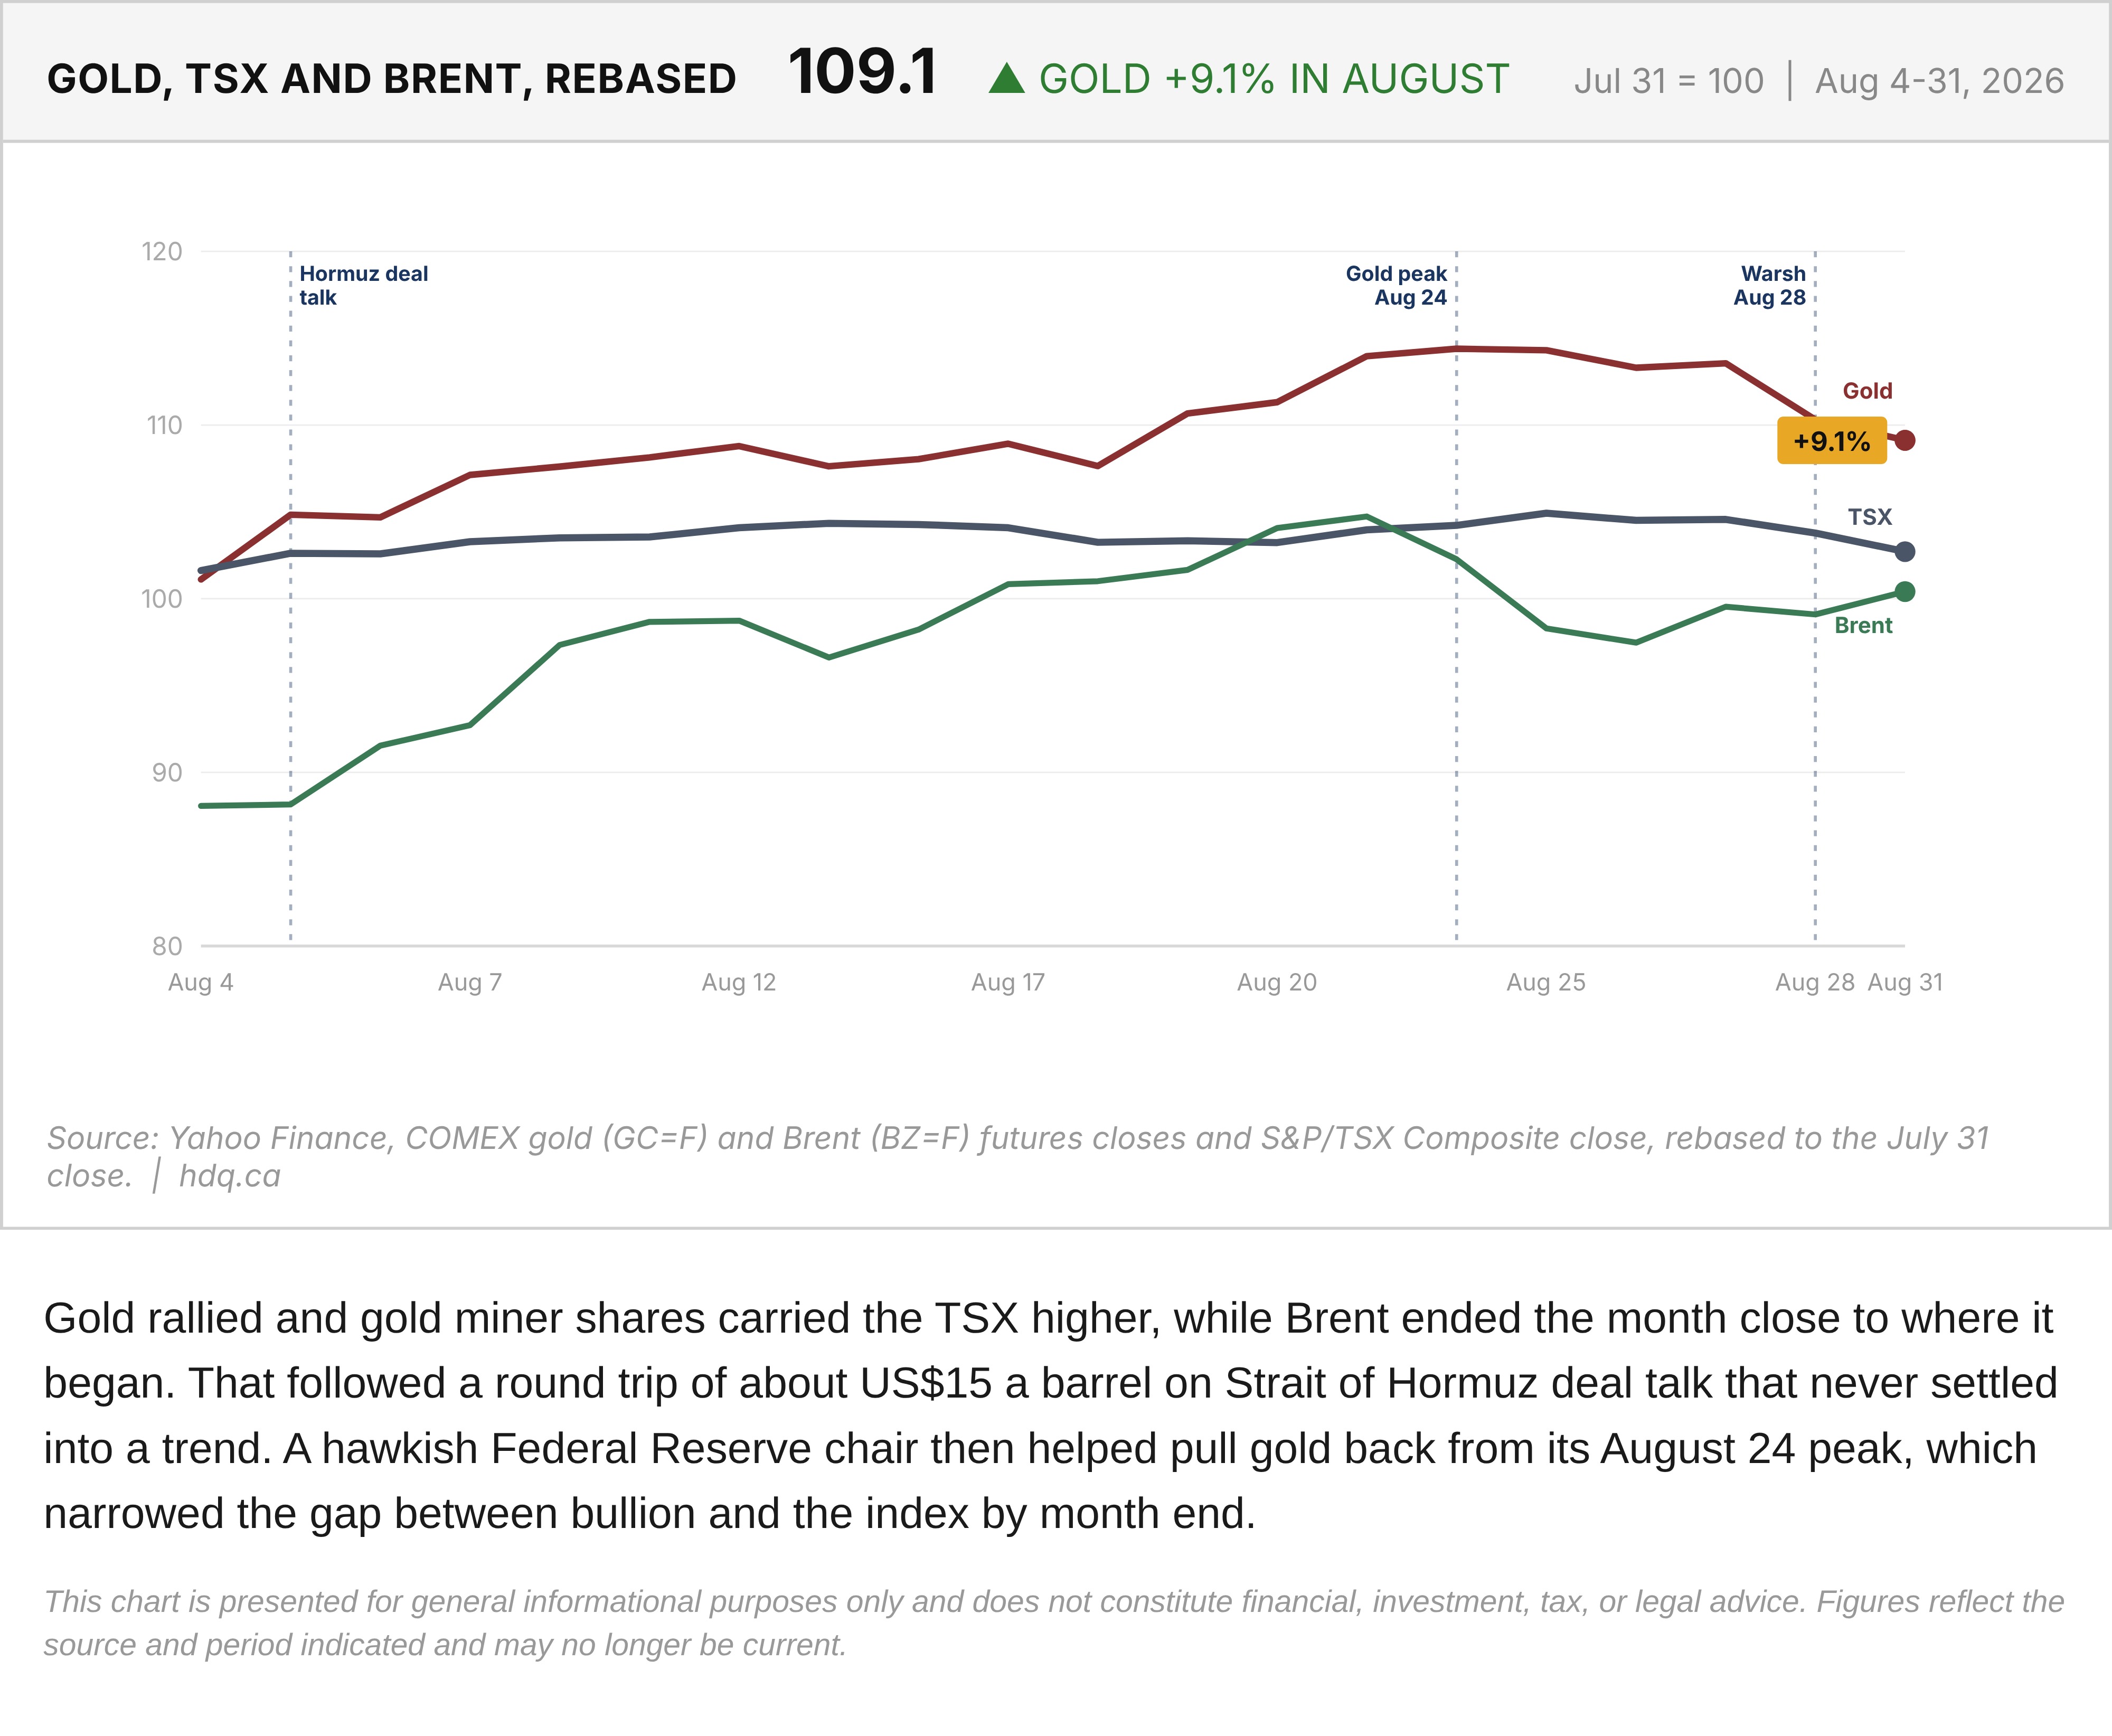
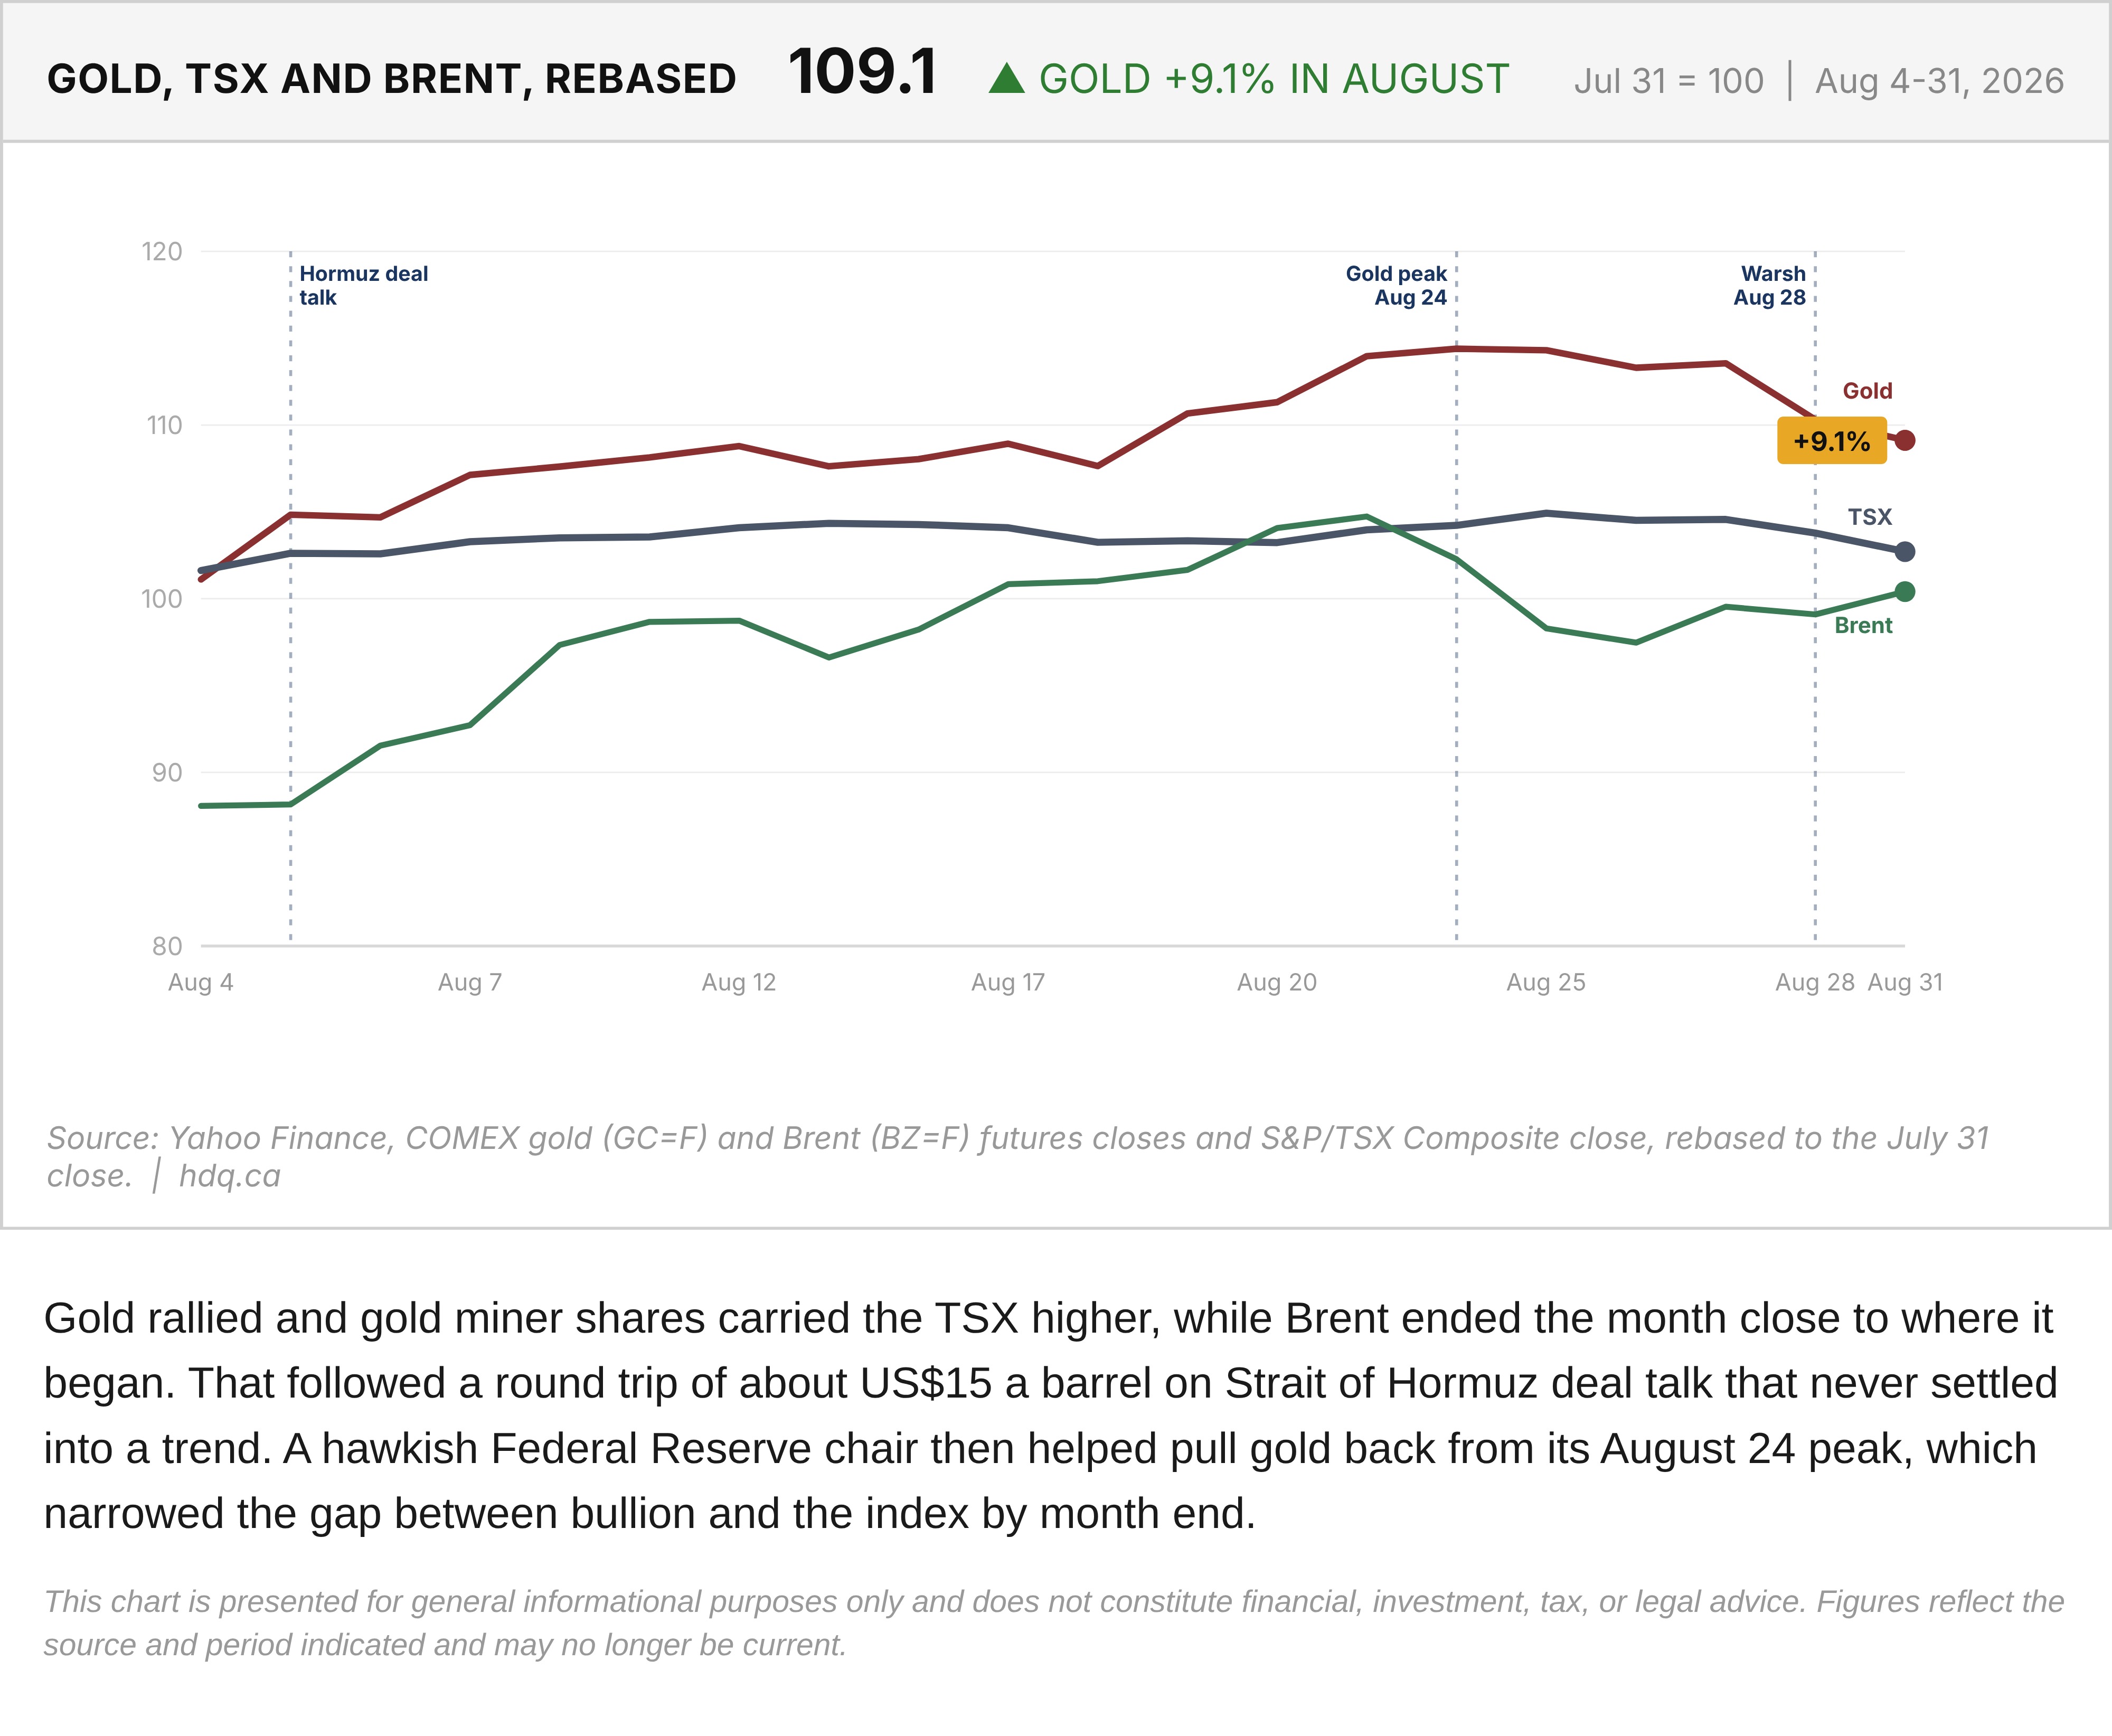
Gold rallied and gold miner shares carried the TSX higher, while Brent ended the month close to where it began. That followed a round trip of about US$15 a barrel on Strait of Hormuz deal talk that never settled into a trend. A hawkish Federal Reserve chair then helped pull gold back from its August 24 peak, which narrowed the gap between bullion and the index by month end.
This chart is presented for general informational purposes only and does not constitute financial, investment, tax, or legal advice. Figures reflect the source and period indicated and may no longer be current.
Related charts
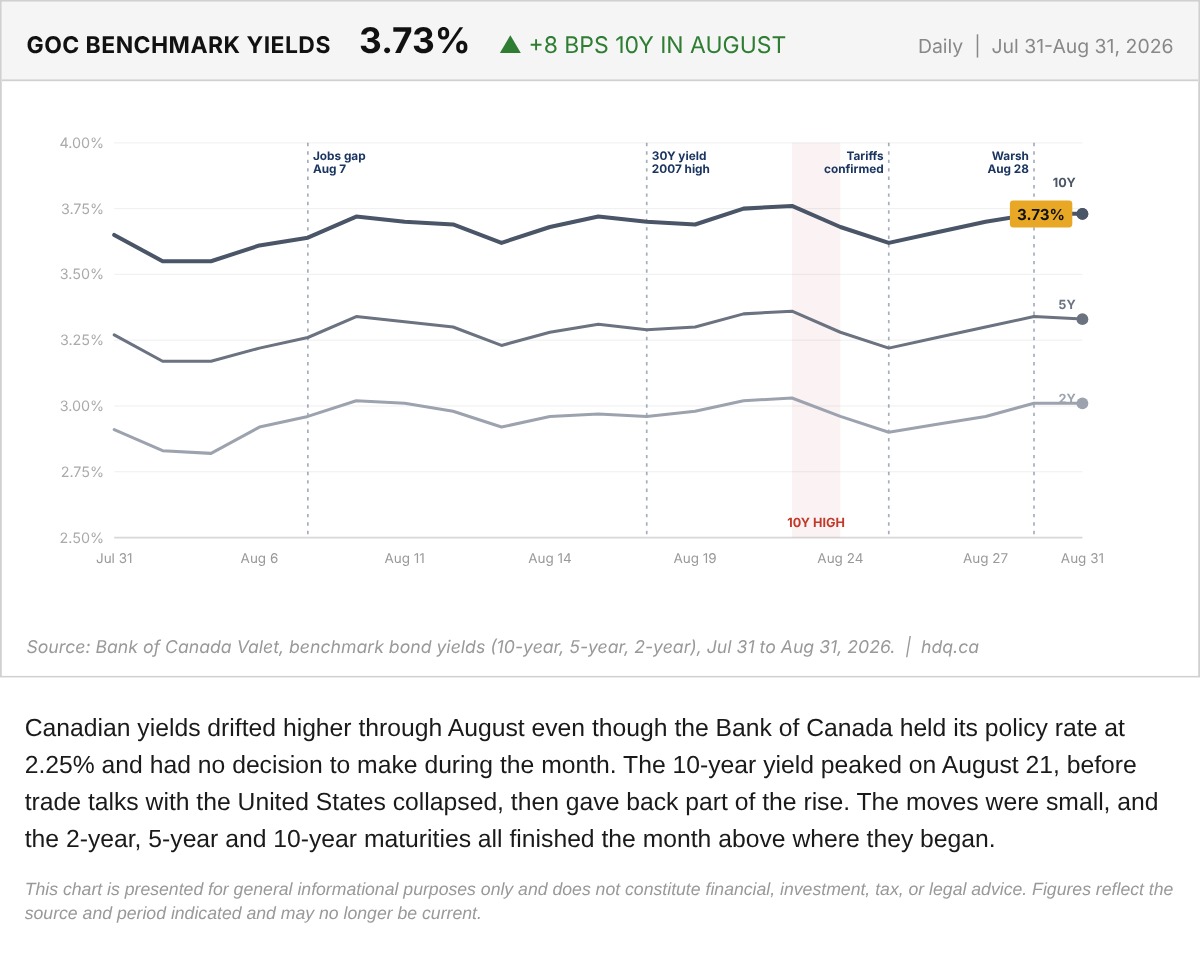
Canadian yields drifted higher through August even though the Bank of Canada held its policy rate at 2.25% and had no decision to make during the month.
Government of Canada Benchmark Yields, August 2026
August 31, 2026
View chart & download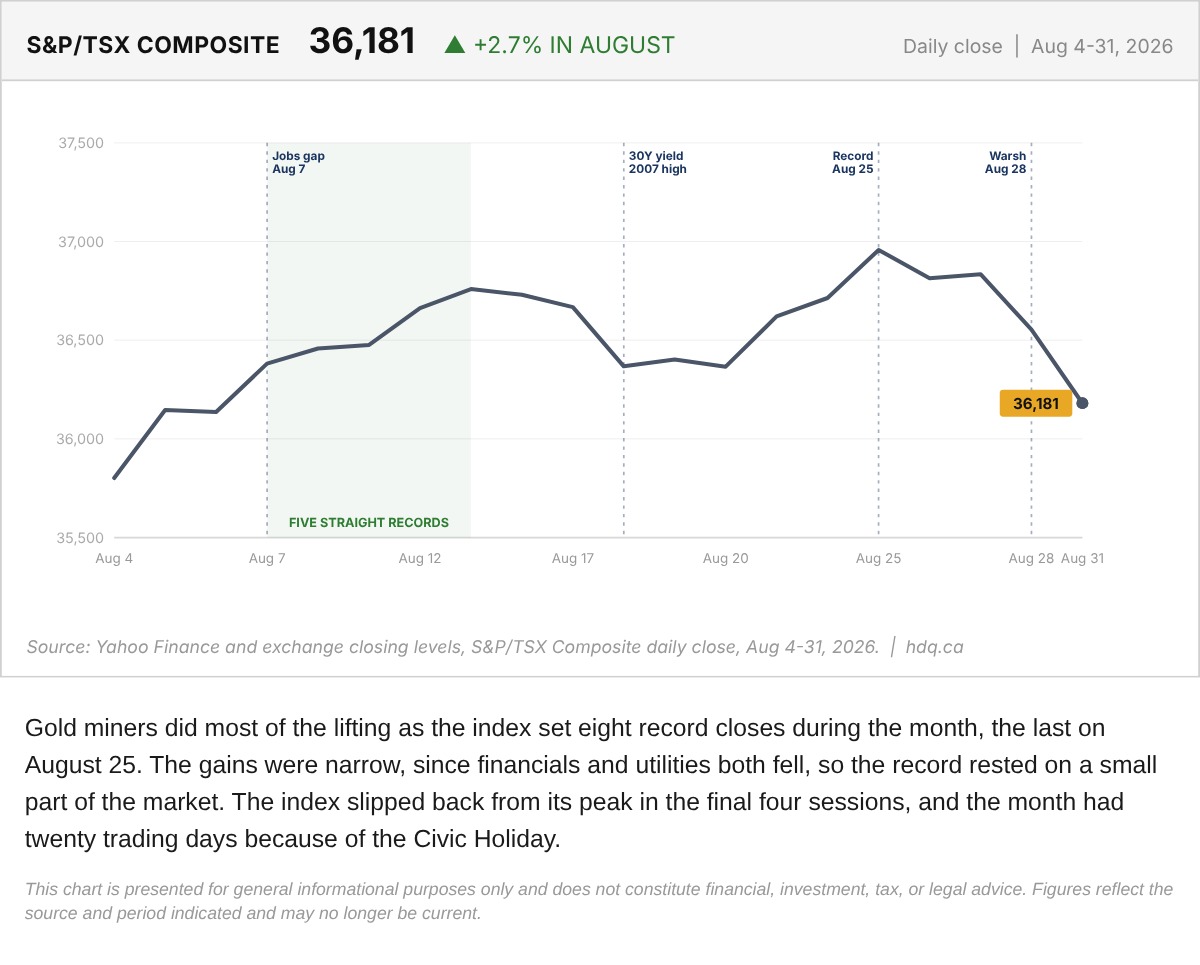
Gold miners did most of the lifting as the index set eight record closes during the month, the last on August 25.
S&P/TSX Composite Daily Close Through August 2026
August 31, 2026
View chart & download
Brent was the only one of the three to finish above its starting level, while the index and gold both fell.
Brent, TSX and Gold Rebased to the August 31 Close
September 30, 2026
View chart & download
The Bank of Canada held its policy rate at 2.25% for a seventh straight time, yet Canadian yields rose as United States yields surged.
Government of Canada Benchmark Yields, September 2026
September 30, 2026
View chart & download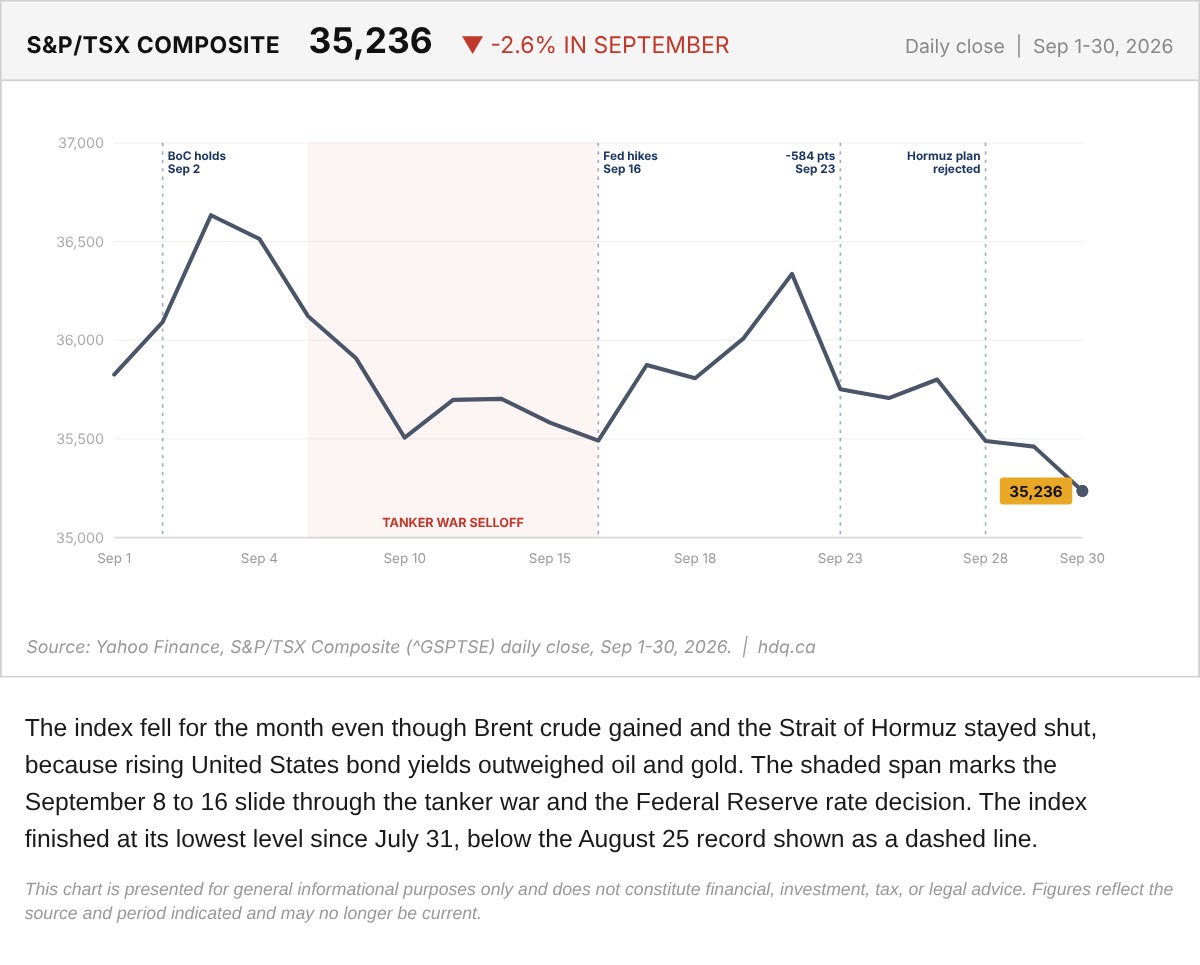
The index fell for the month even though Brent crude gained and the Strait of Hormuz stayed shut, because rising United States bond yields outweighed oil and gold.
S&P/TSX Composite Daily Close Through September 2026
September 30, 2026
View chart & download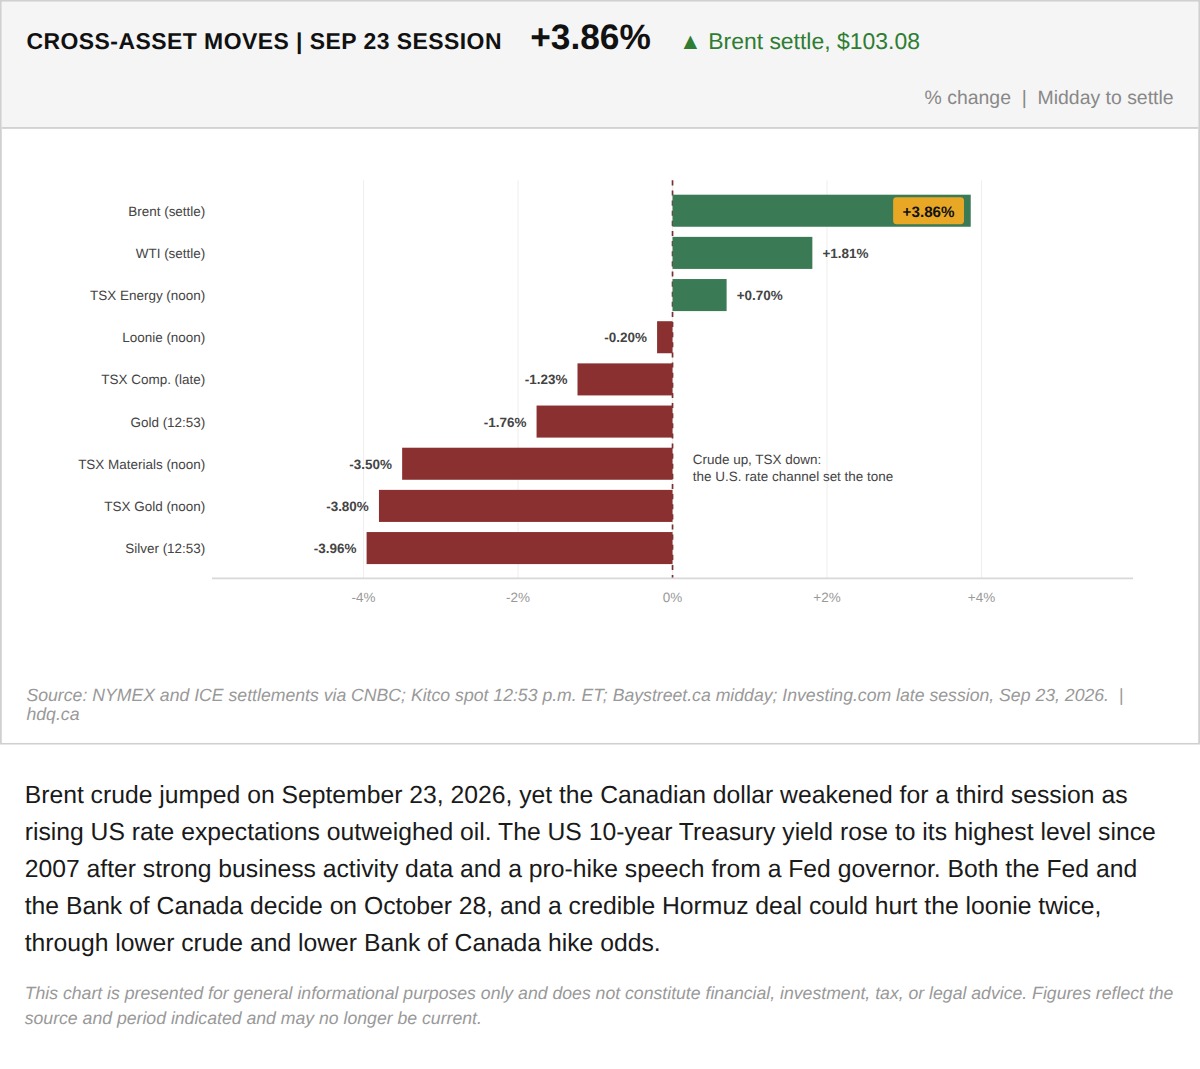
Brent crude jumped on September 23, 2026, yet the Canadian dollar weakened for a third session as rising US rate expectations outweighed oil.
Brent Jumps While the Canadian Dollar and TSX Fall in the September 23 Session
September 23, 2026
View chart & download