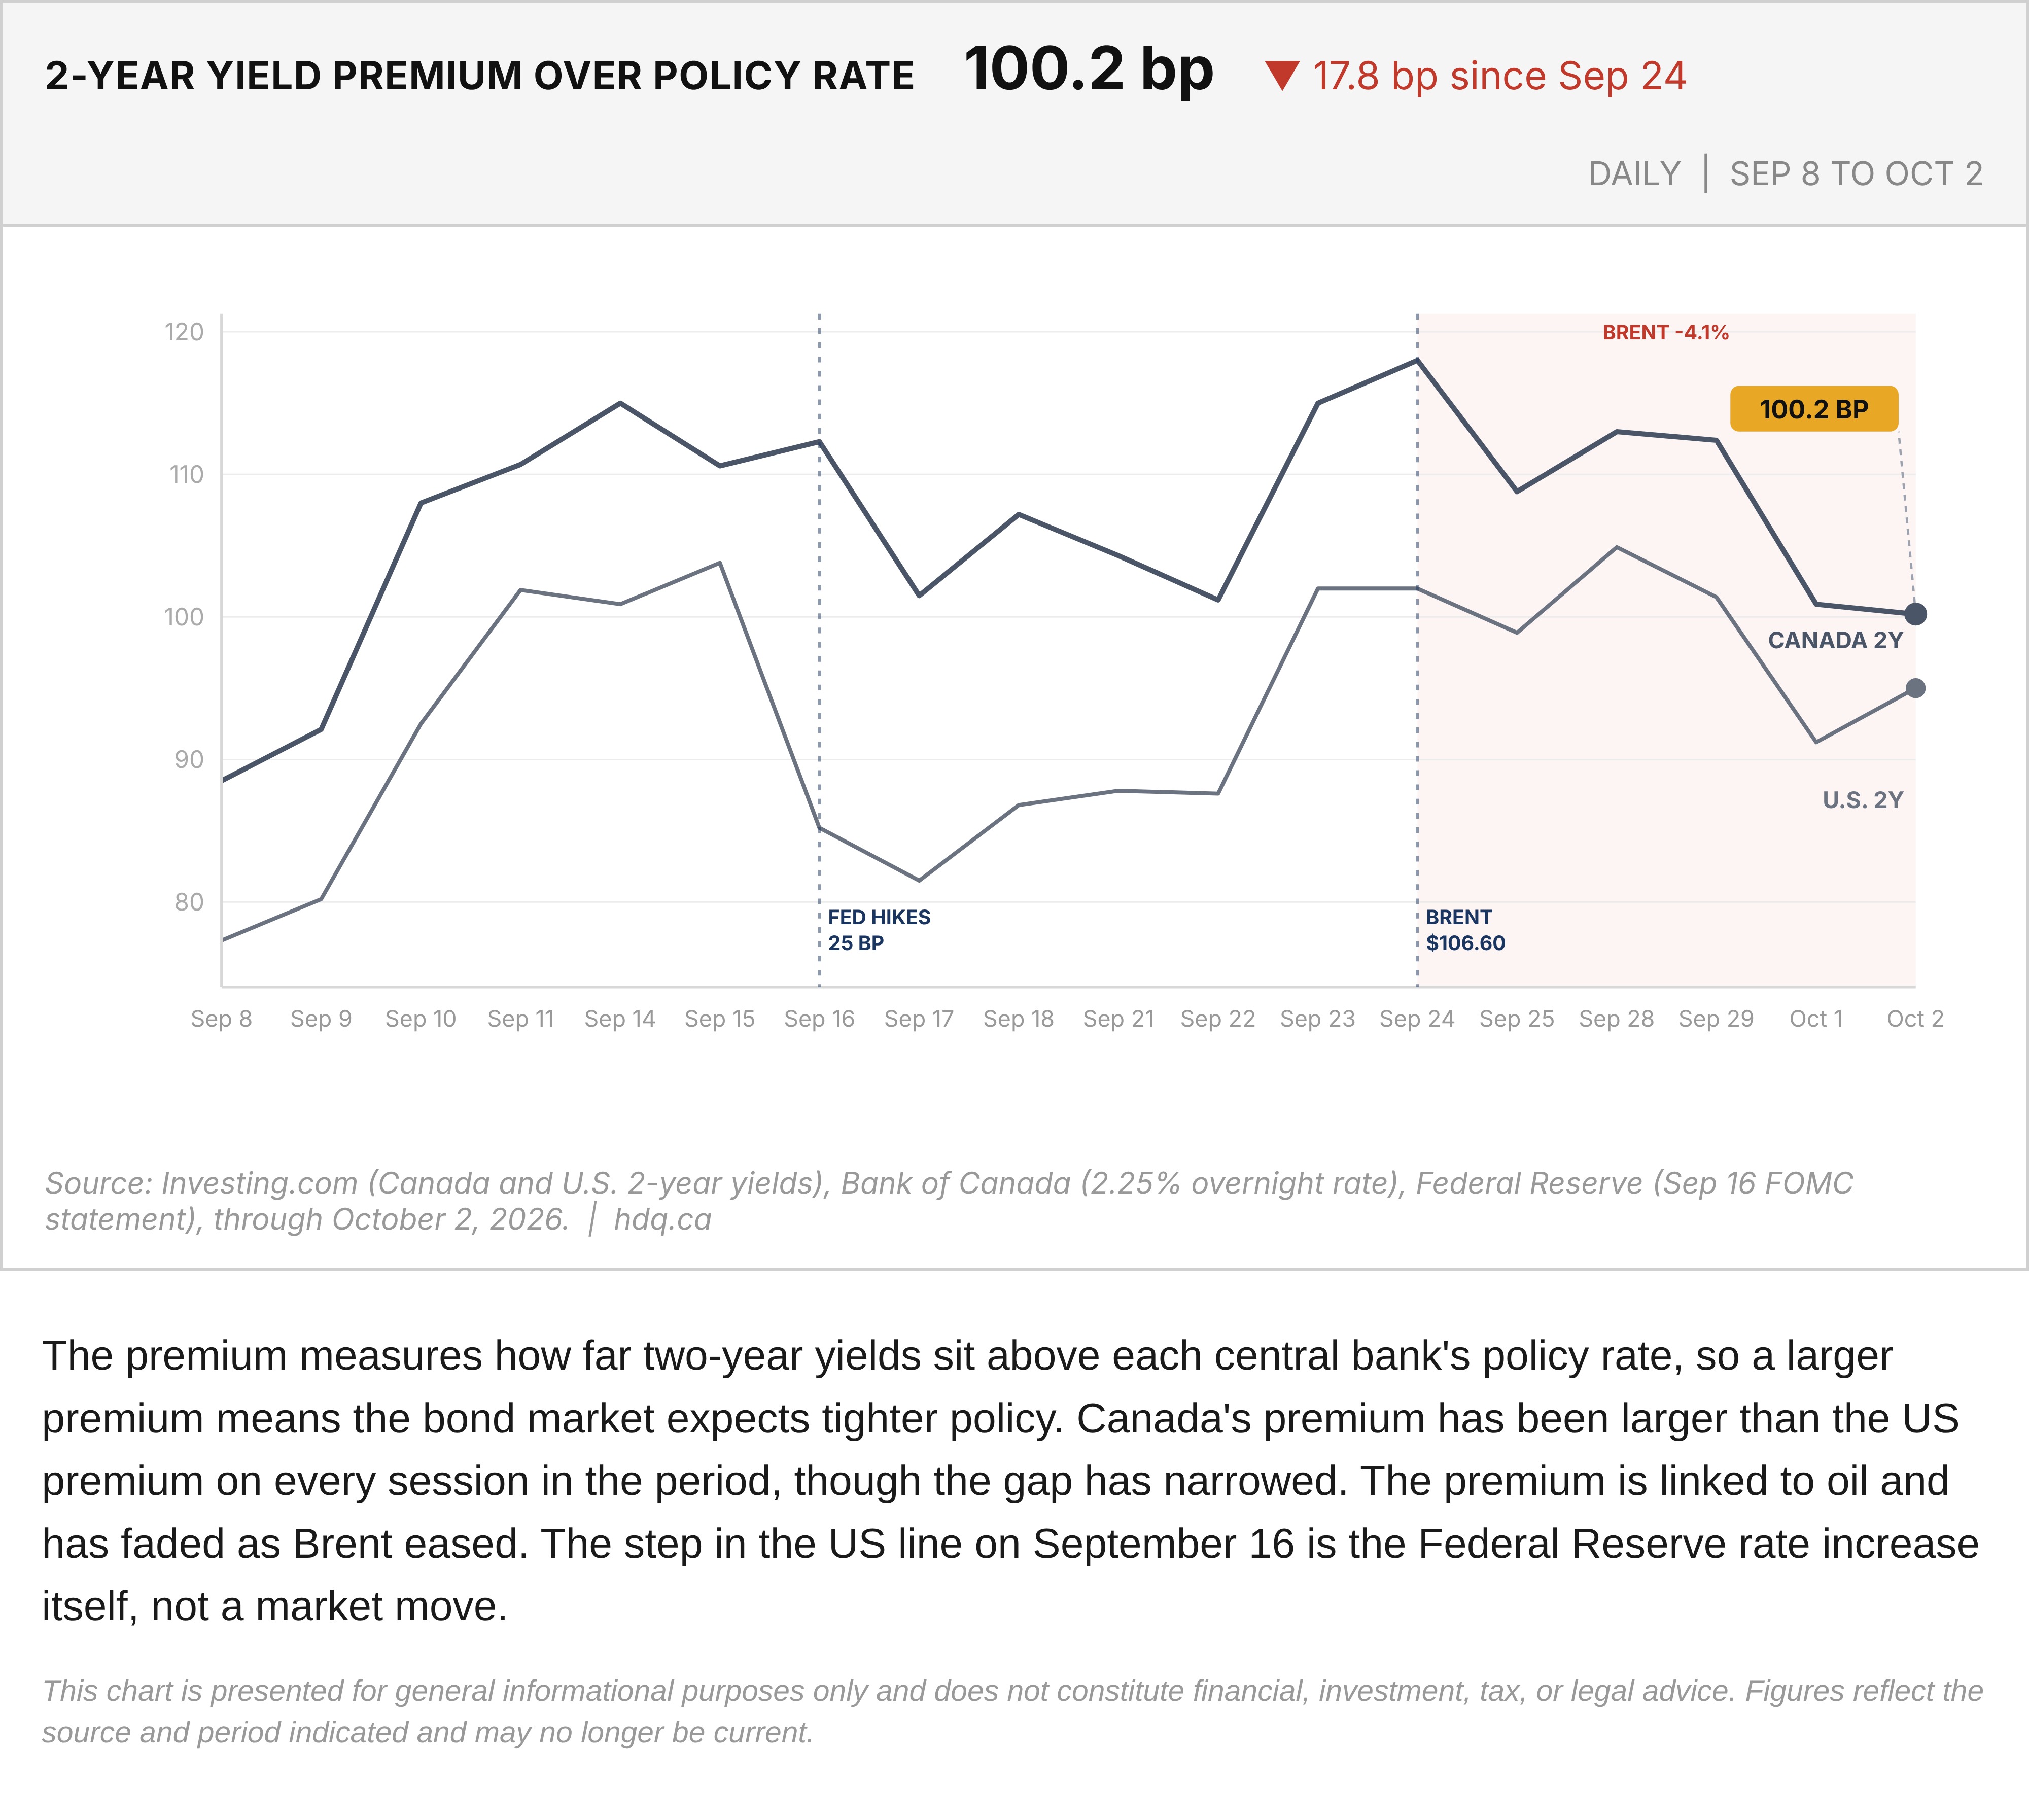
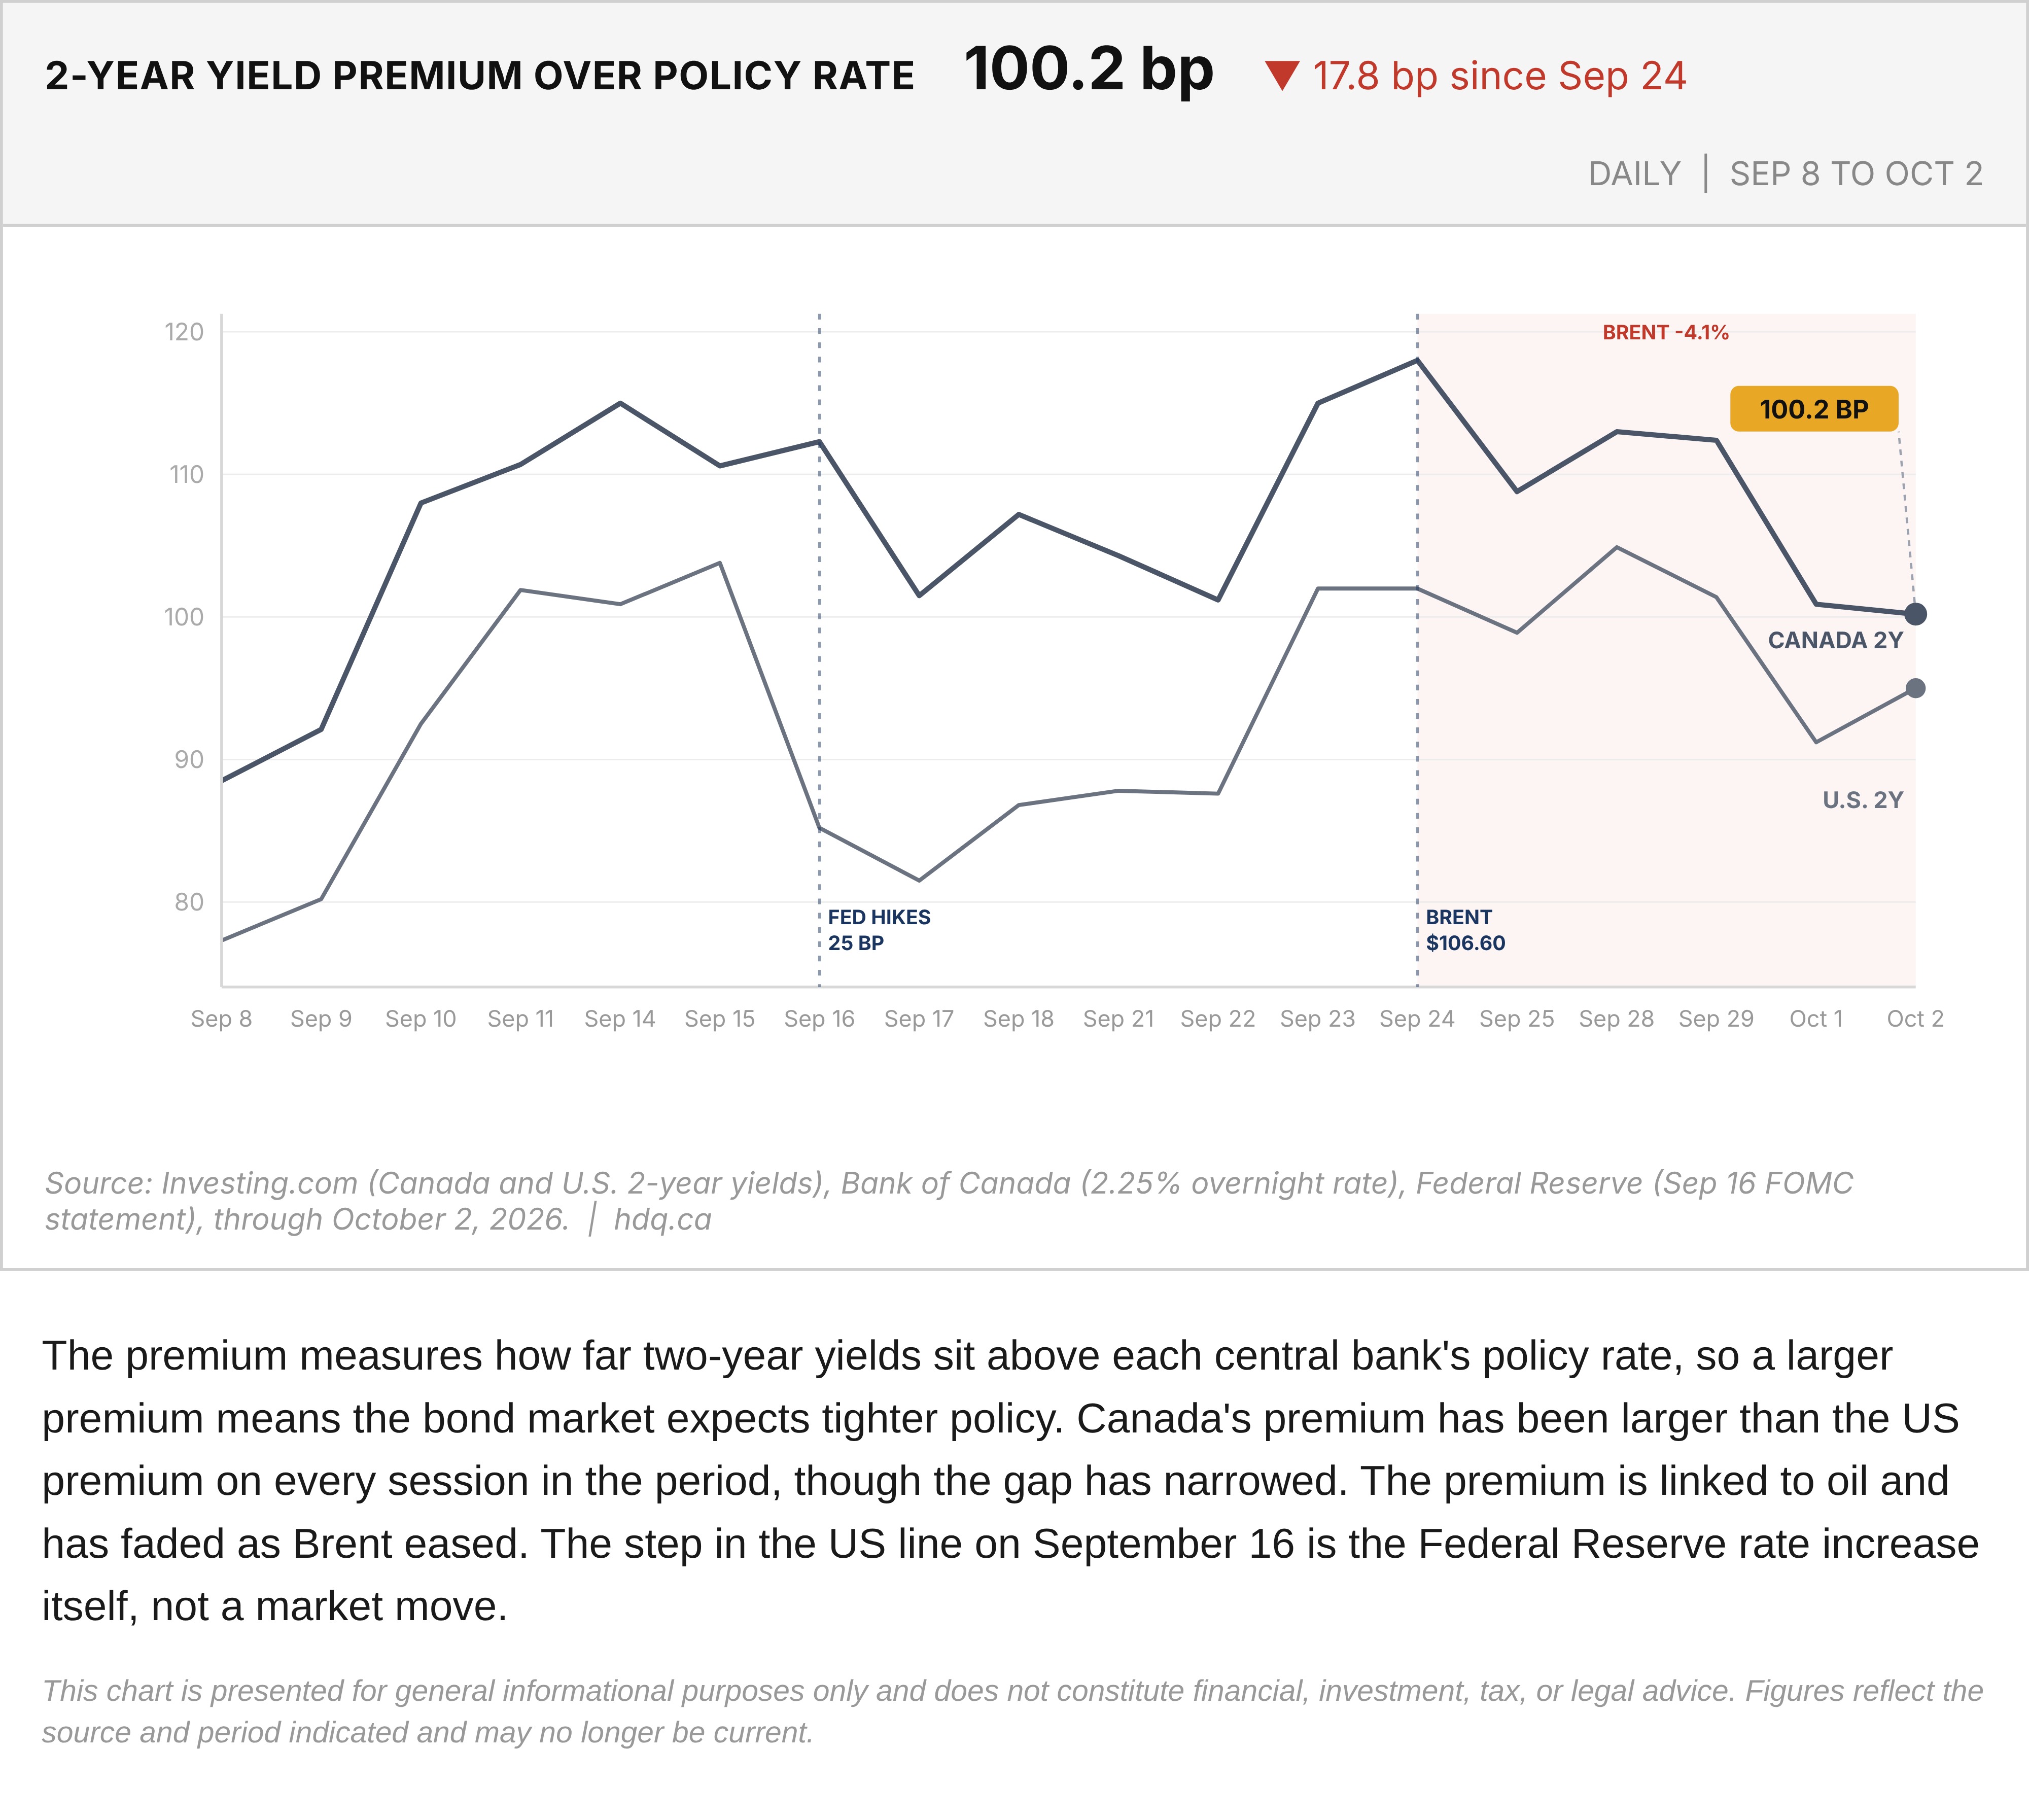
The premium measures how far two-year yields sit above each central bank's policy rate, so a larger premium means the bond market expects tighter policy. Canada's premium has been larger than the US premium on every session in the period, though the gap has narrowed. The premium is linked to oil and has faded as Brent eased. The step in the US line on September 16 is the Federal Reserve rate increase itself, not a market move.
This chart is presented for general informational purposes only and does not constitute financial, investment, tax, or legal advice. Figures reflect the source and period indicated and may no longer be current.
Related charts
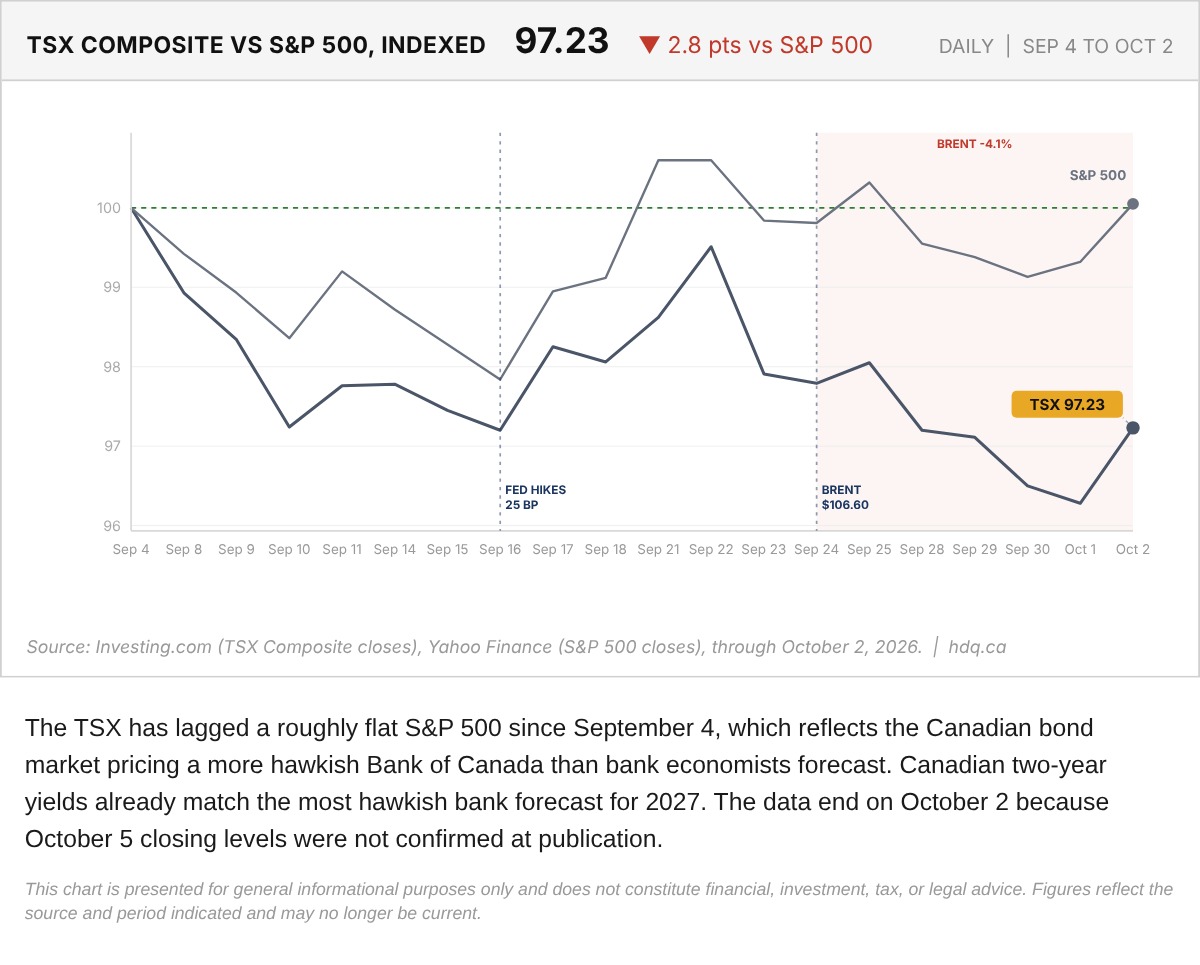
The TSX has lagged a roughly flat S&P 500 since September 4, which reflects the Canadian bond market pricing a more hawkish Bank of Canada than bank economists forecast.
TSX Composite Versus S&P 500, Indexed to September 4, 2026
October 5, 2026
View chart & download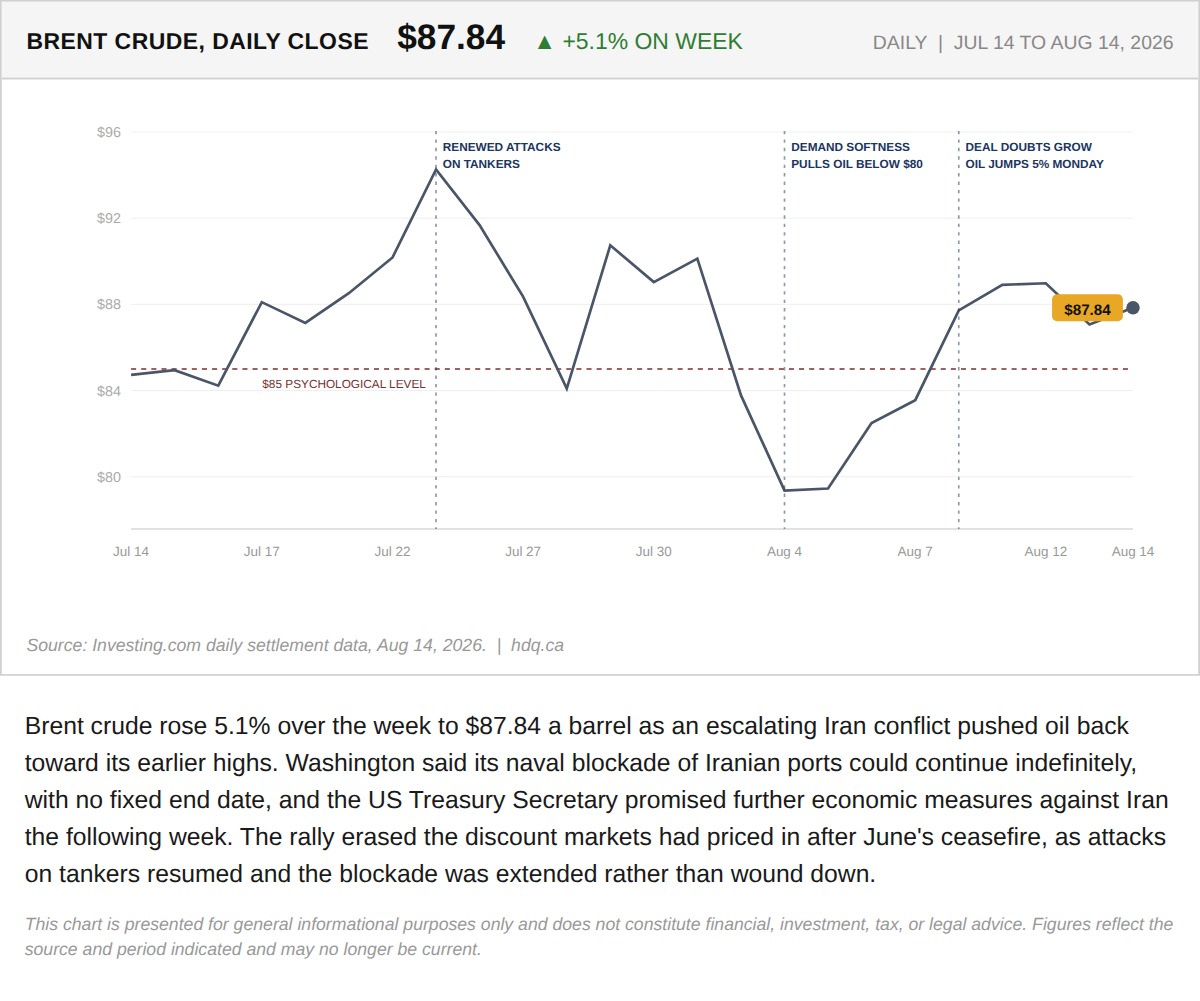
Brent crude rose 5.1% over the week to $87.84 a barrel as an escalating Iran conflict pushed oil back toward its earlier highs.
The TSX and Gold Both Set Records This Week. That Should Not Happen Together.
August 15, 2026
View chart & download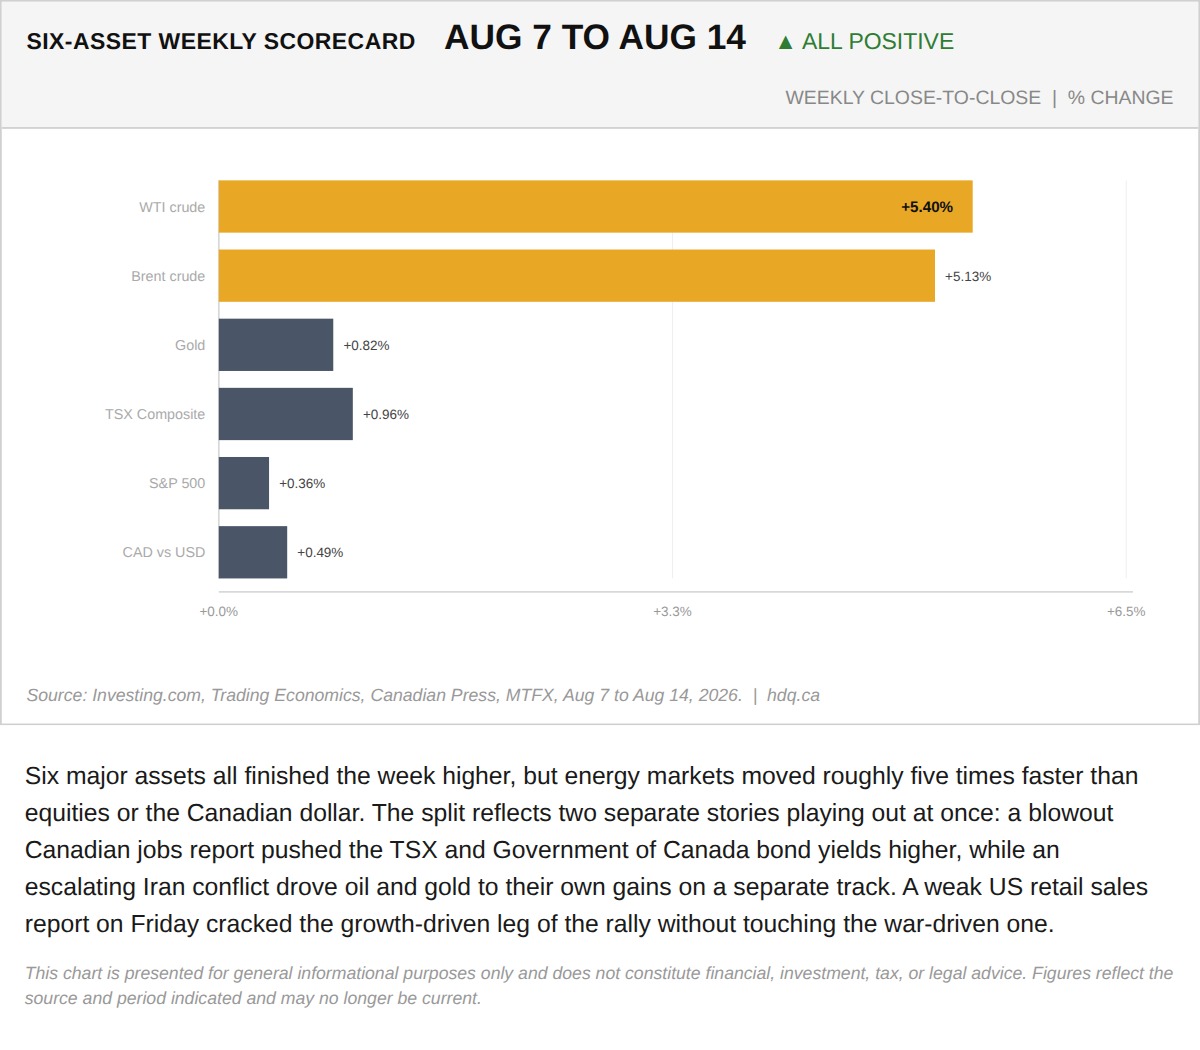
Six major assets all finished the week higher, but energy markets moved roughly five times faster than equities or the Canadian dollar.
The TSX and Gold Both Set Records This Week. That Should Not Happen Together.
August 15, 2026
View chart & download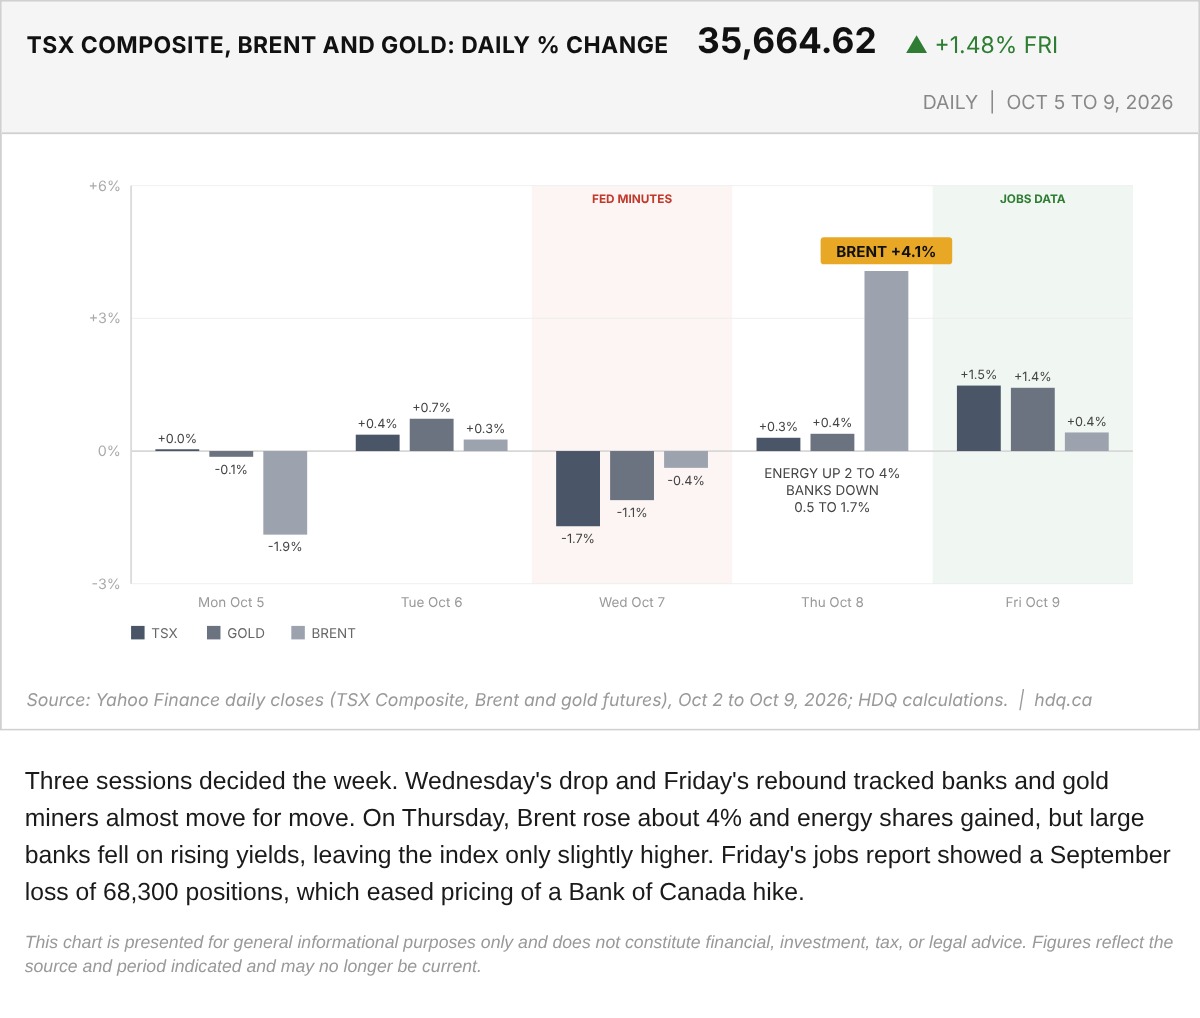
Three sessions decided the week.
TSX, Brent and Gold Daily Percentage Changes, October 5 to 9
October 10, 2026
View chart & download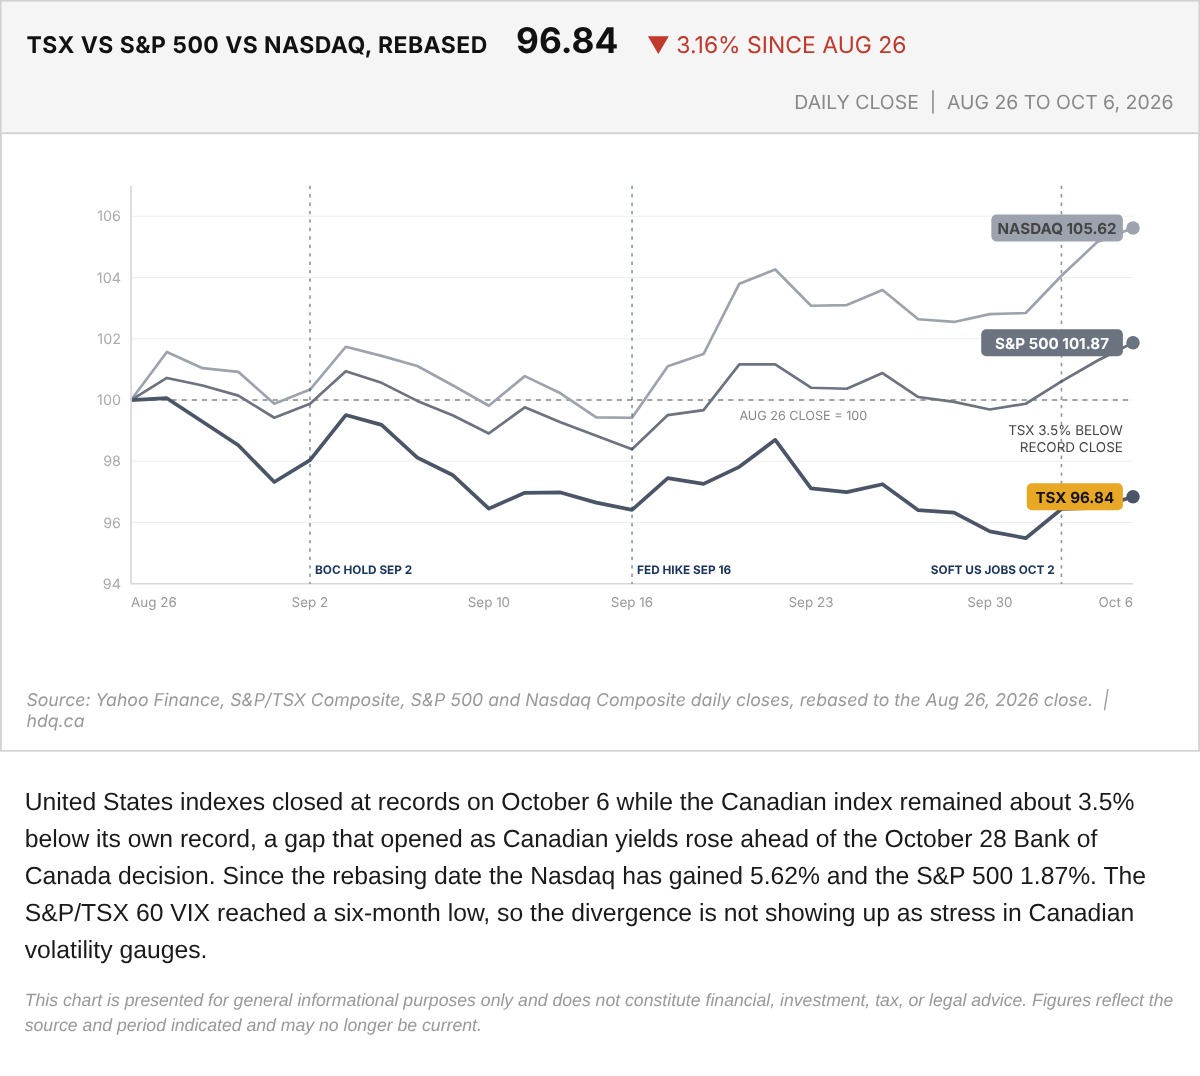
United States indexes closed at records on October 6 while the Canadian index remained about 3.5% below its own record, a gap that opened…
TSX, S&P 500 and Nasdaq Rebased to the August 26 Close
October 7, 2026
View chart & download
Brent was the only one of the three to finish above its starting level, while the index and gold both fell.
Brent, TSX and Gold Rebased to the August 31 Close
September 30, 2026
View chart & download