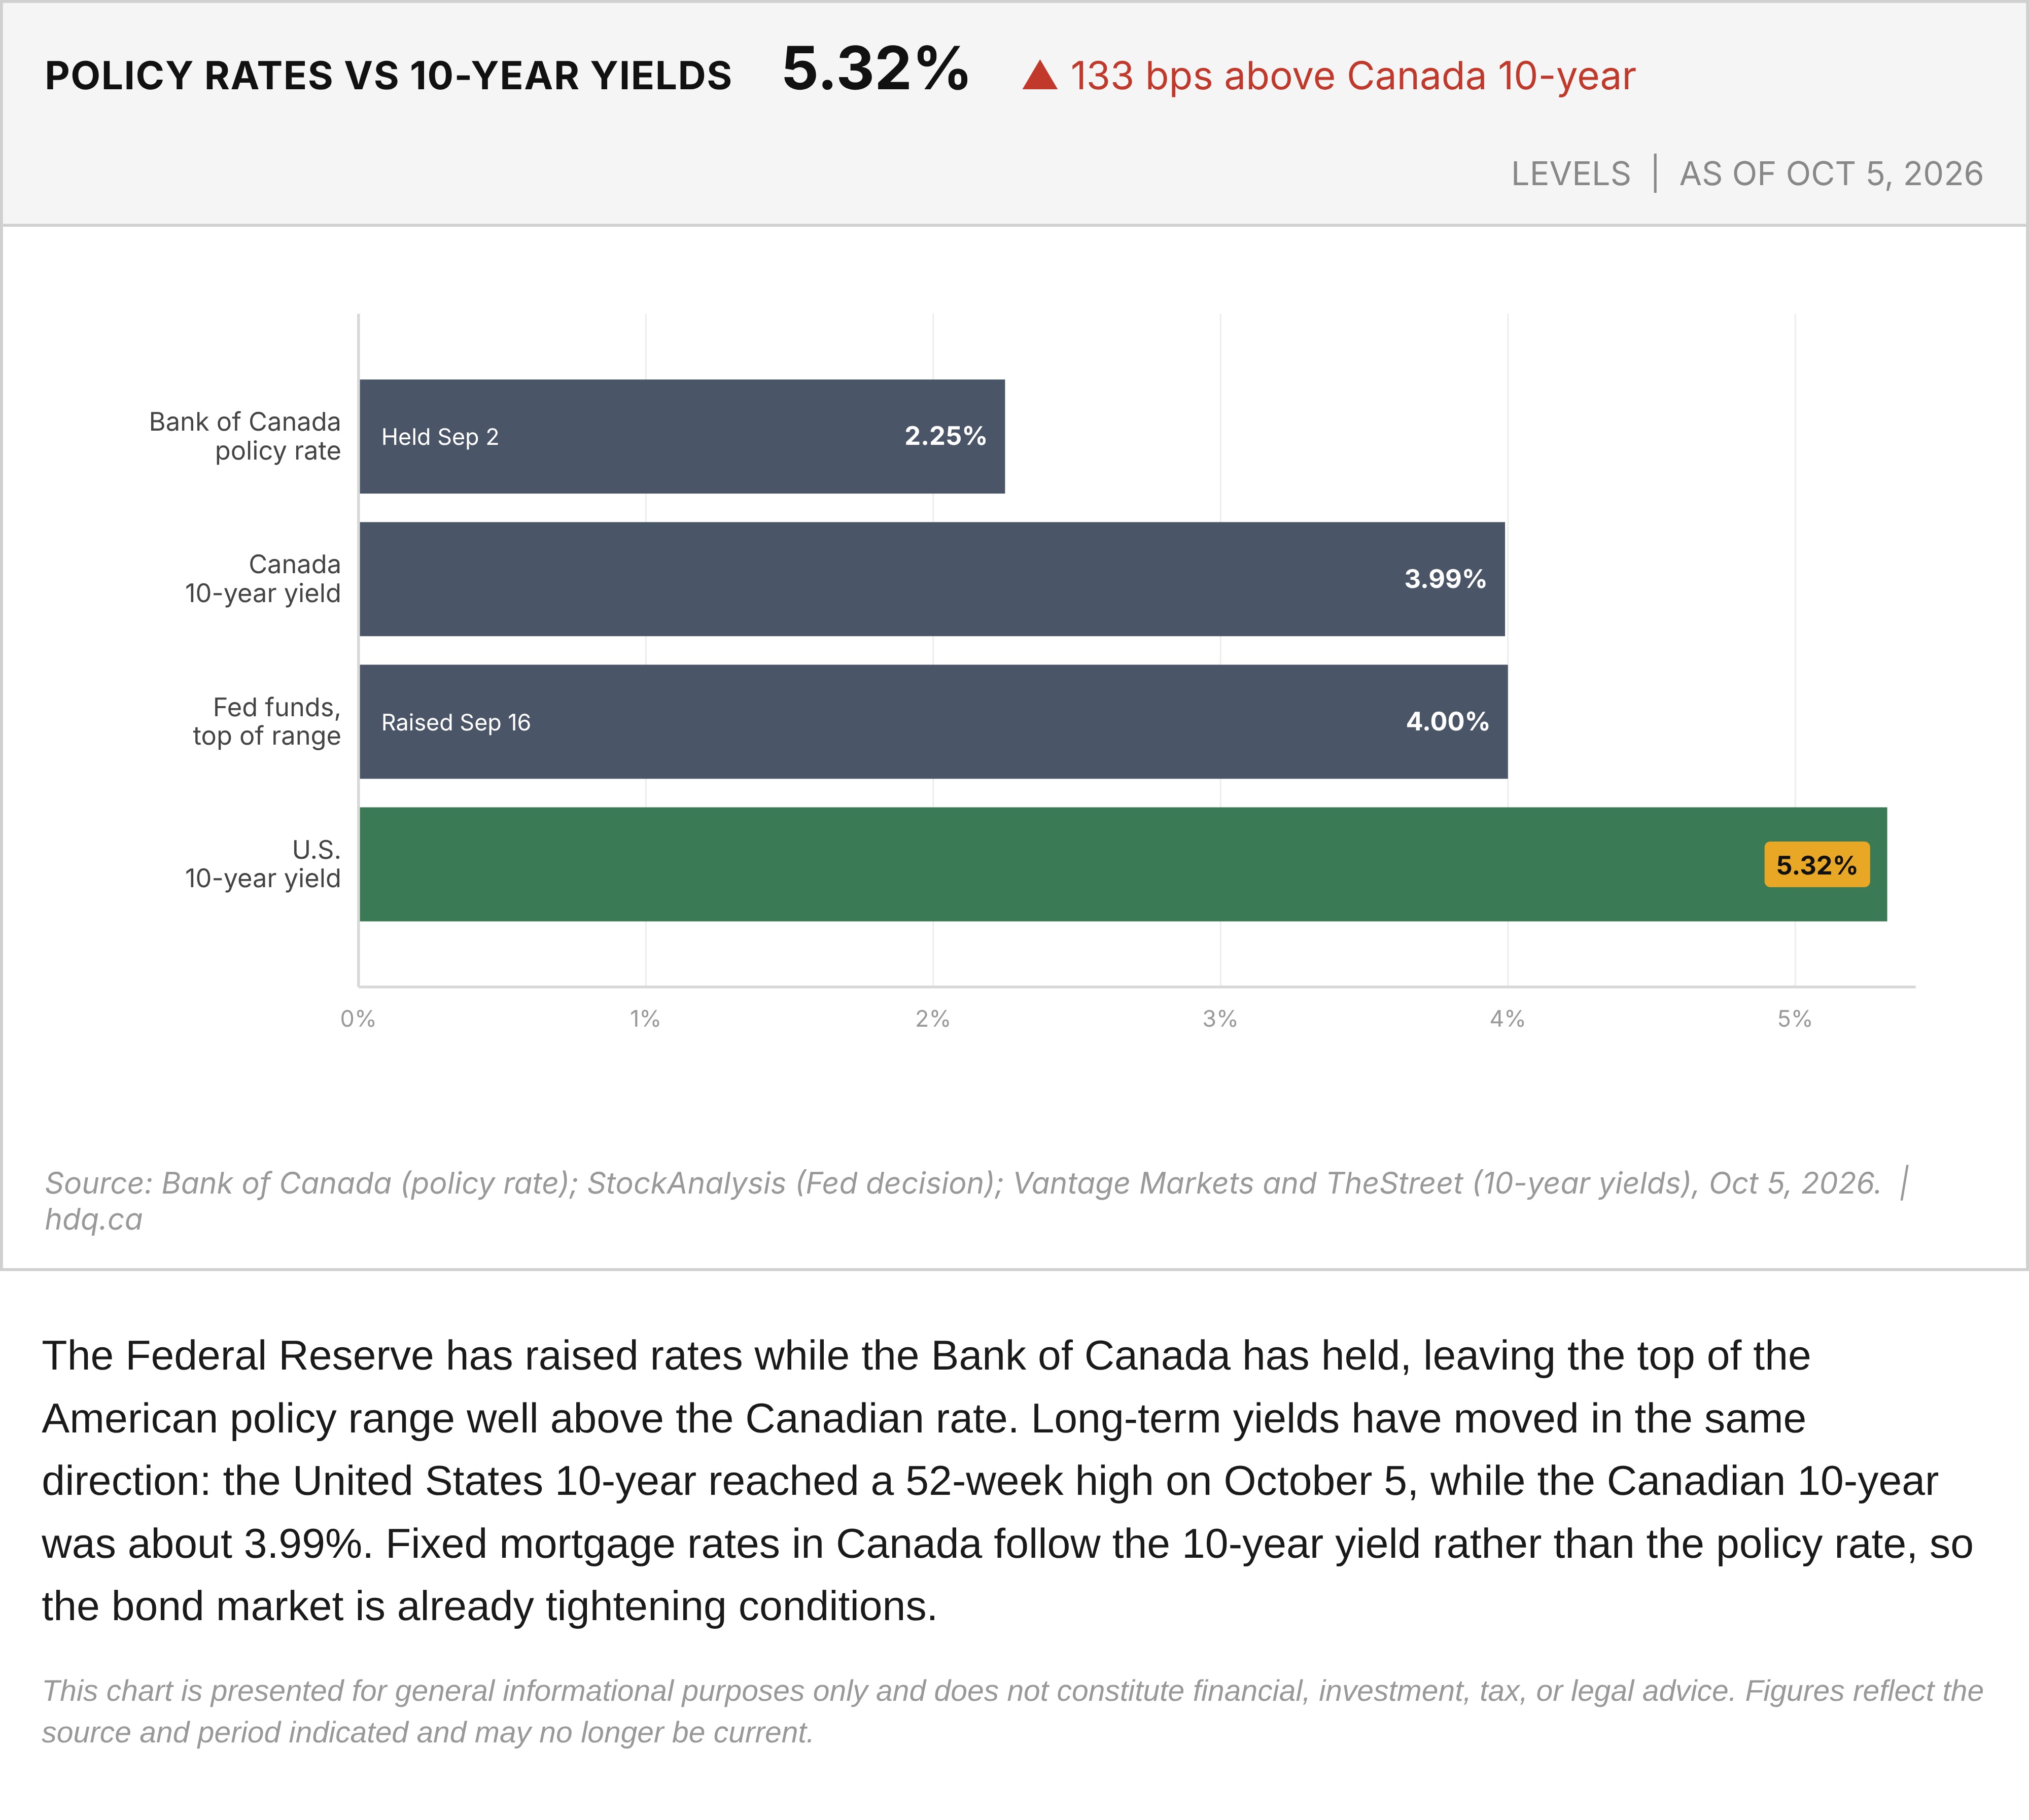
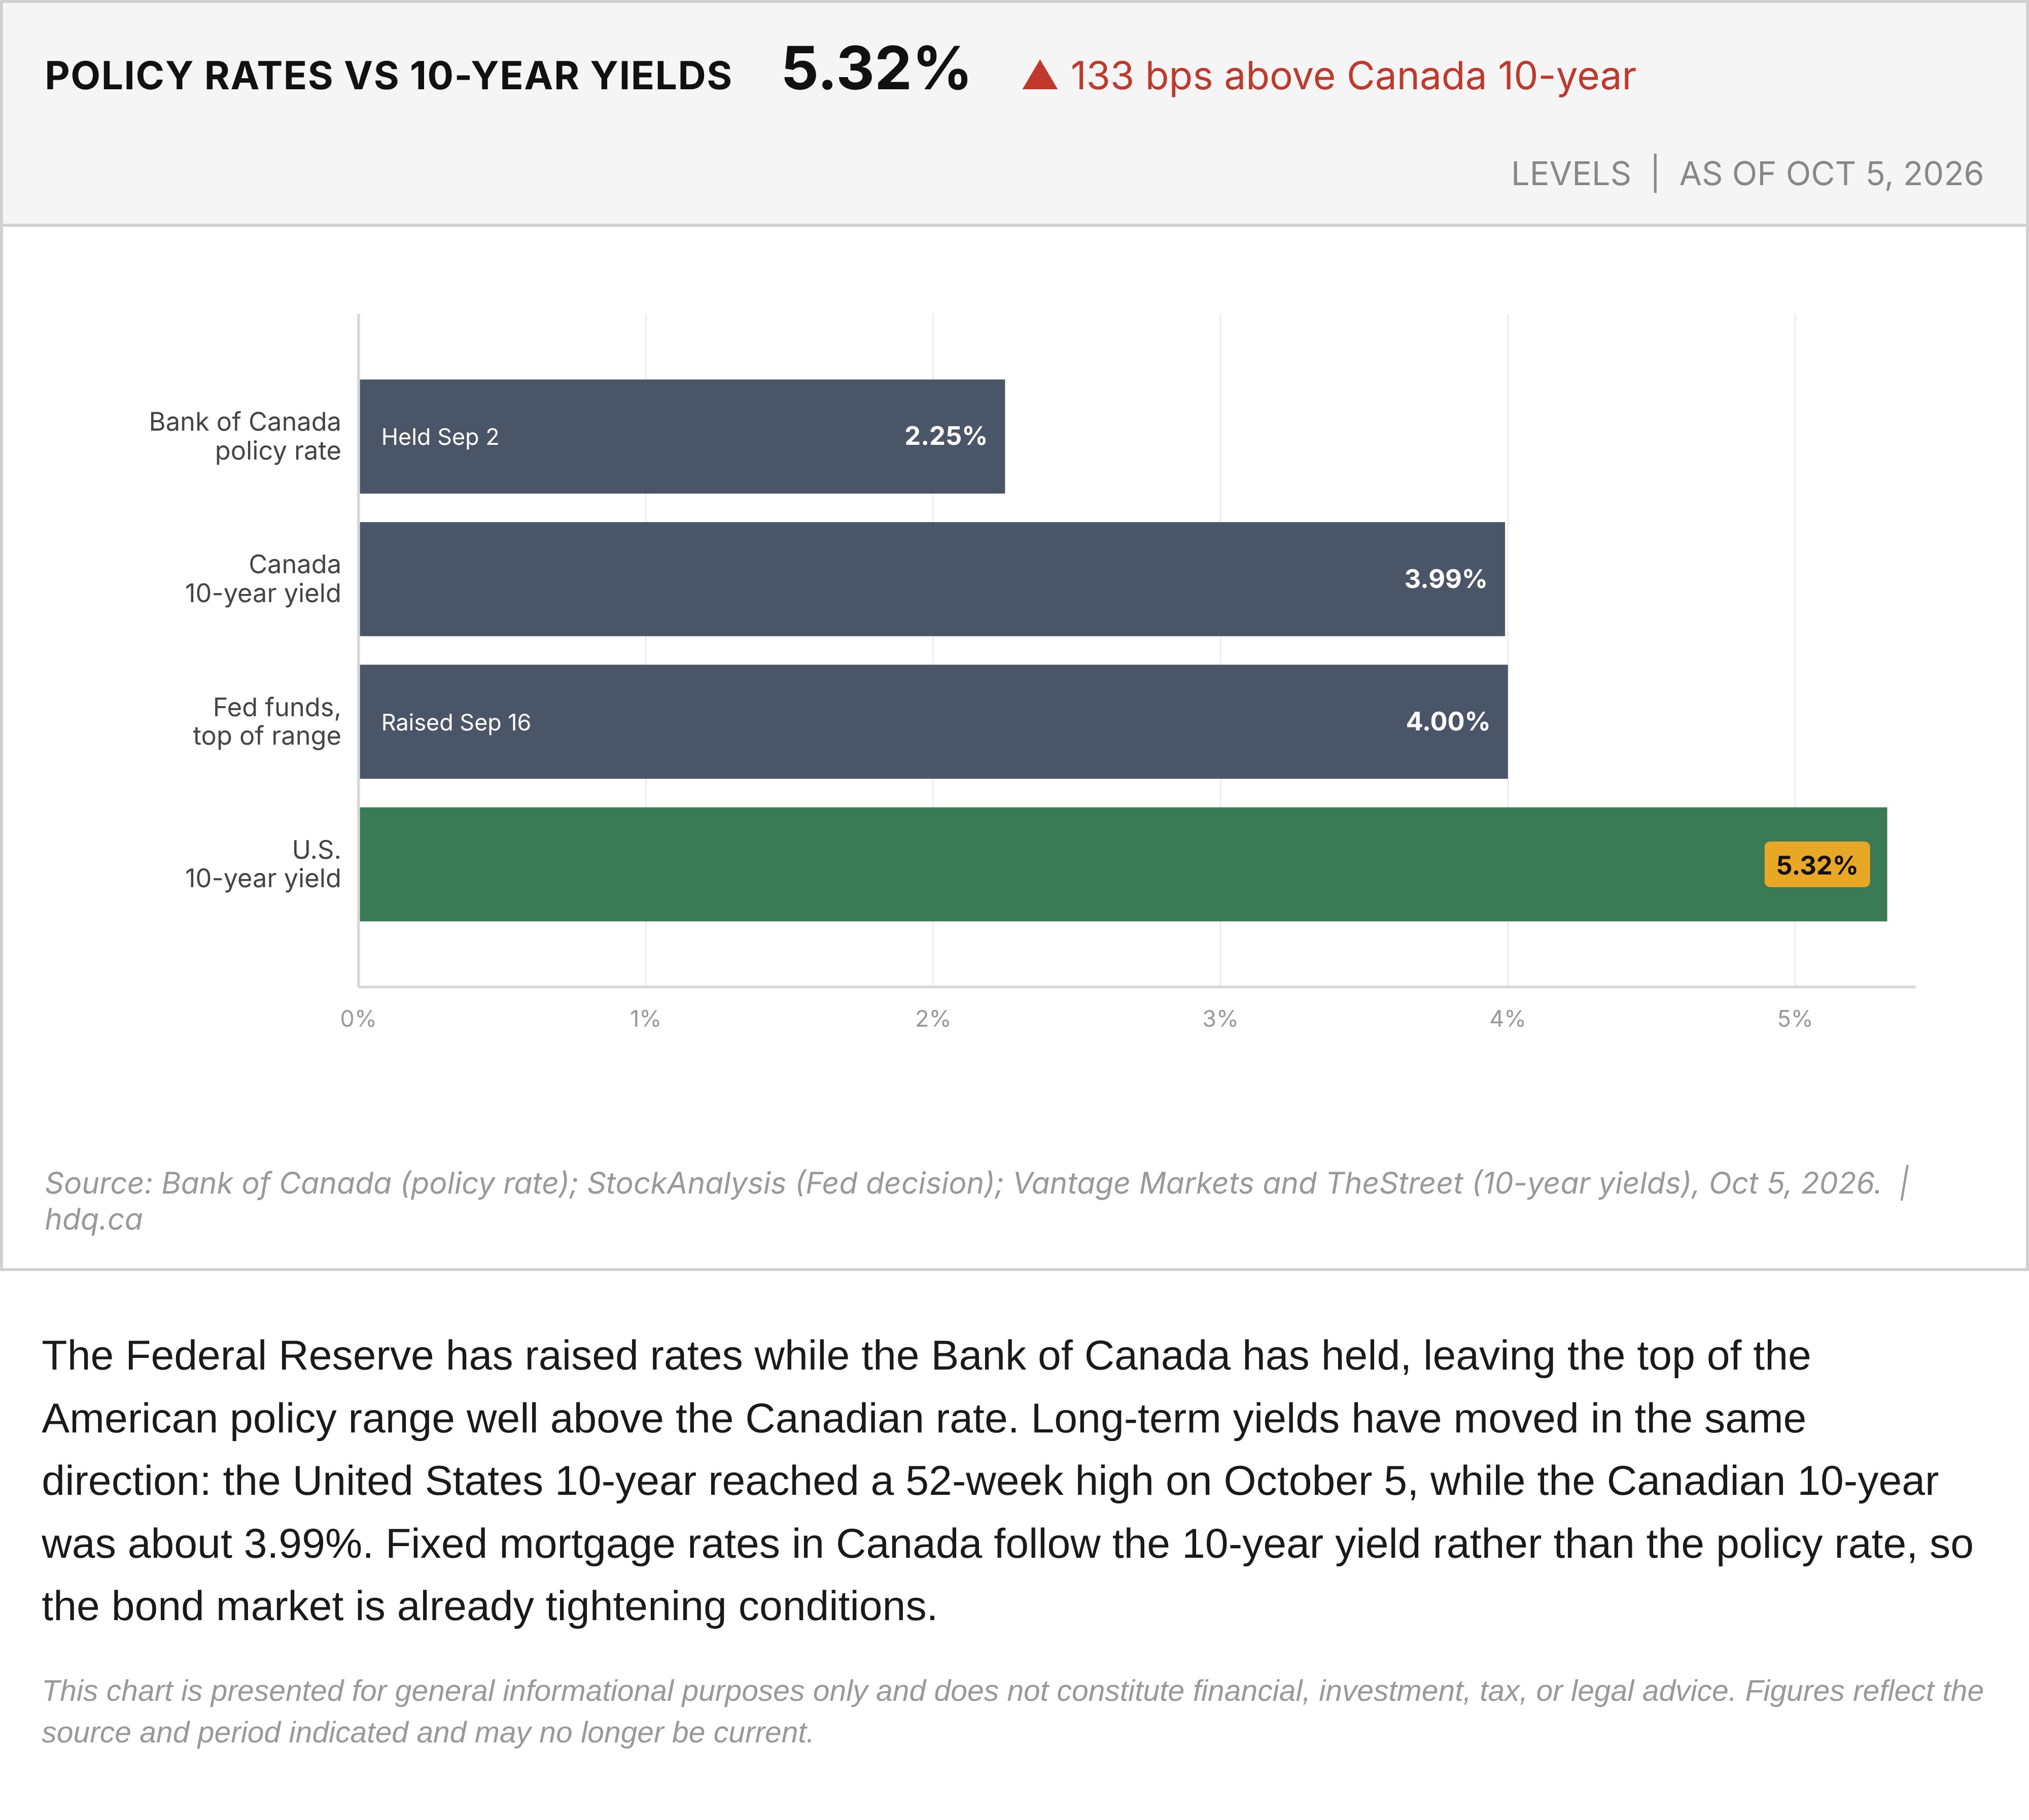
The Federal Reserve has raised rates while the Bank of Canada has held, leaving the top of the American policy range well above the Canadian rate. Long-term yields have moved in the same direction: the United States 10-year reached a 52-week high on October 5, while the Canadian 10-year was about 3.99%. Fixed mortgage rates in Canada follow the 10-year yield rather than the policy rate, so the bond market is already tightening conditions.
This chart is presented for general informational purposes only and does not constitute financial, investment, tax, or legal advice. Figures reflect the source and period indicated and may no longer be current.
Related charts
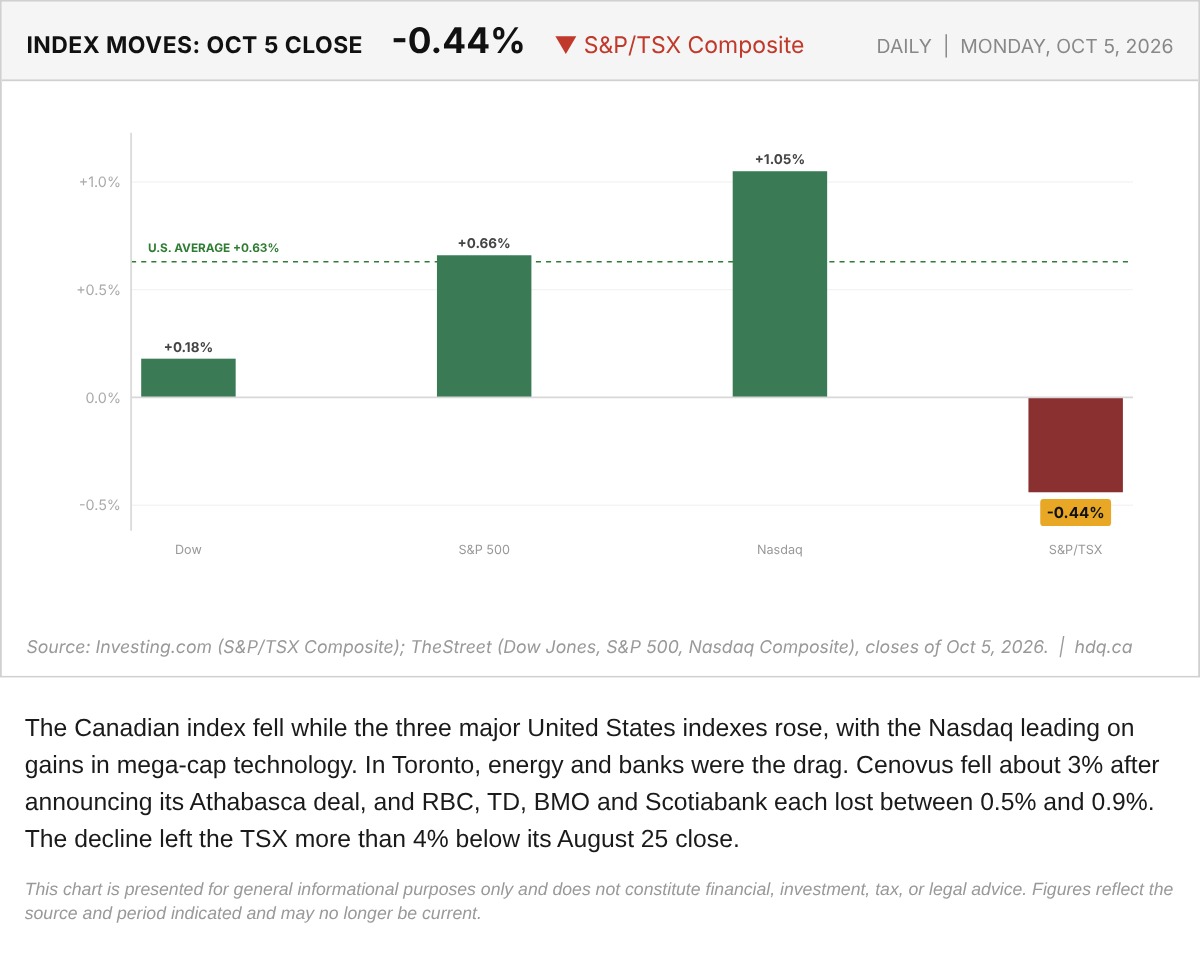
The Canadian index fell while the three major United States indexes rose, with the Nasdaq leading on gains in mega-cap technology.
North American Index Moves on October 5, 2026
October 6, 2026
View chart & download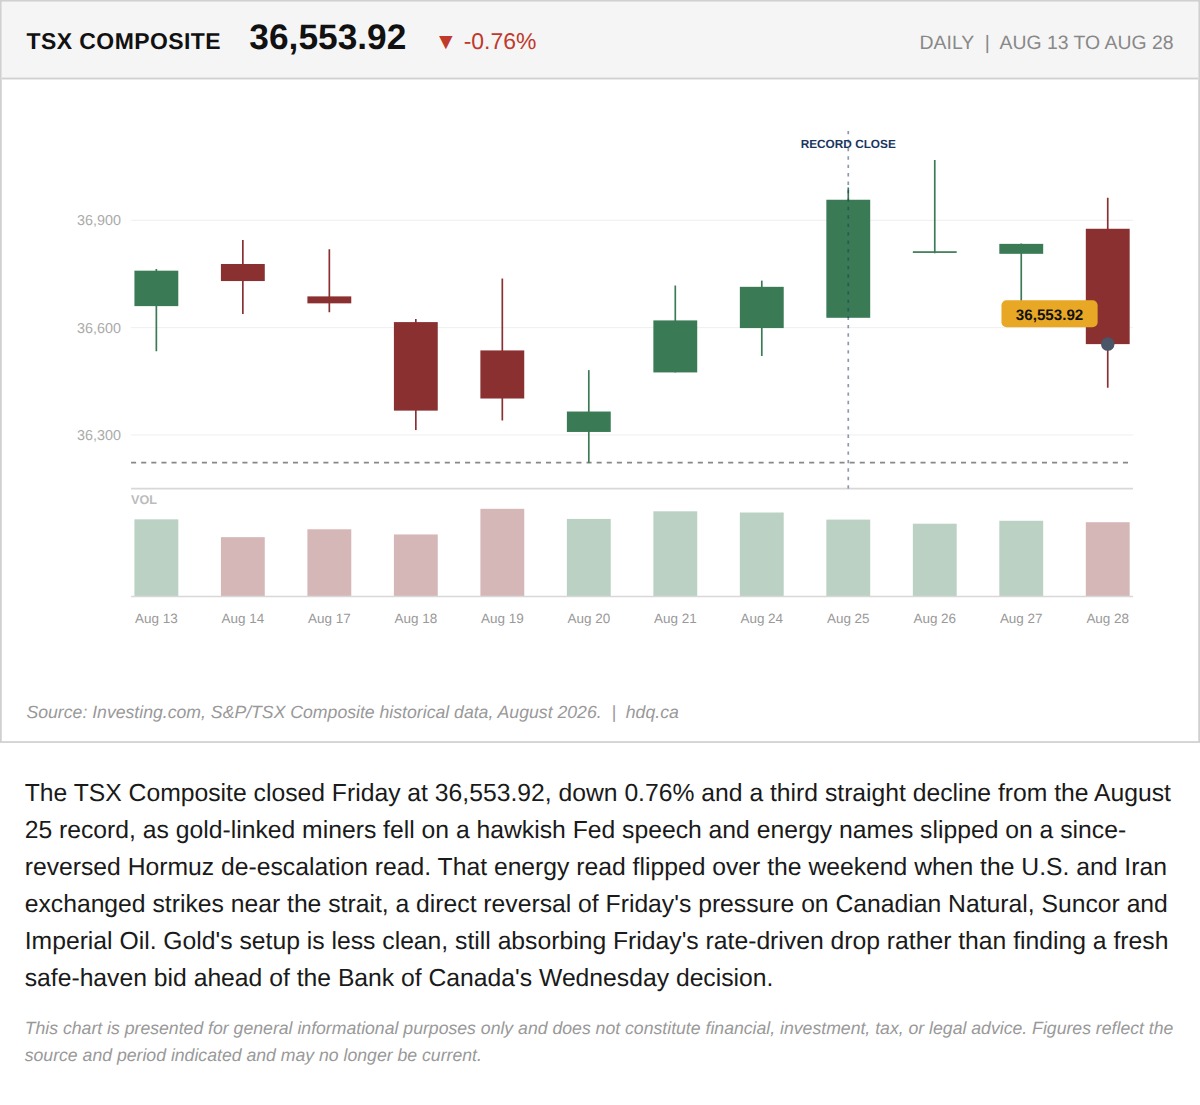
The TSX Composite closed Friday at 36,553.92, down 0.76% and a third straight decline from the August 25 record, as gold-linked miners fell…
The TSX Set a Record Close Six Sessions Ago. It Has Given Back 400 Points Since
August 31, 2026
View chart & download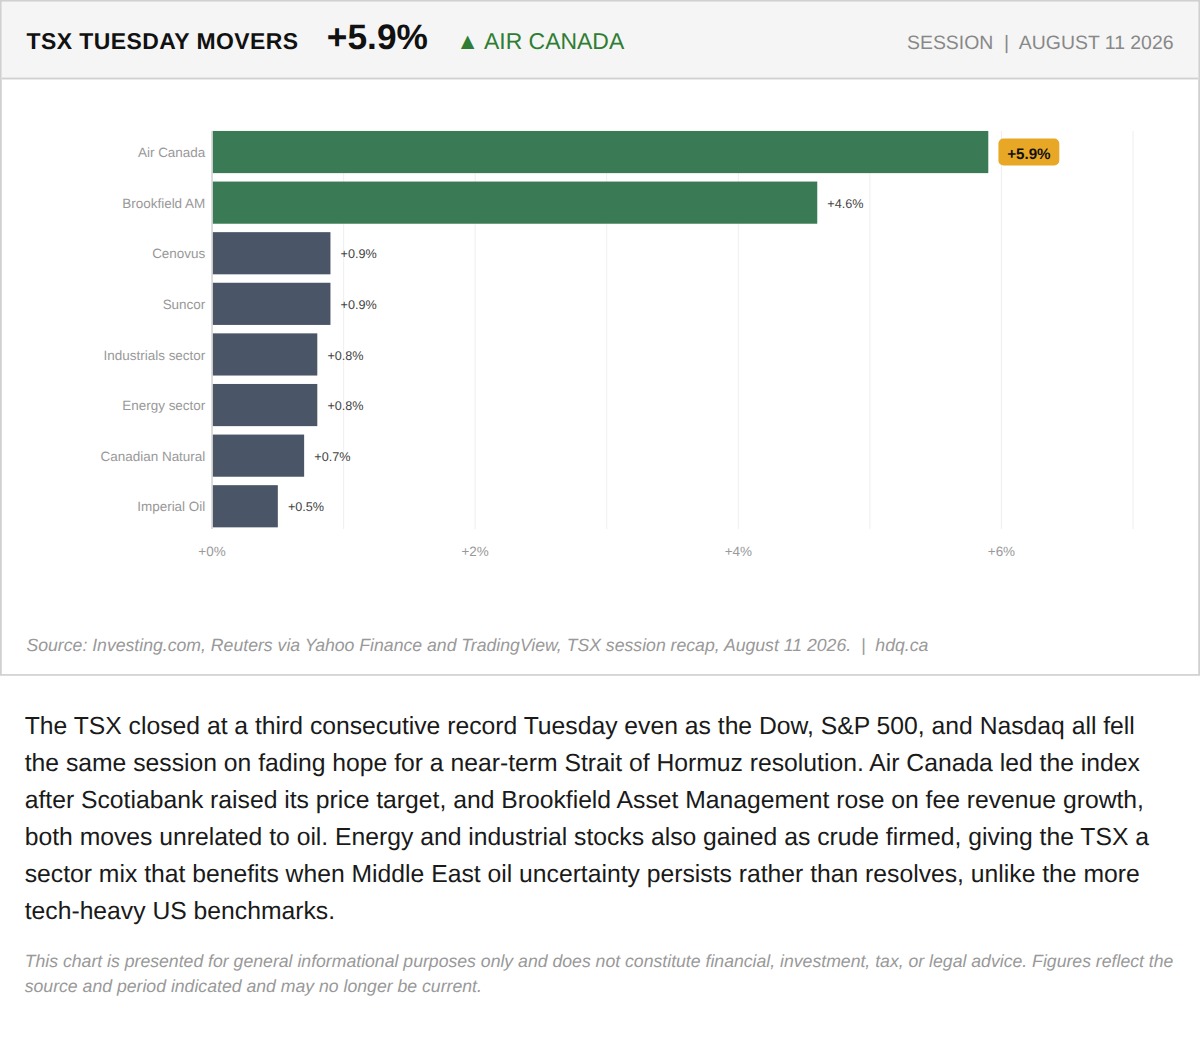
The TSX closed at a third consecutive record Tuesday even as the Dow, S&P 500, and Nasdaq all fell the same session on fading hope for a near-term Strait of Hormuz resolution.
The TSX Hit a Third Straight Record. Every Major US Index Fell the Same Day.
August 12, 2026
View chart & download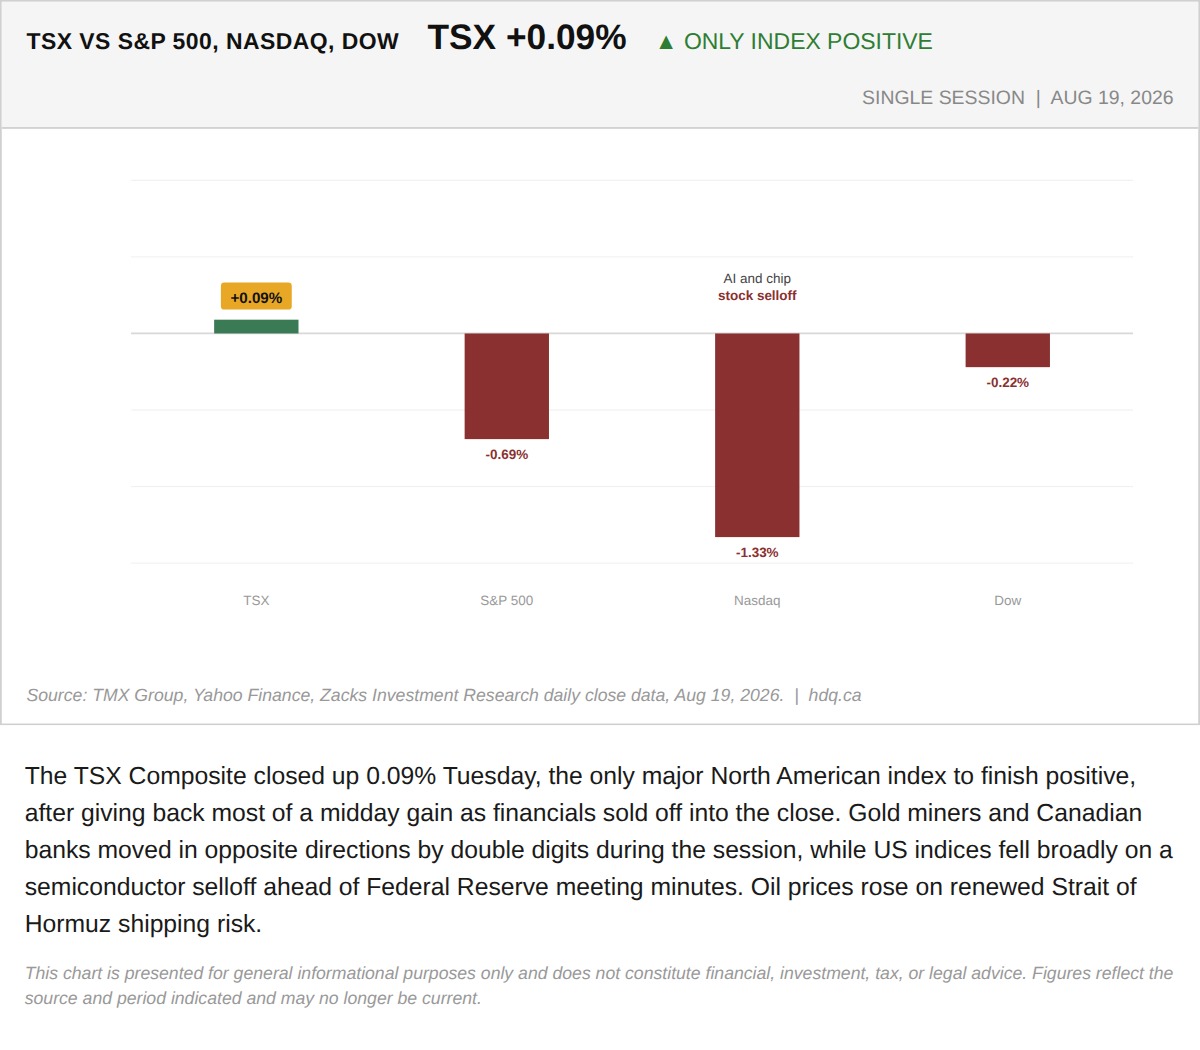
The TSX Composite closed up 0.09% Tuesday, the only major North American index to finish positive, after giving back most of a midday gain as financials sold off into the close.
The TSX Gave Back a 127-Point Tariff Rally as Financials Sold Off Into the Close
August 19, 2026
View chart & download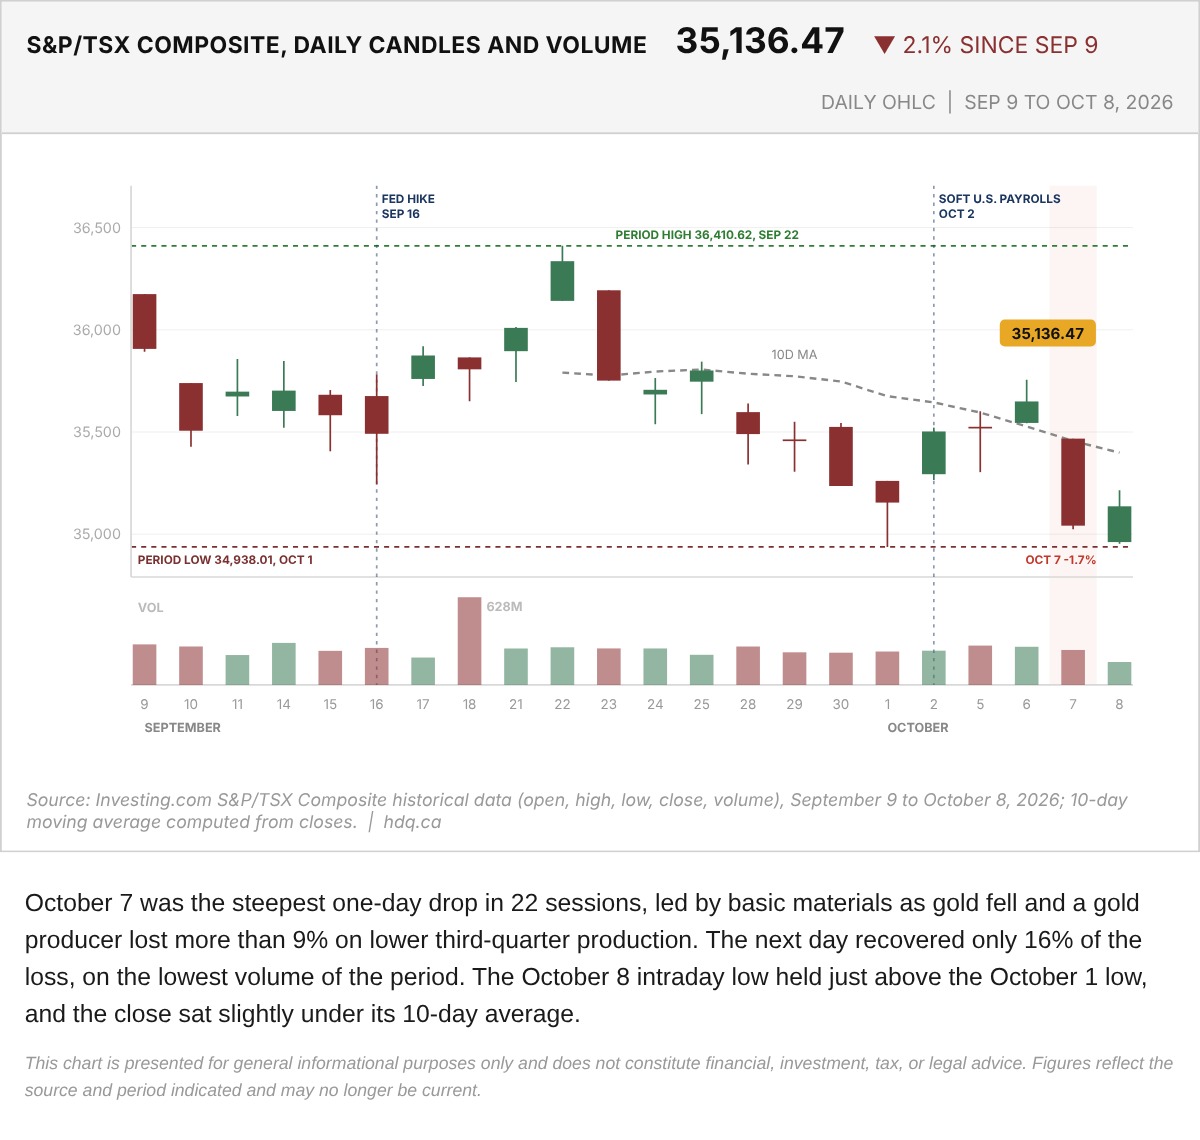
October 7 was the steepest one-day drop in 22 sessions, led by basic materials as gold fell and a gold producer lost more than 9% on lower third-quarter production.
S&P/TSX Composite Daily Candles and Volume, September 9 to October 8
October 9, 2026
View chart & download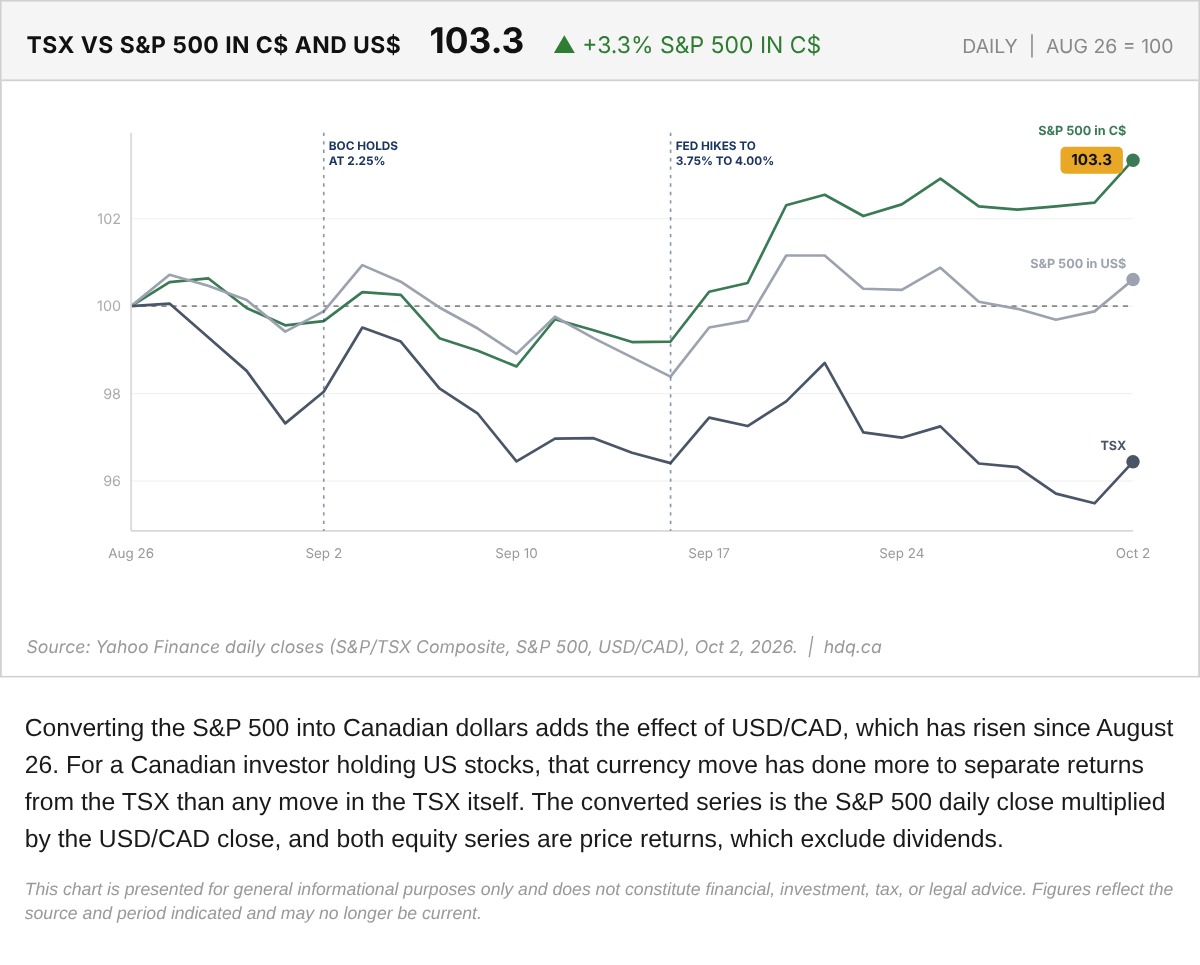
Converting the S&P 500 into Canadian dollars adds the effect of USD/CAD, which has risen since August 26.
TSX Versus S&P 500 in Canadian and US Dollars, Indexed to August 26, 2026
October 2, 2026
View chart & download