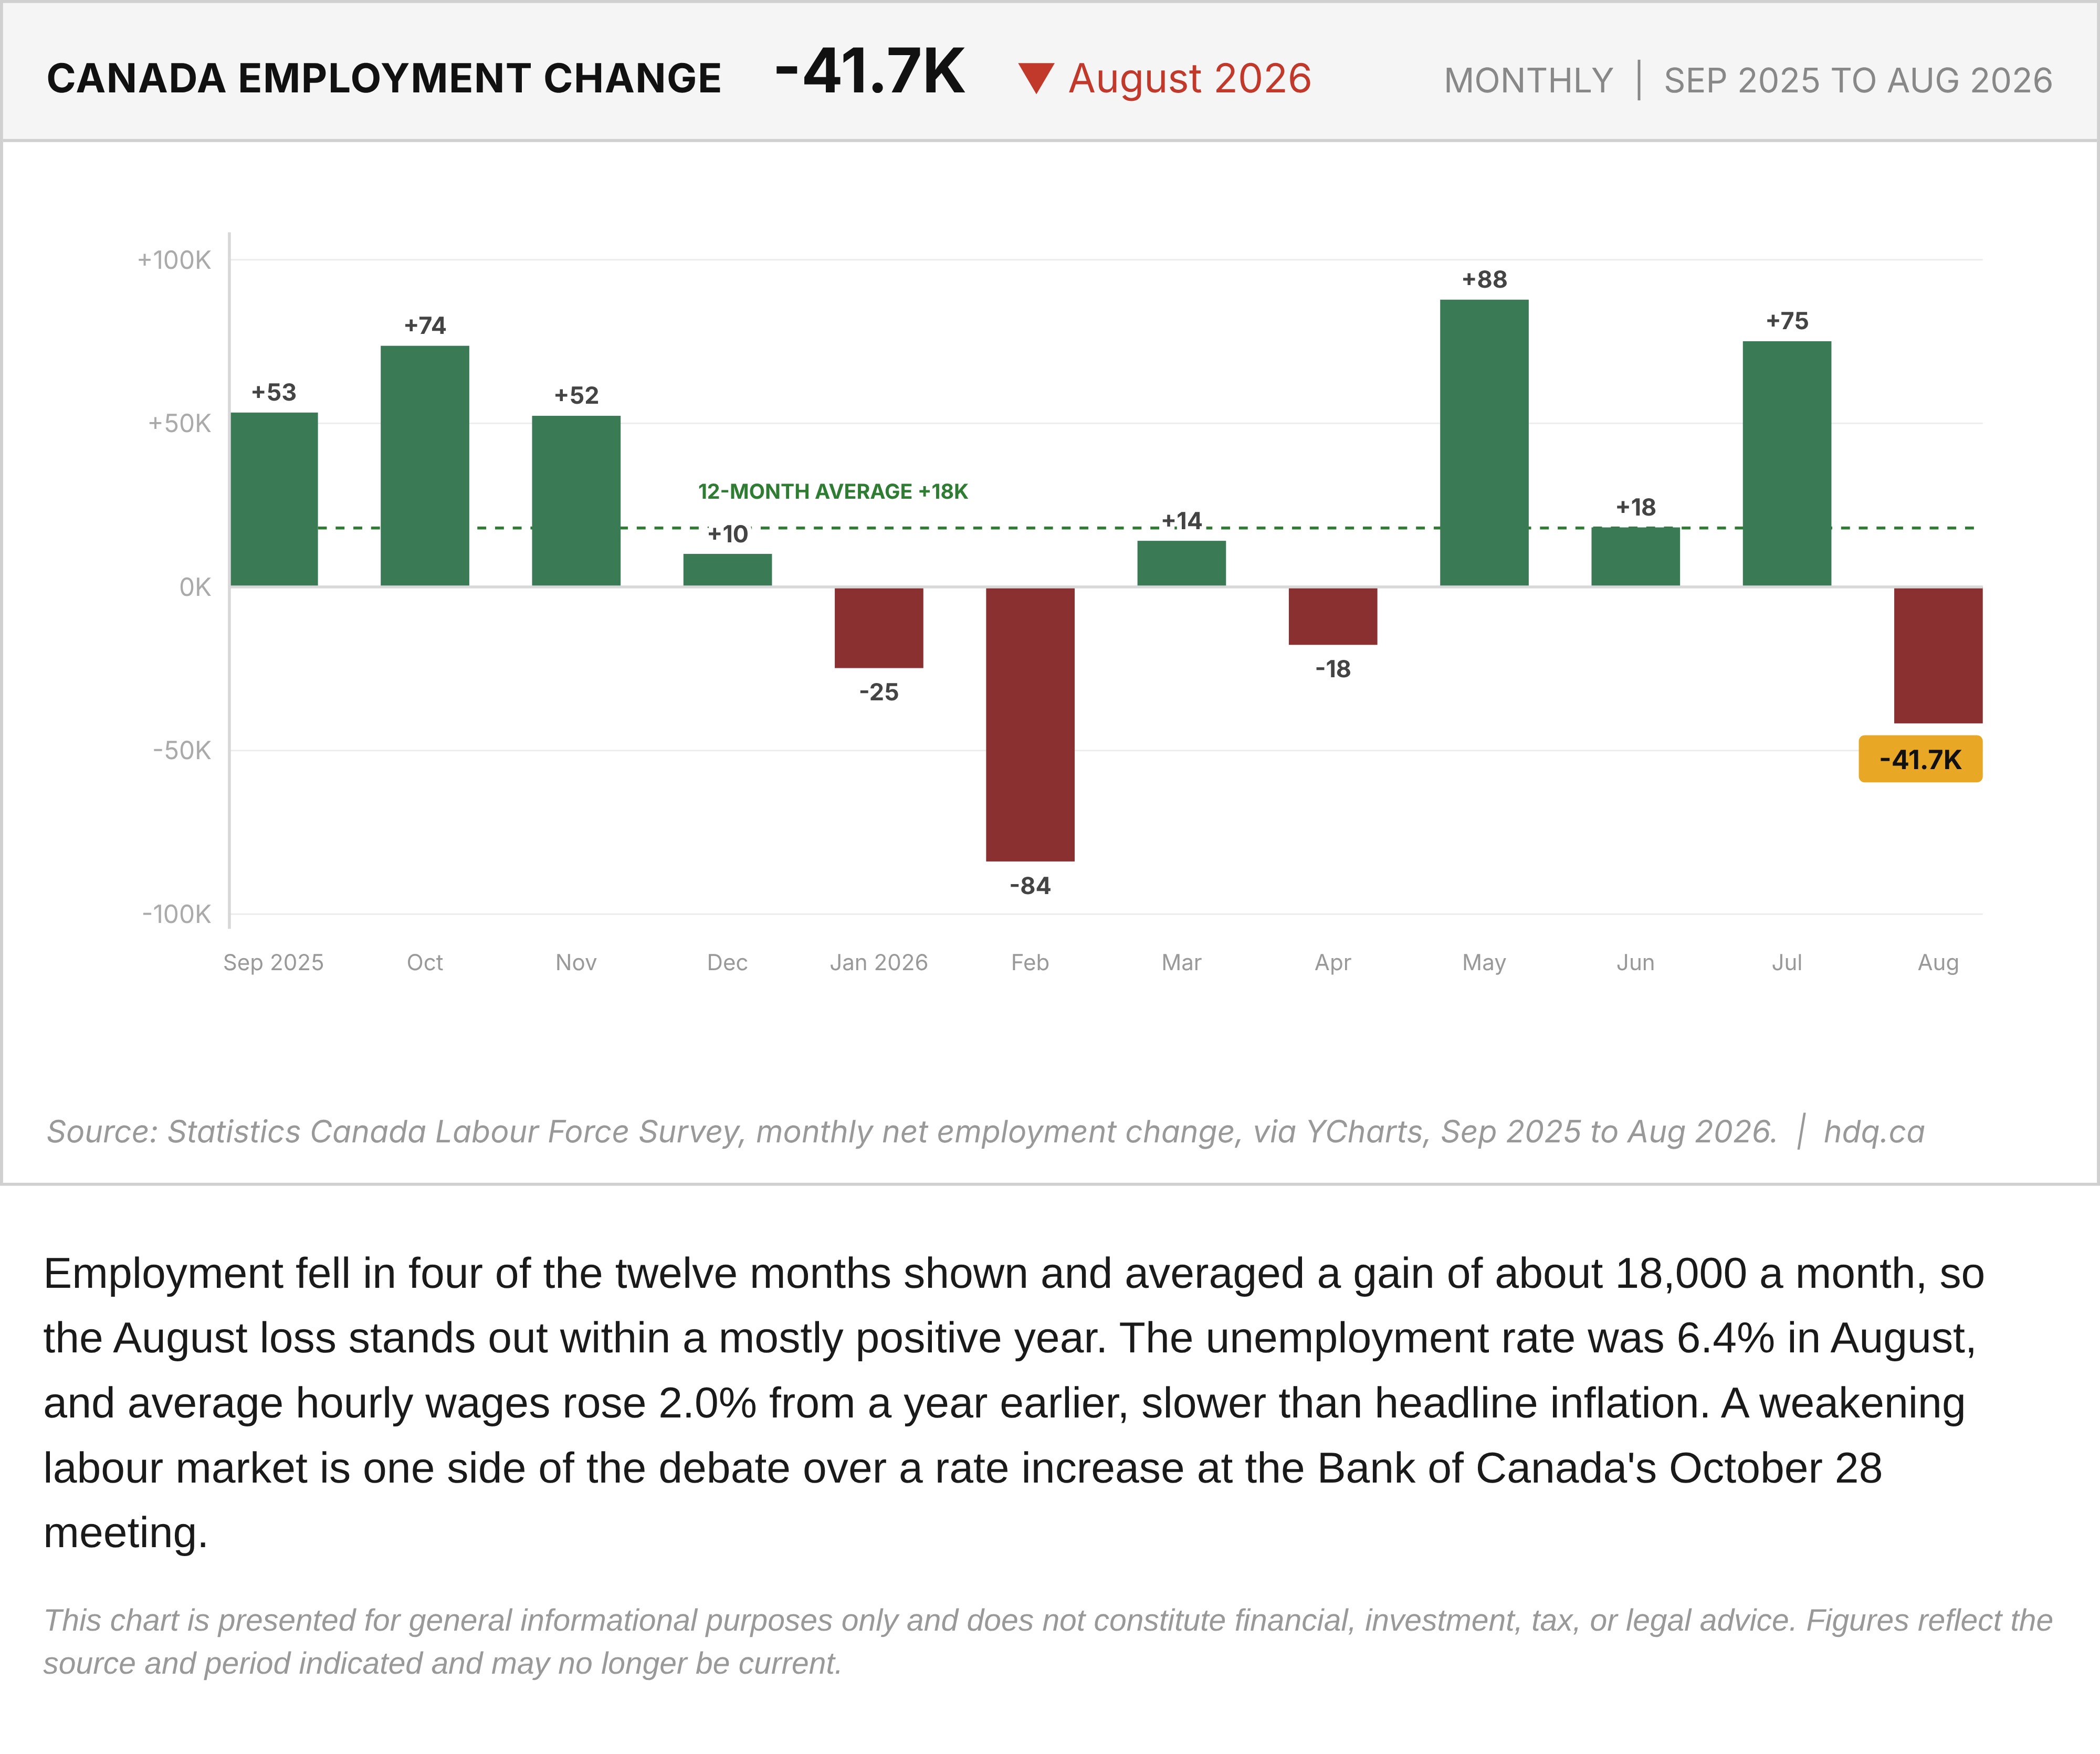
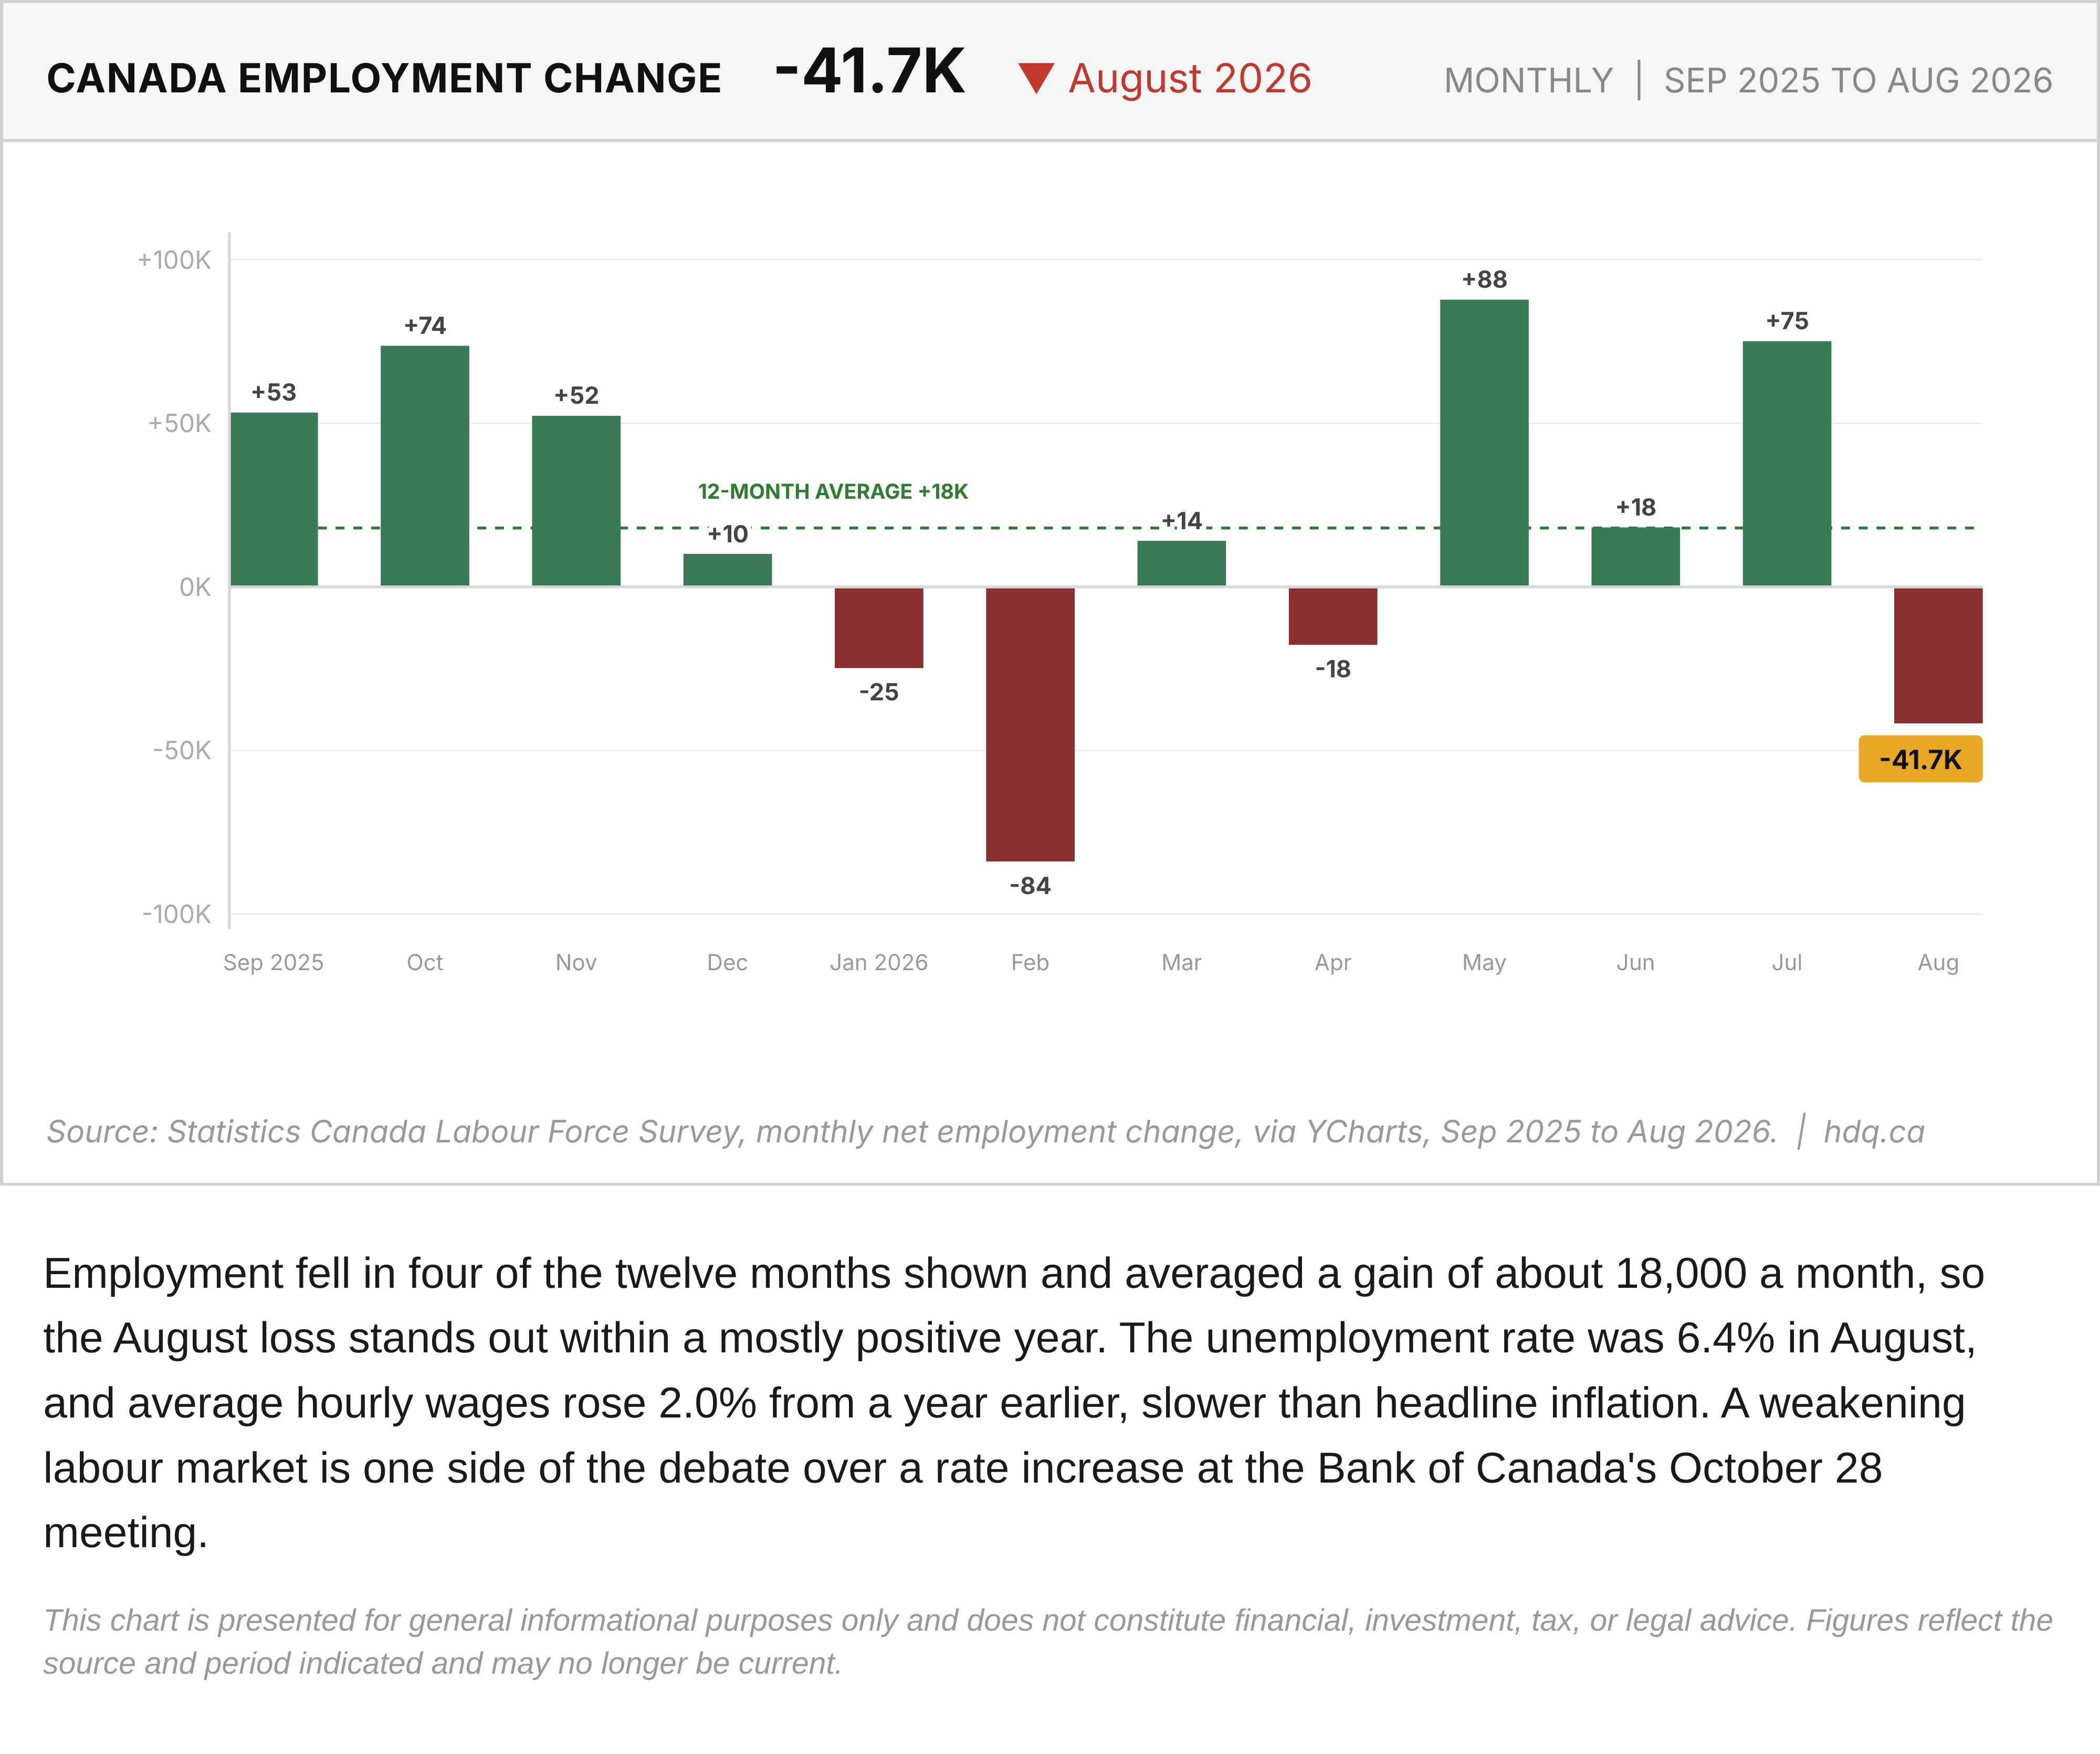
Employment fell in four of the twelve months shown and averaged a gain of about 18,000 a month, so the August loss stands out within a mostly positive year. The unemployment rate was 6.4% in August, and average hourly wages rose 2.0% from a year earlier, slower than headline inflation. A weakening labour market is one side of the debate over a rate increase at the Bank of Canada's October 28 meeting.
This chart is presented for general informational purposes only and does not constitute financial, investment, tax, or legal advice. Figures reflect the source and period indicated and may no longer be current.
Related charts
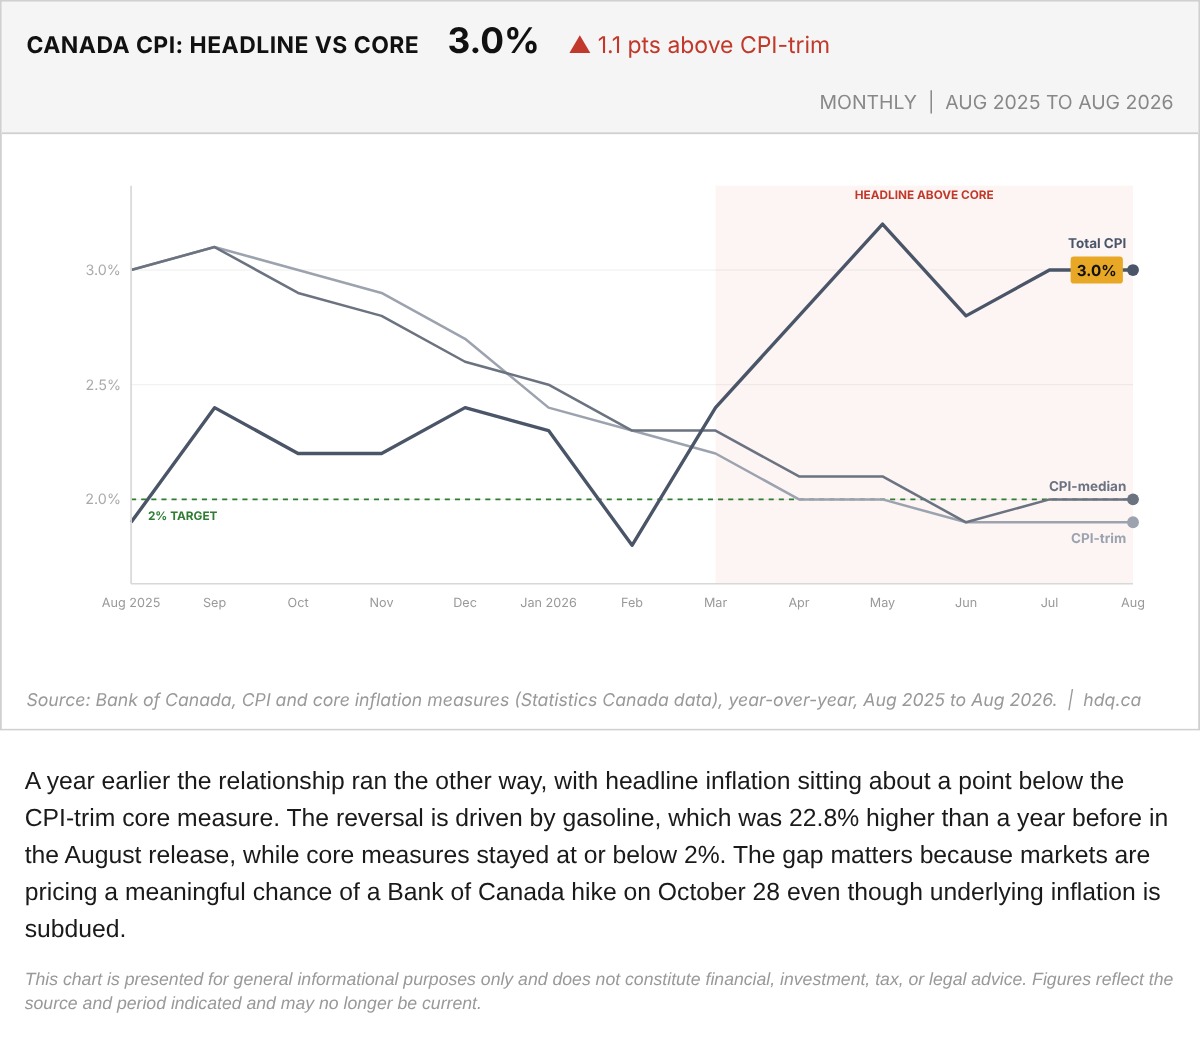
A year earlier the relationship ran the other way, with headline inflation sitting about a point below the CPI-trim core measure.
Canada Headline CPI Against Bank of Canada Core Measures, August 2026
October 6, 2026
View chart & download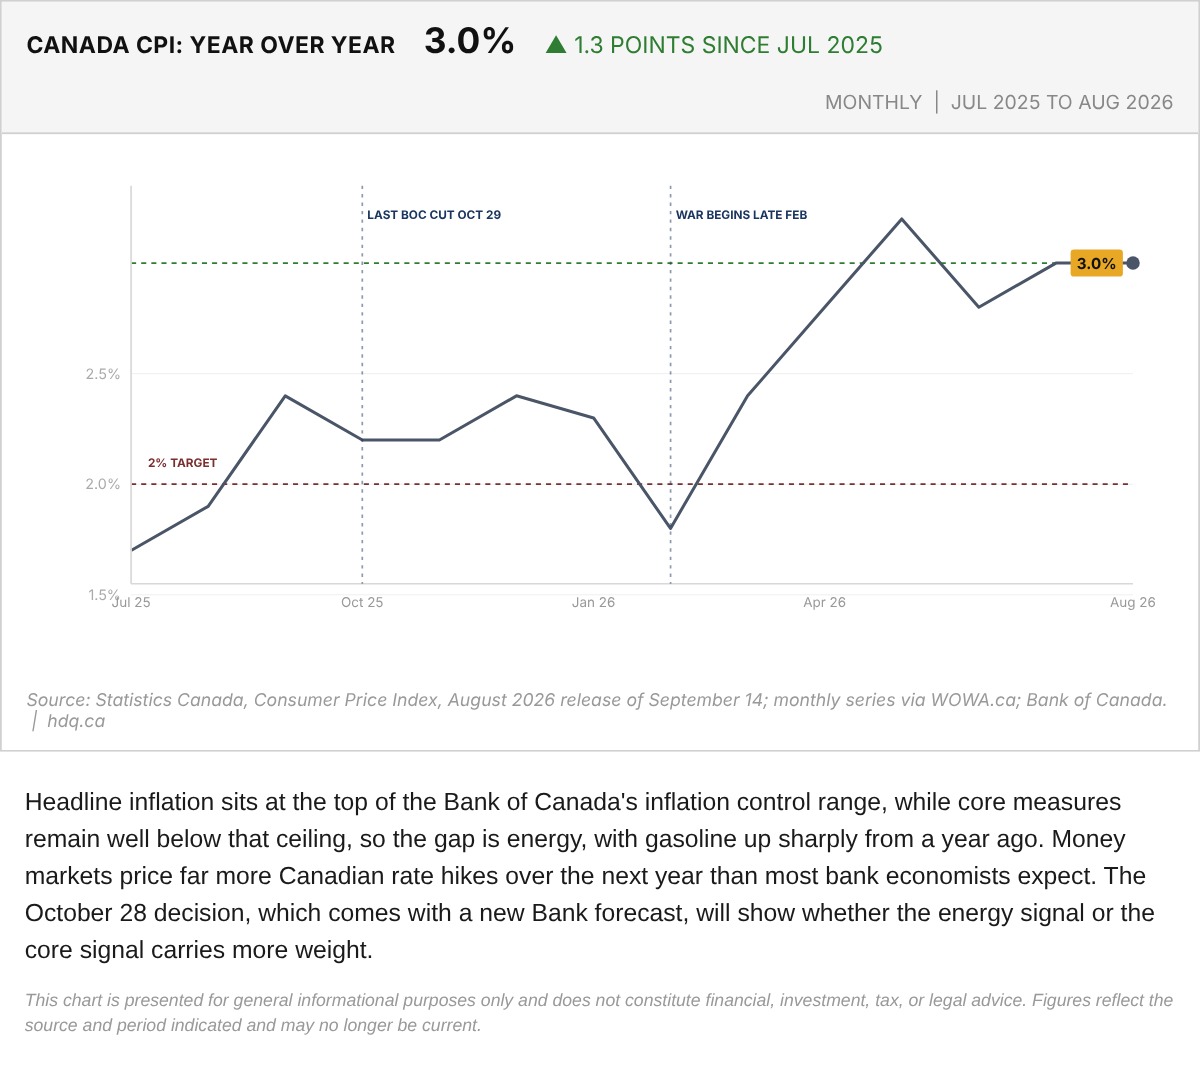
Headline inflation sits at the top of the Bank of Canada's inflation control range, while core measures remain well below that ceiling, so…
Canada Consumer Price Index Inflation, Year Over Year, July 2025 to August 2026
September 29, 2026
View chart & download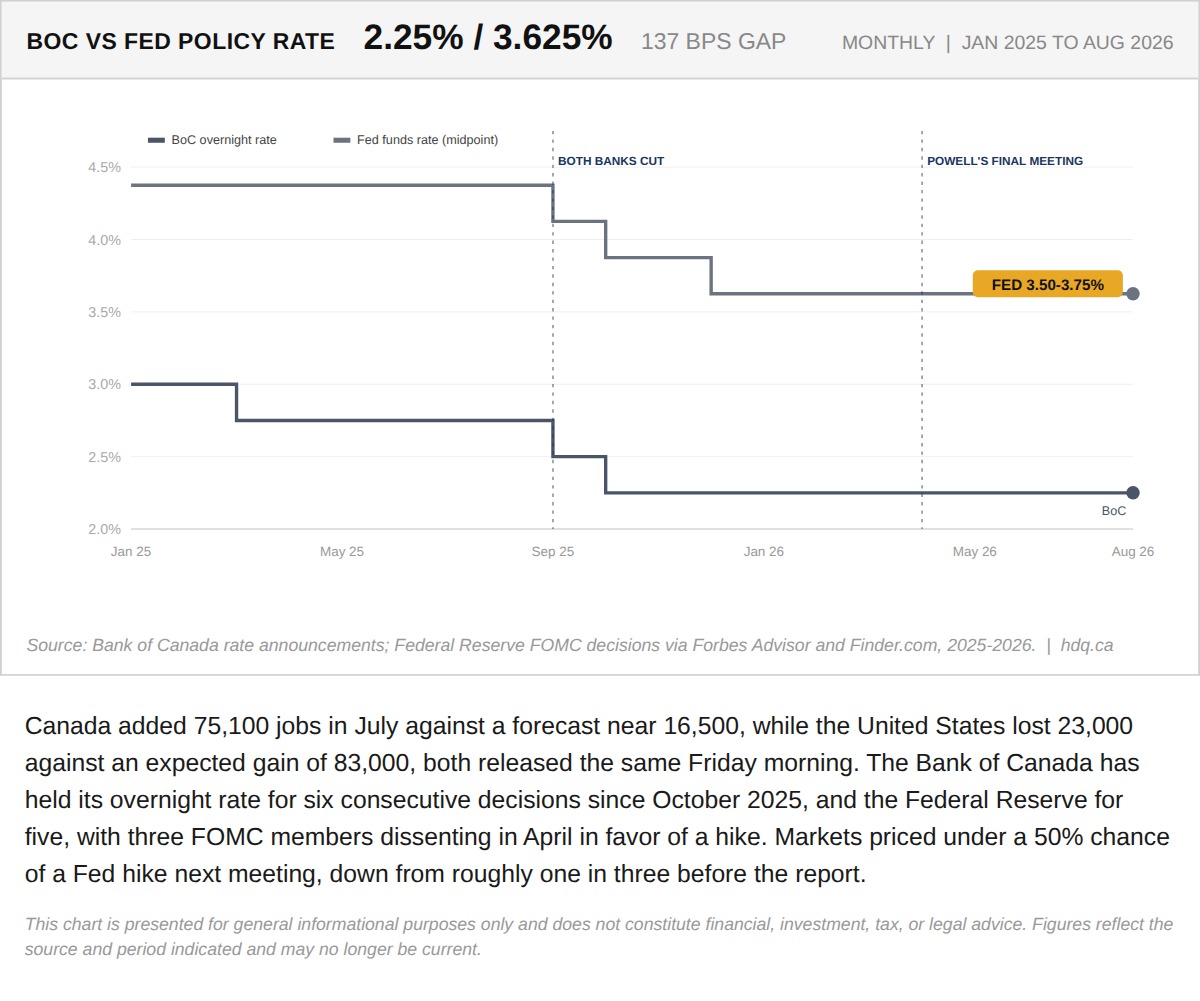
Canada added 75,100 jobs in July against a forecast near 16,500, while the United States lost 23,000 against an expected gain of 83,000, both released the same Friday morning.
Canada and the US Got Opposite Jobs Surprises, and the BoC-Fed Rate Gap Didn't Budge
August 7, 2026
View chart & download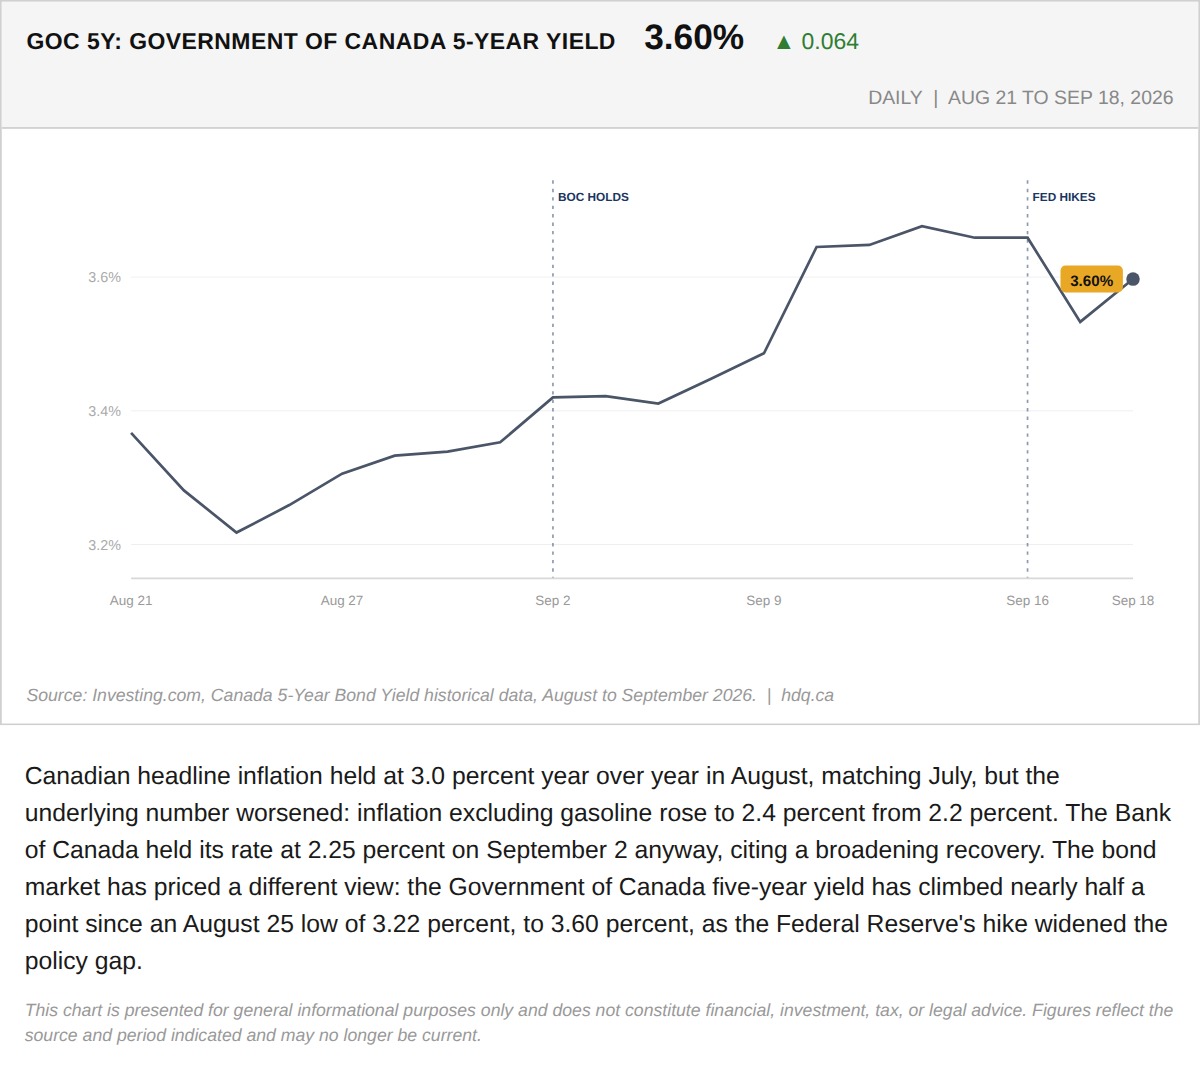
Canadian headline inflation held at 3.0 percent year over year in August, matching July, but the underlying number worsened: inflation…
The Bond Market Already Moved Before the Bank of Canada Has To
September 21, 2026
View chart & download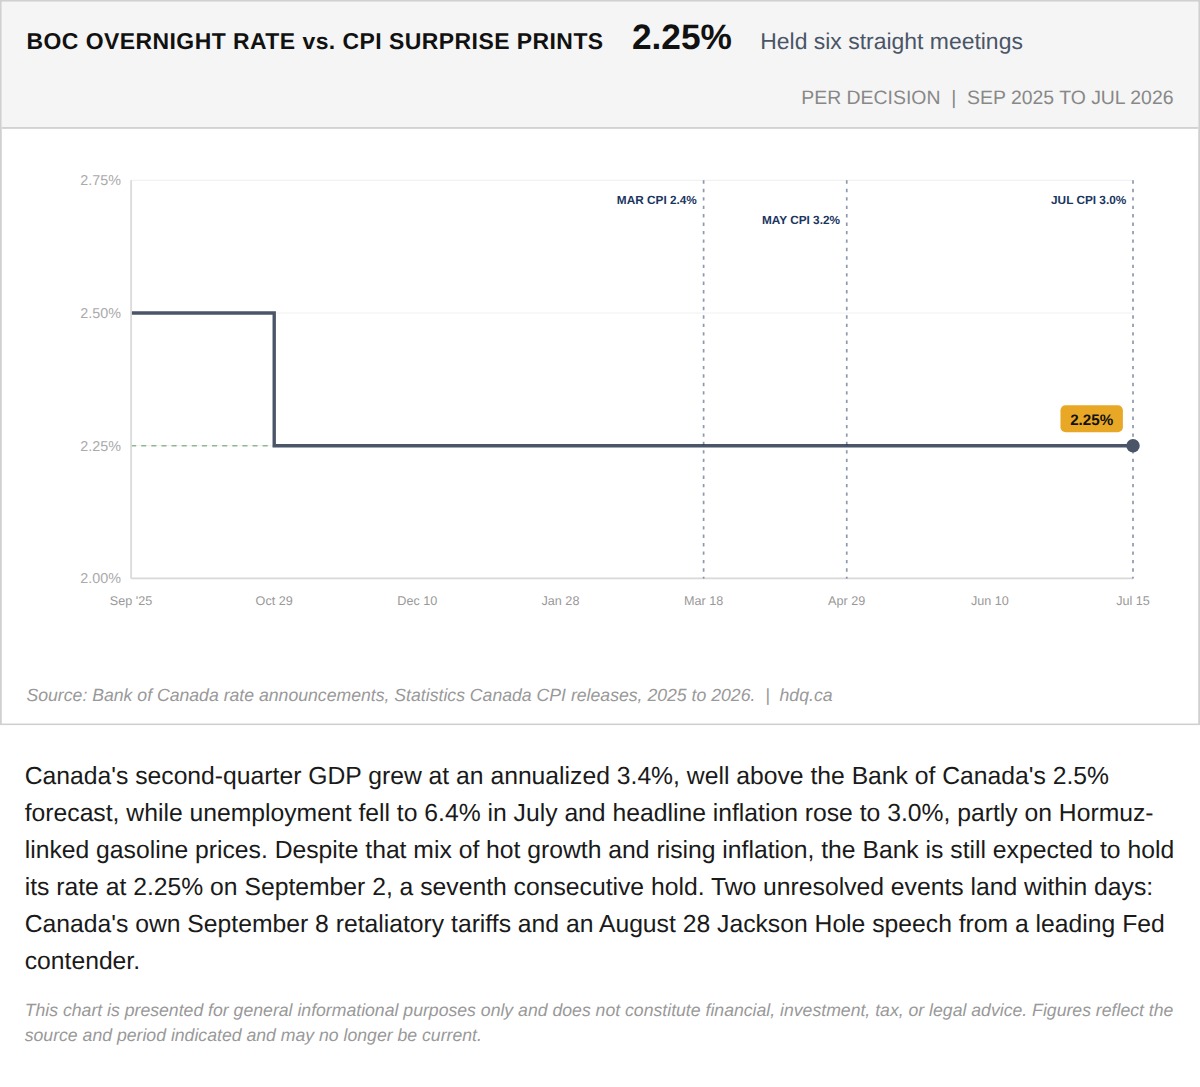
Canada's second-quarter GDP grew at an annualized 3.4%, well above the Bank of Canada's 2.5% forecast, while unemployment fell to 6.4% in…
Canada's Own Numbers Argue for a Hike. The Bank Will Hold Anyway.
August 24, 2026
View chart & download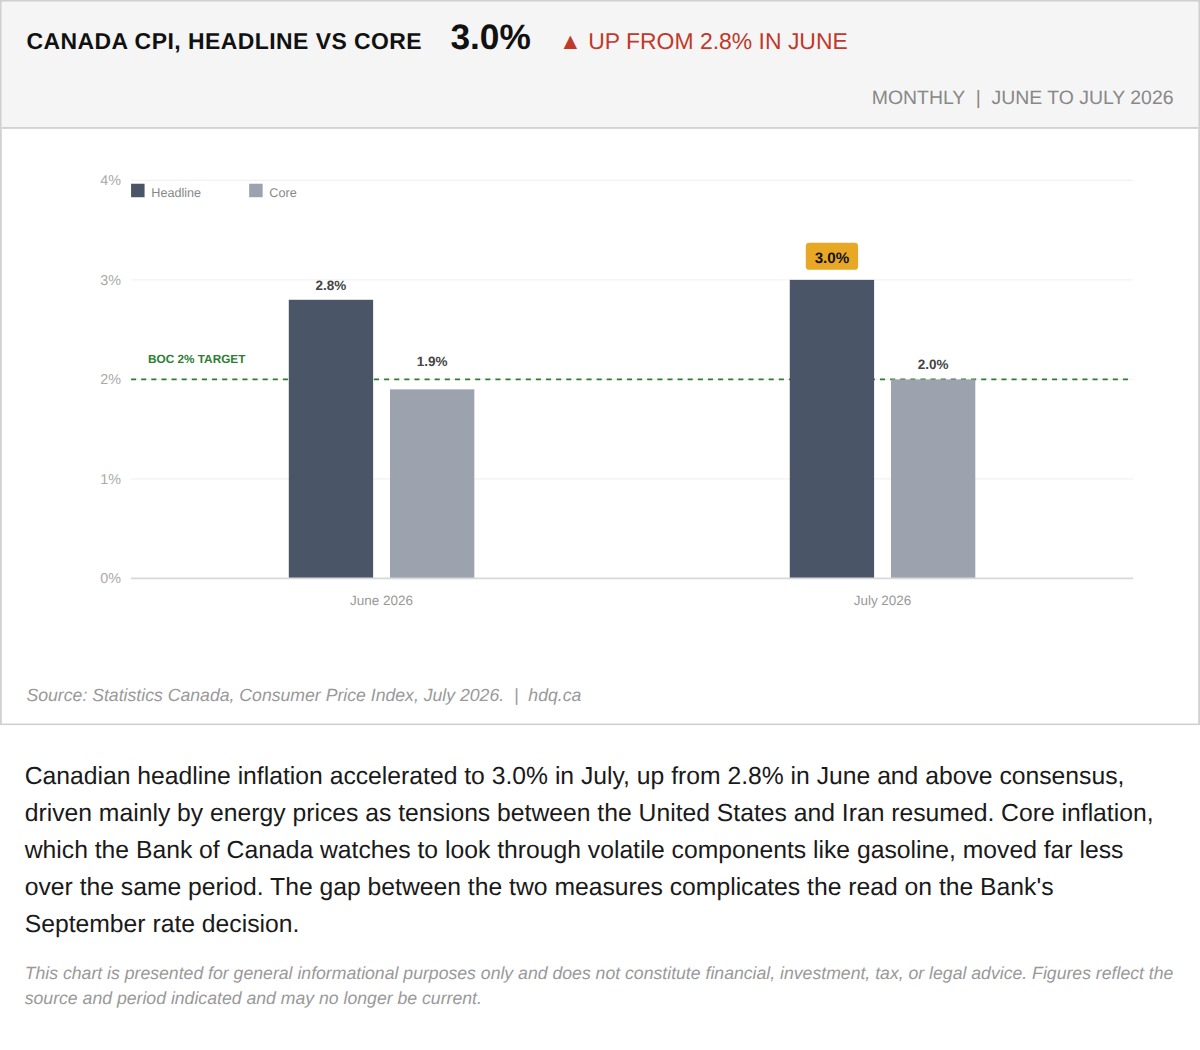
Canadian headline inflation accelerated to 3.0% in July, up from 2.8% in June and above consensus, driven mainly by energy prices as…
August 20, 2026
View chart & download