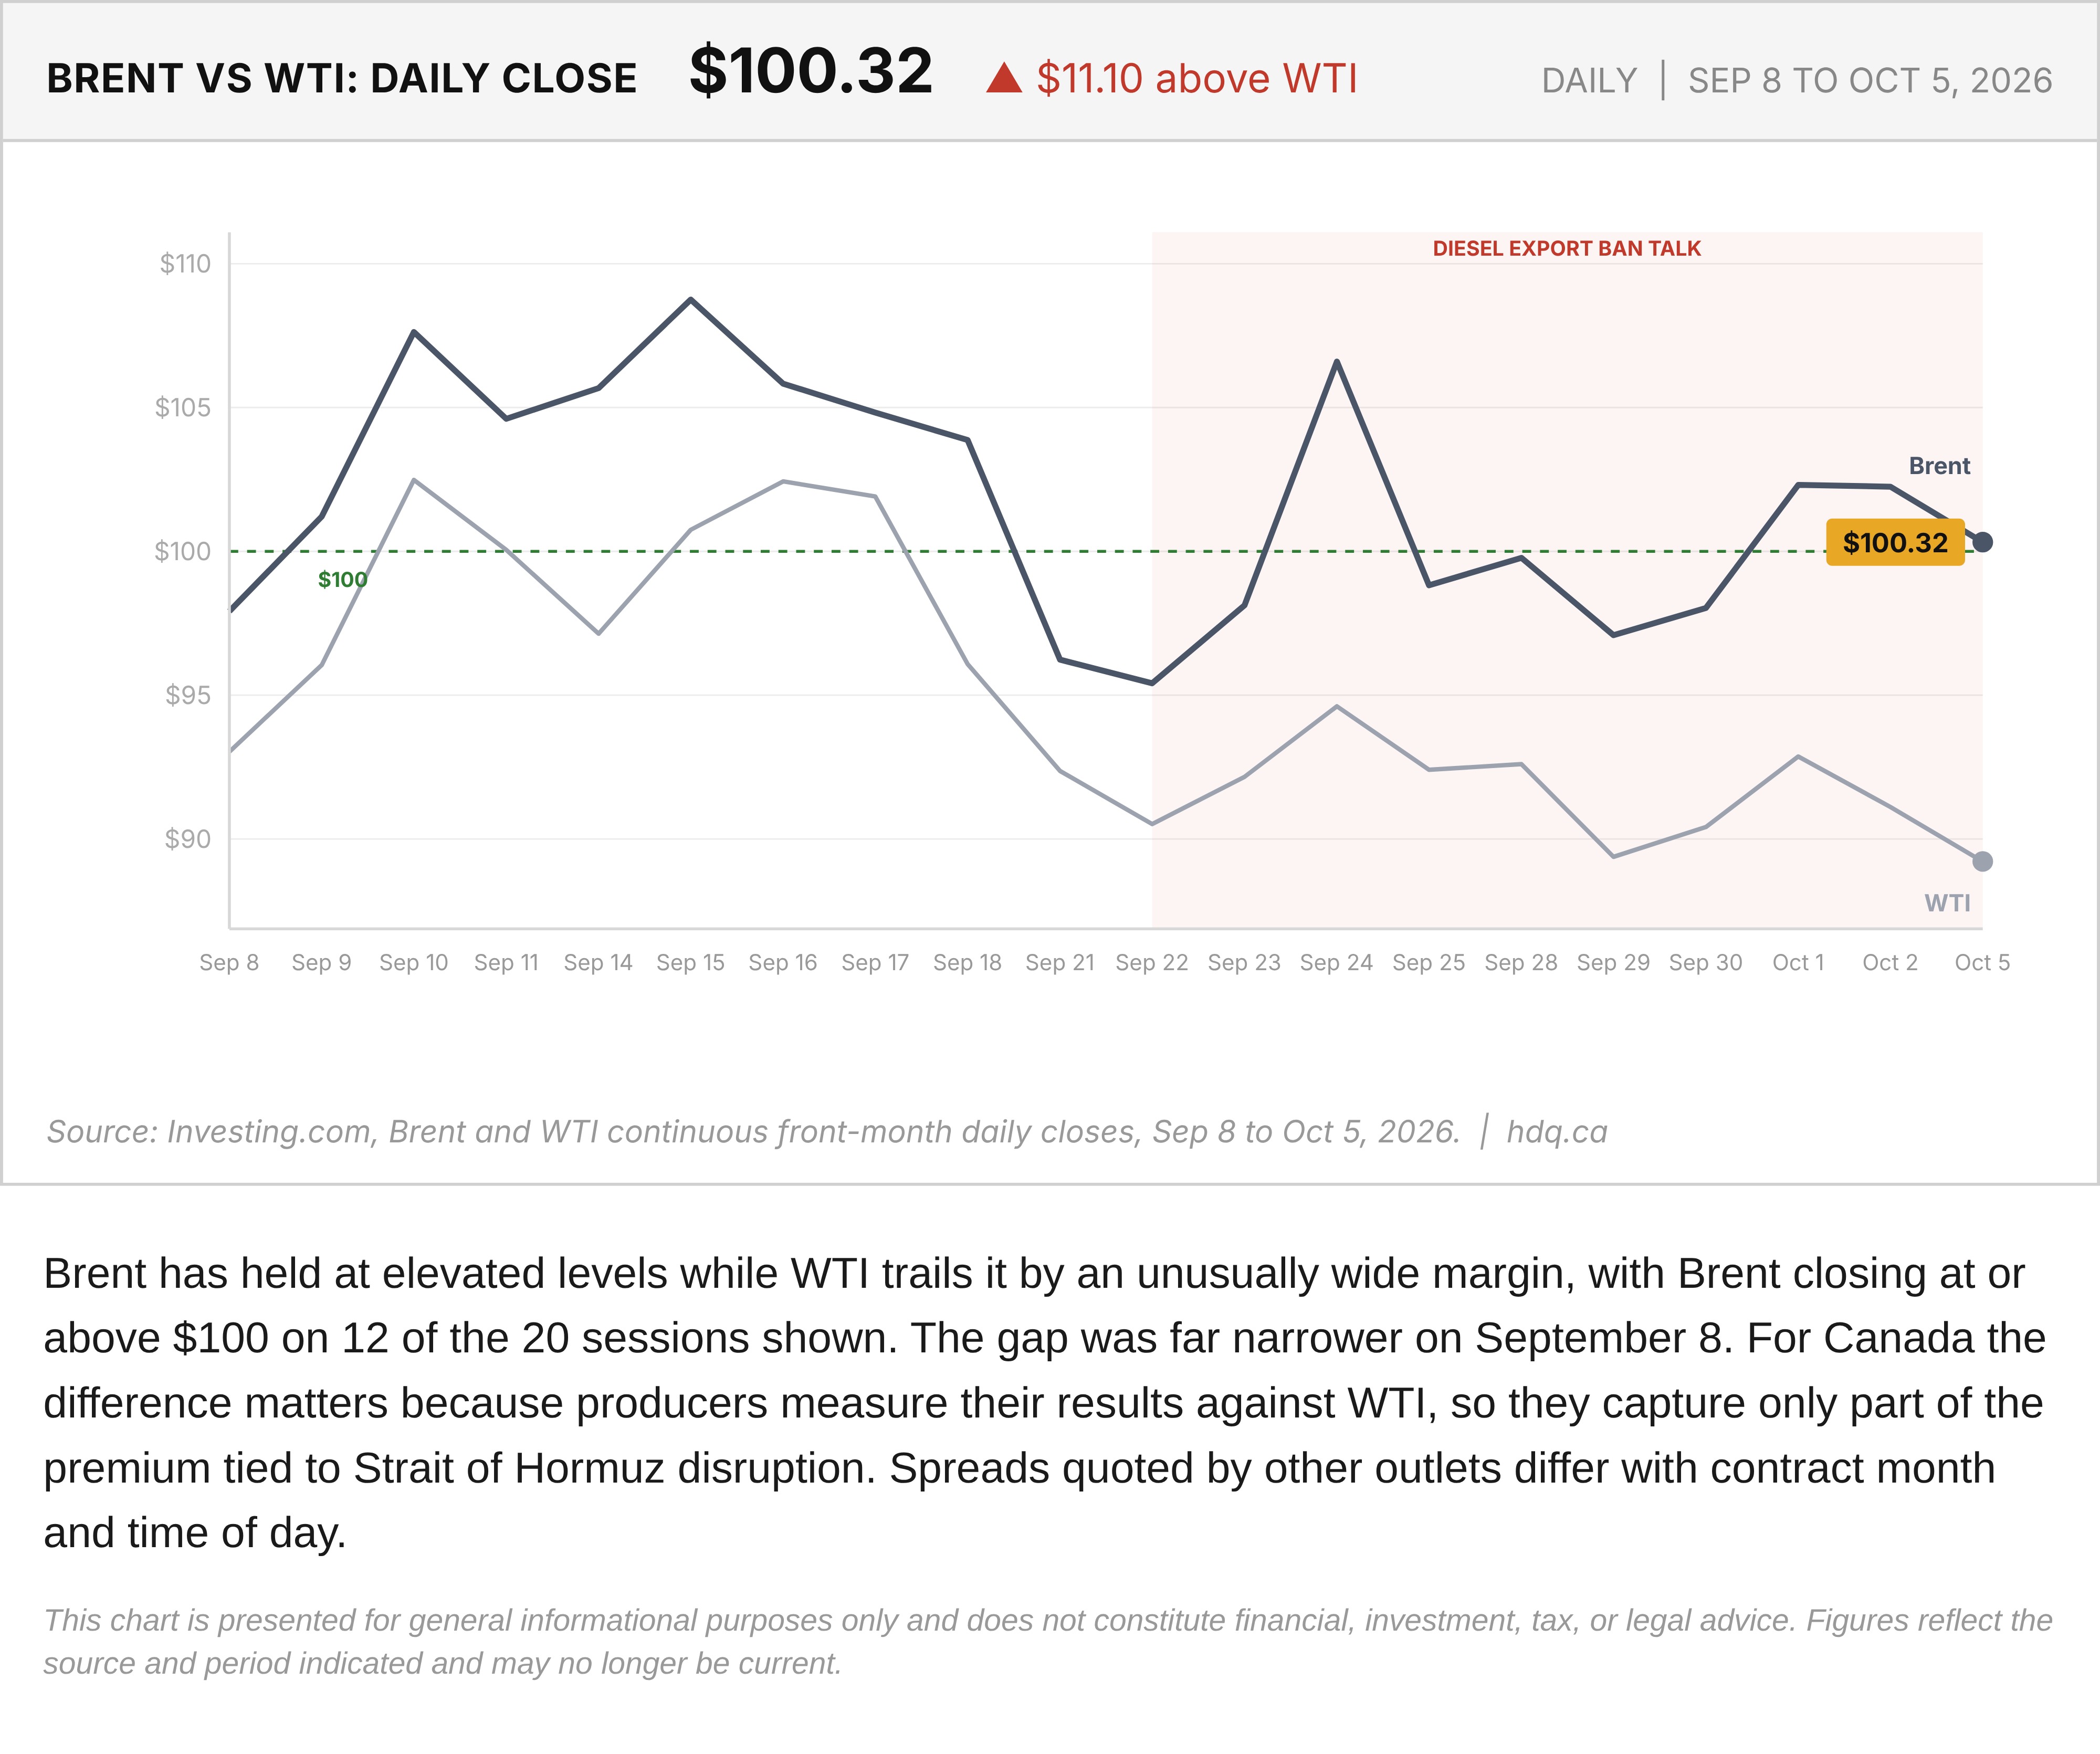
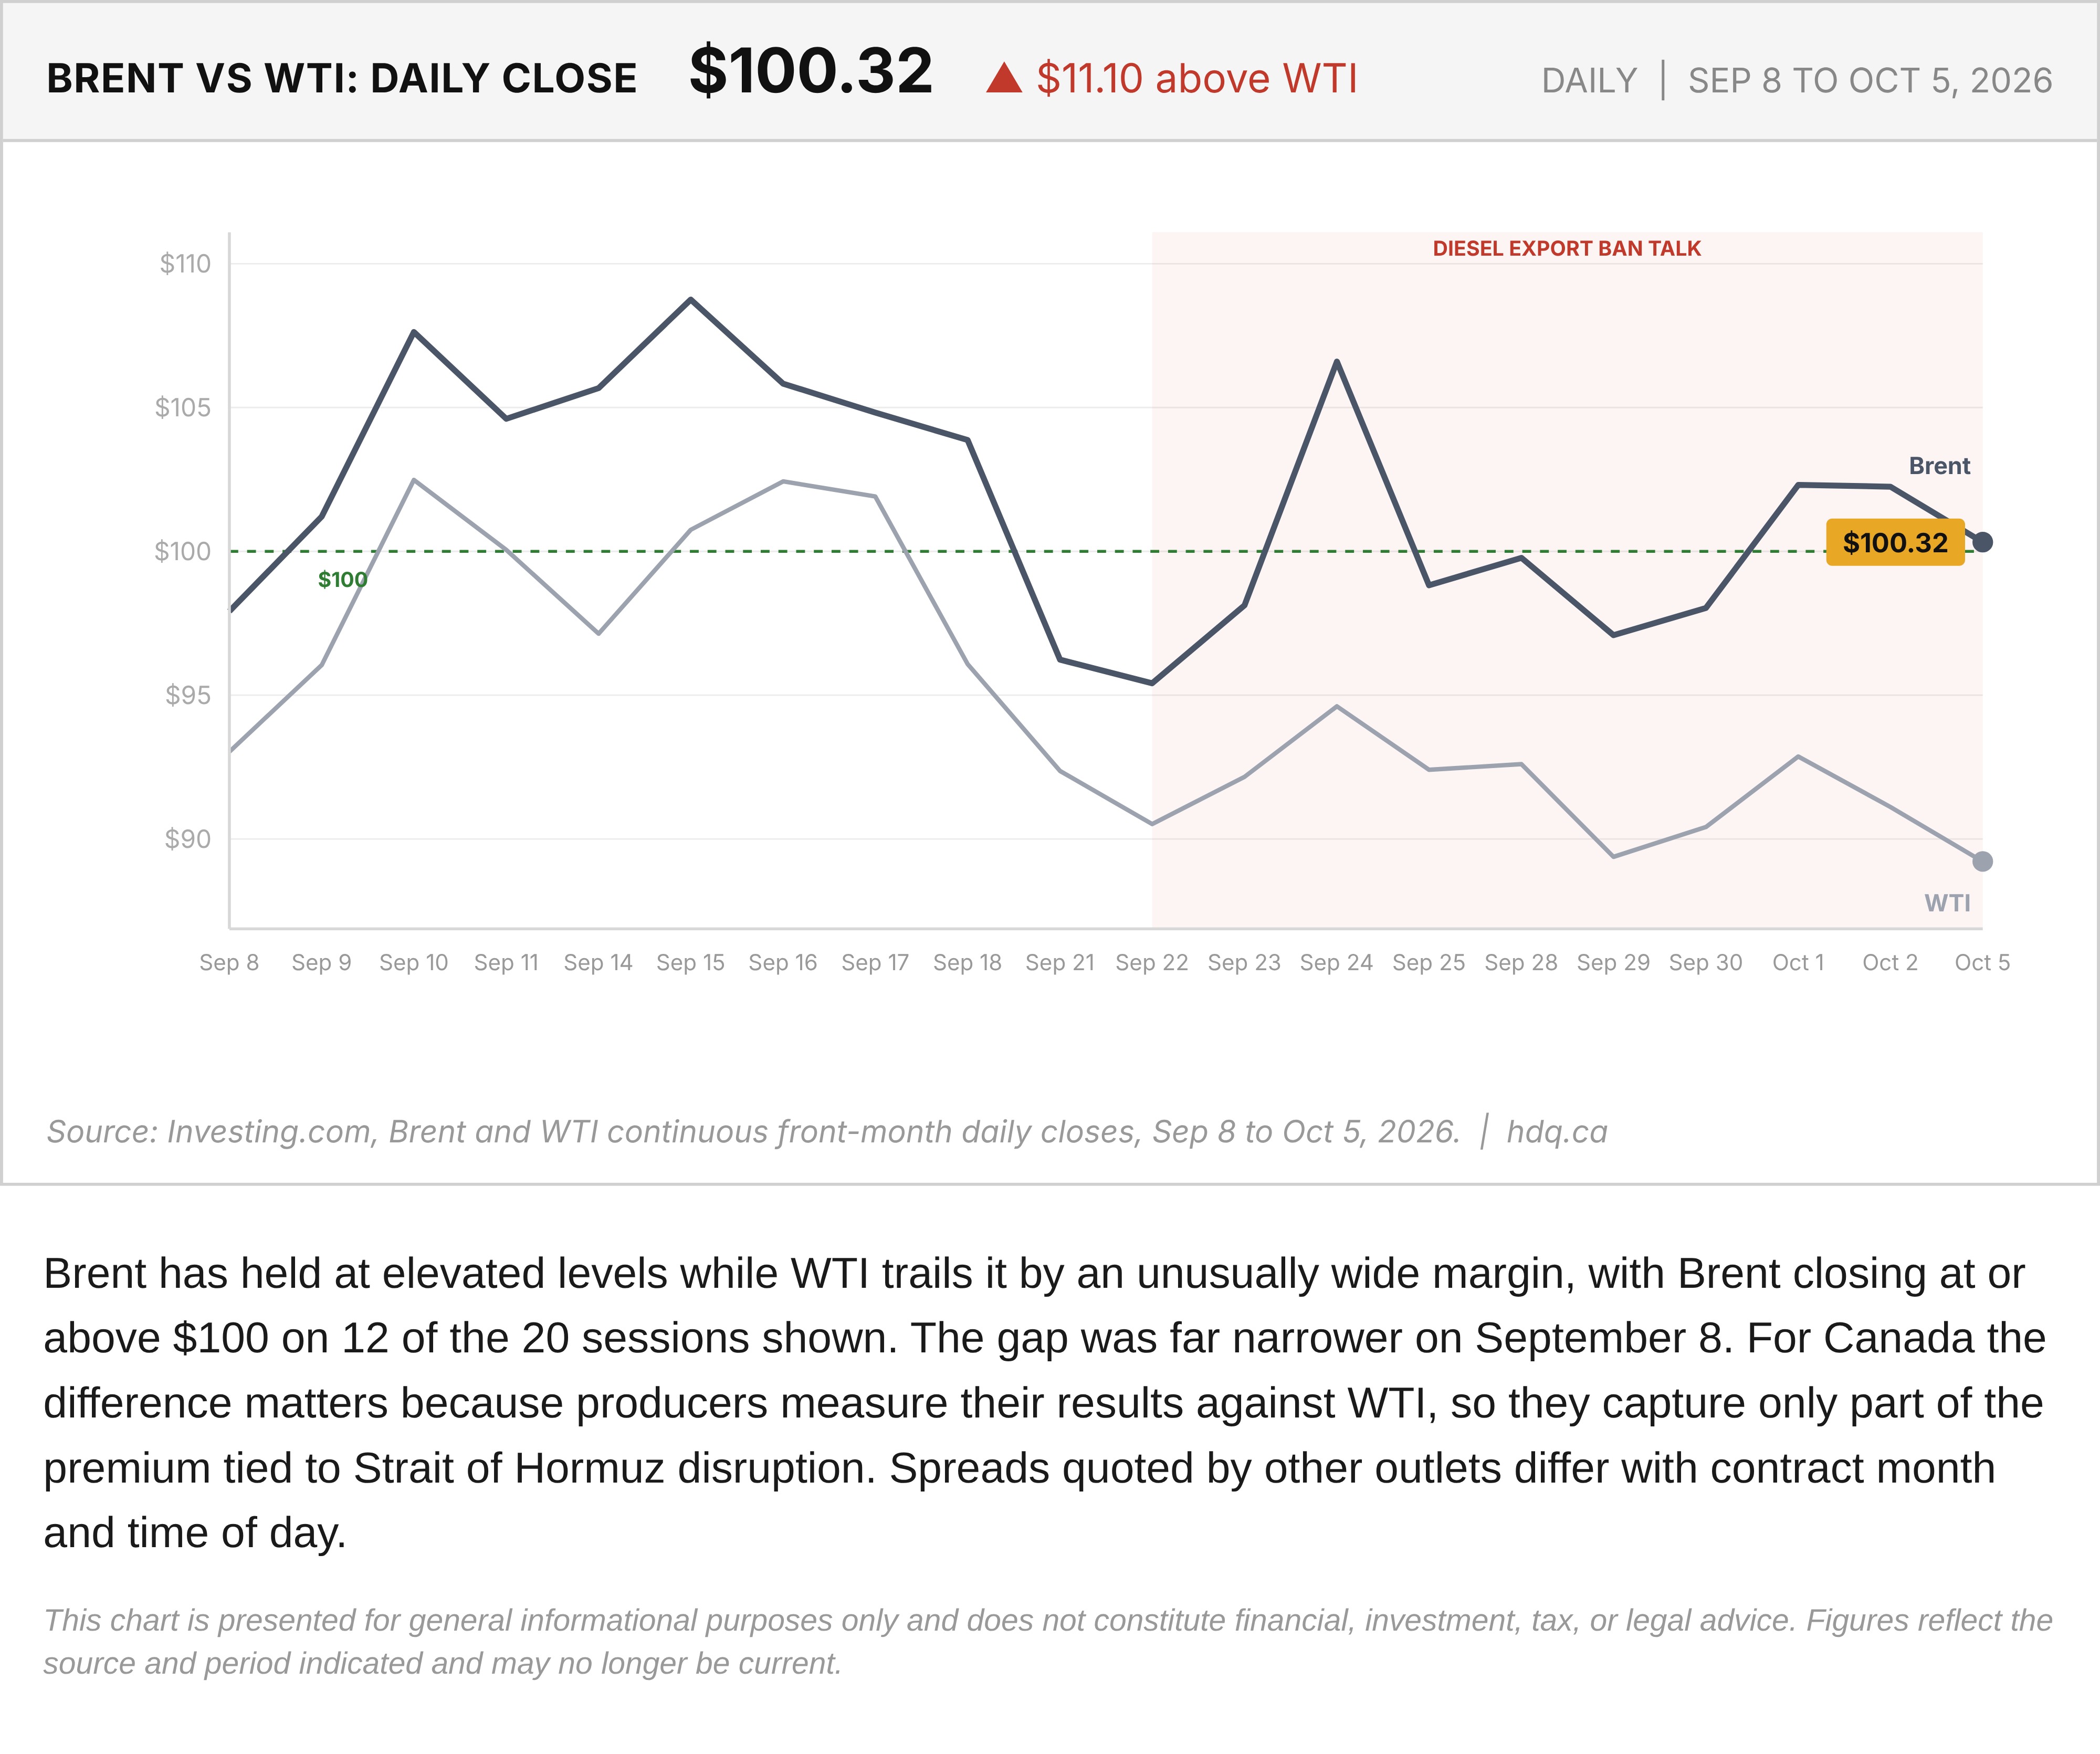
Brent has held at elevated levels while WTI trails it by an unusually wide margin, with Brent closing at or above $100 on 12 of the 20 sessions shown. The gap was far narrower on September 8. For Canada the difference matters because producers measure their results against WTI, so they capture only part of the premium tied to Strait of Hormuz disruption. Spreads quoted by other outlets differ with contract month and time of day.
This chart is presented for general informational purposes only and does not constitute financial, investment, tax, or legal advice. Figures reflect the source and period indicated and may no longer be current.
Related charts
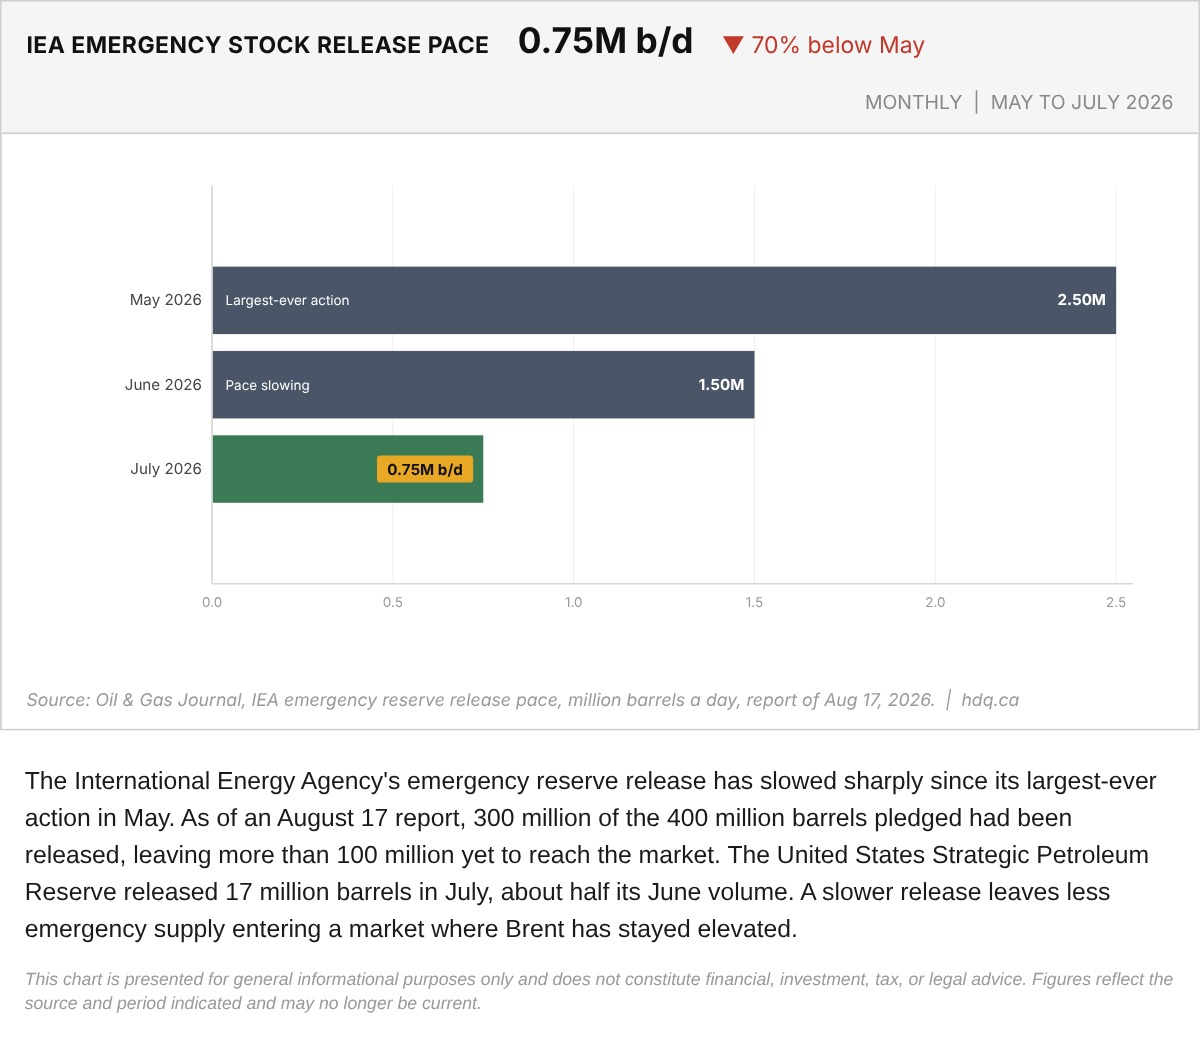
The International Energy Agency's emergency reserve release has slowed sharply since its largest-ever action in May.
IEA Emergency Oil Stock Release Pace, May to July 2026
October 6, 2026
View chart & download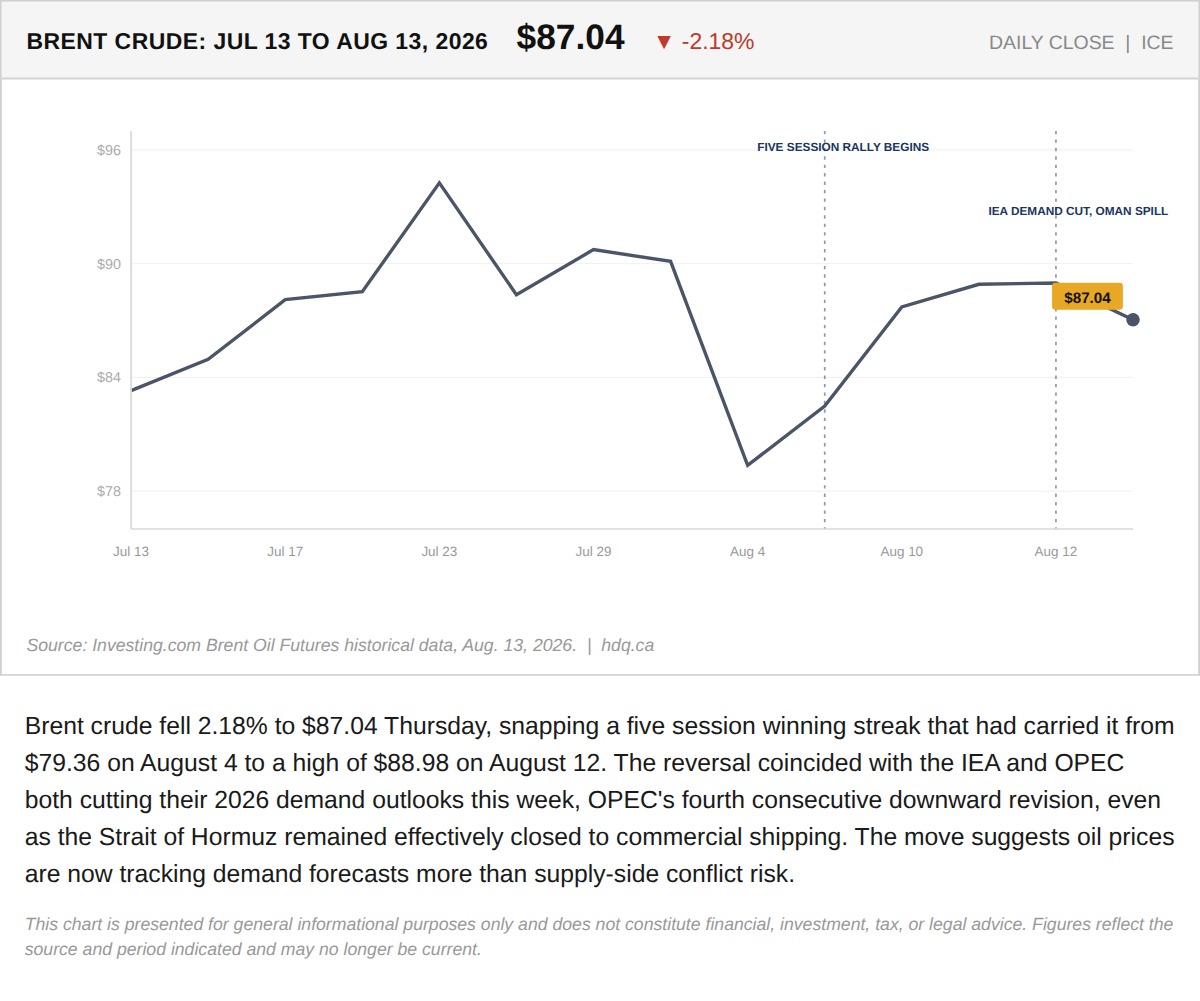
Brent crude fell 2.18% to $87.04 Thursday, snapping a five session winning streak that had carried it from $79.36 on August 4 to a high of $88.98 on August 12.
Oil Fell This Week. The Hormuz Rhetoric Didn't.
August 14, 2026
View chart & download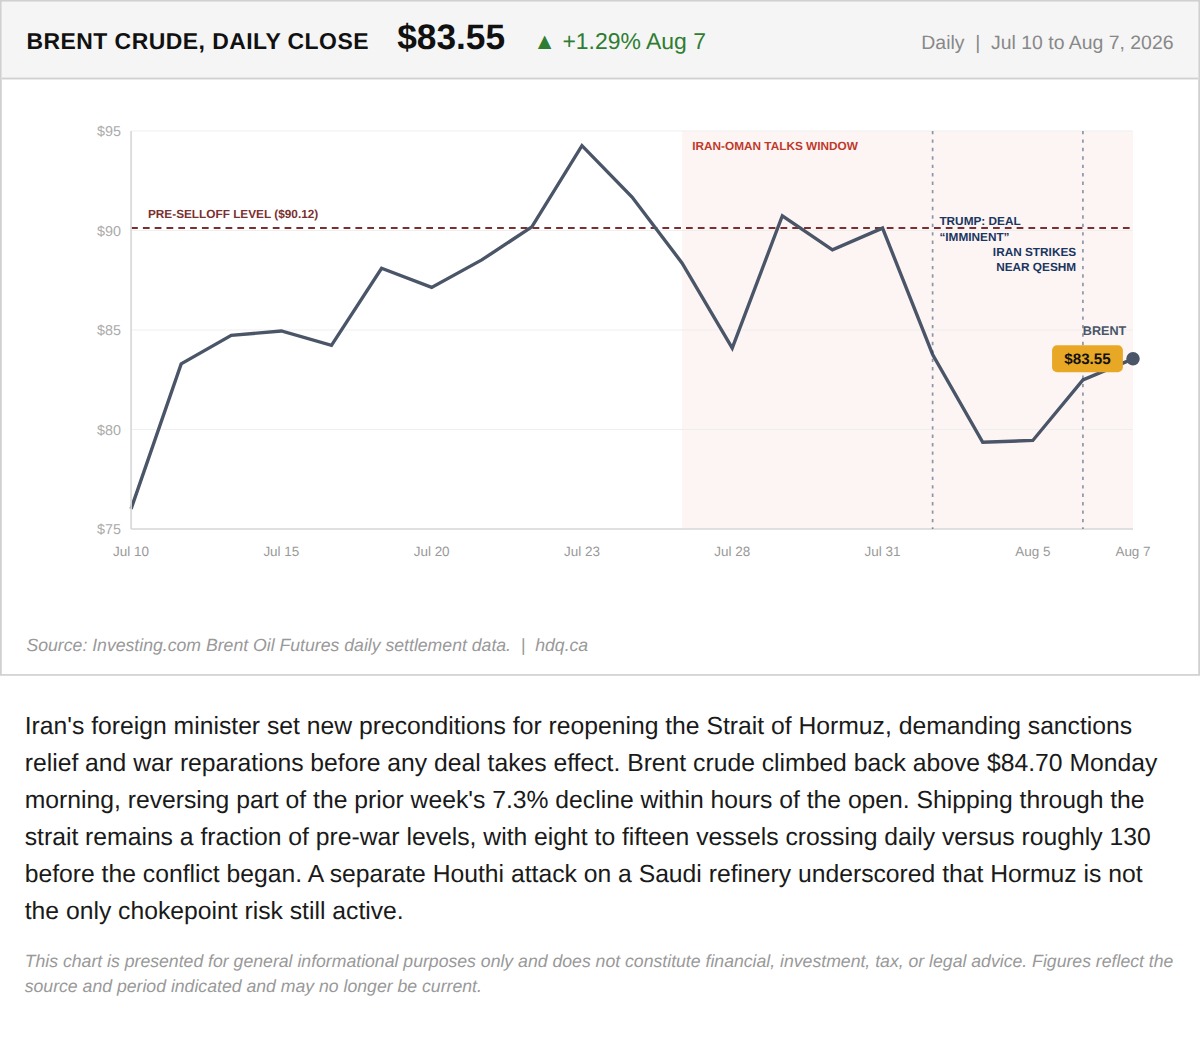
Iran's foreign minister set new preconditions for reopening the Strait of Hormuz, demanding sanctions relief and war reparations before any deal takes effect.
Iran Just Told the Market What the June MOU Actually Requires. The Market Priced Something Else.
August 10, 2026
View chart & download
The S&P/TSX Composite closed July at 35,226, up 1.06% for the month, a modest headline figure that conceals sharp intra-month swings.
S&P/TSX Composite closes July up 1.06% after a volatile month
July 31, 2026
View chart & download
Brent and WTI crude both surged in July, with WTI ending the month at $85.47, up 23.0%, after round-tripping from a five-month low near $68.74.
WTI and Brent crude surge in July as the Iran ceasefire collapses
July 31, 2026
View chart & download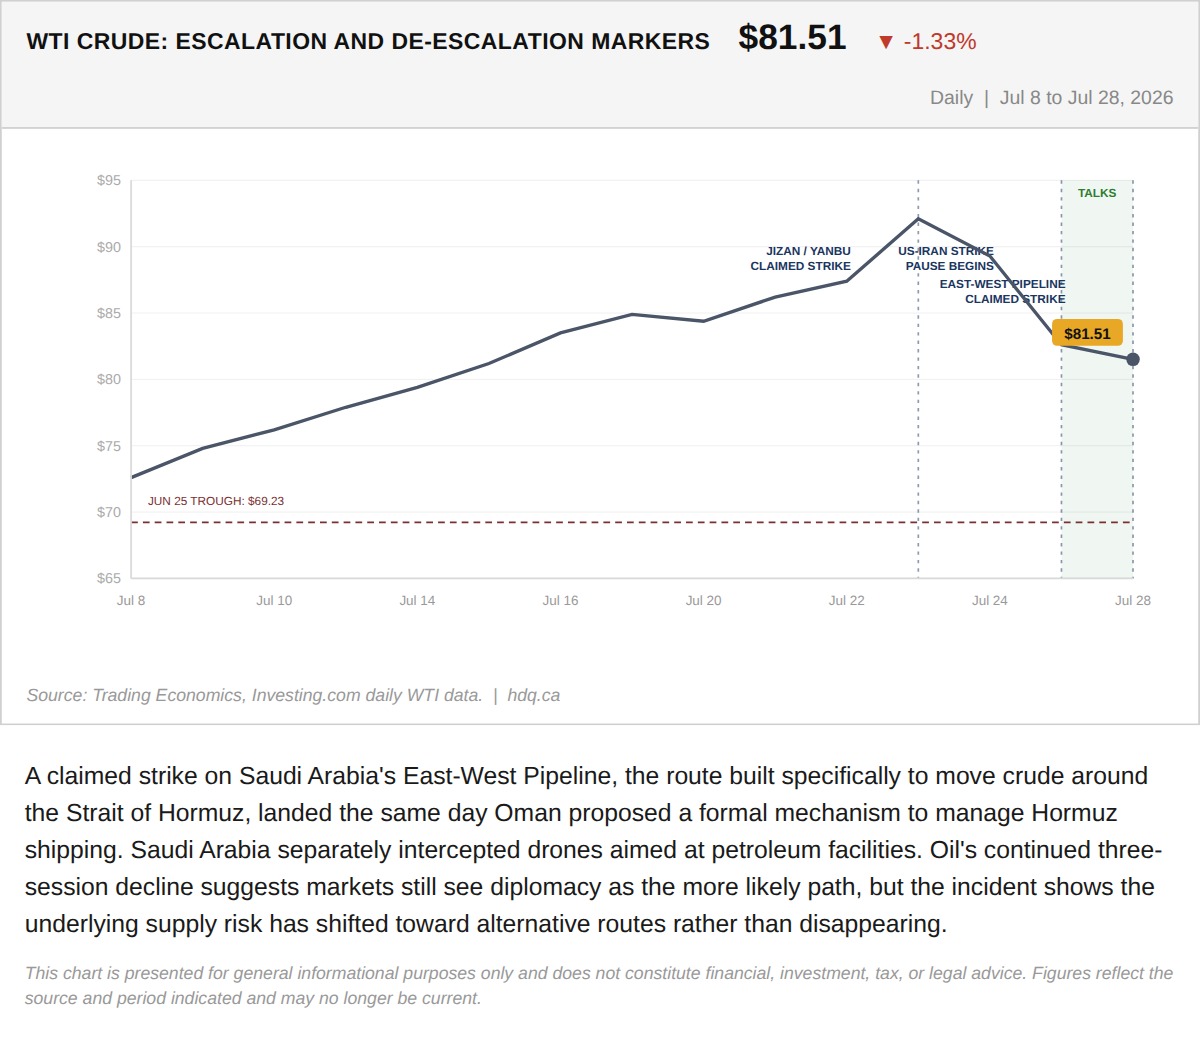
A claimed strike on Saudi Arabia's East-West Pipeline, the route built specifically to move crude around the Strait of Hormuz, landed the…
The Pipeline Built to Bypass Hormuz Risk Just Became a Target
July 28, 2026
View chart & download