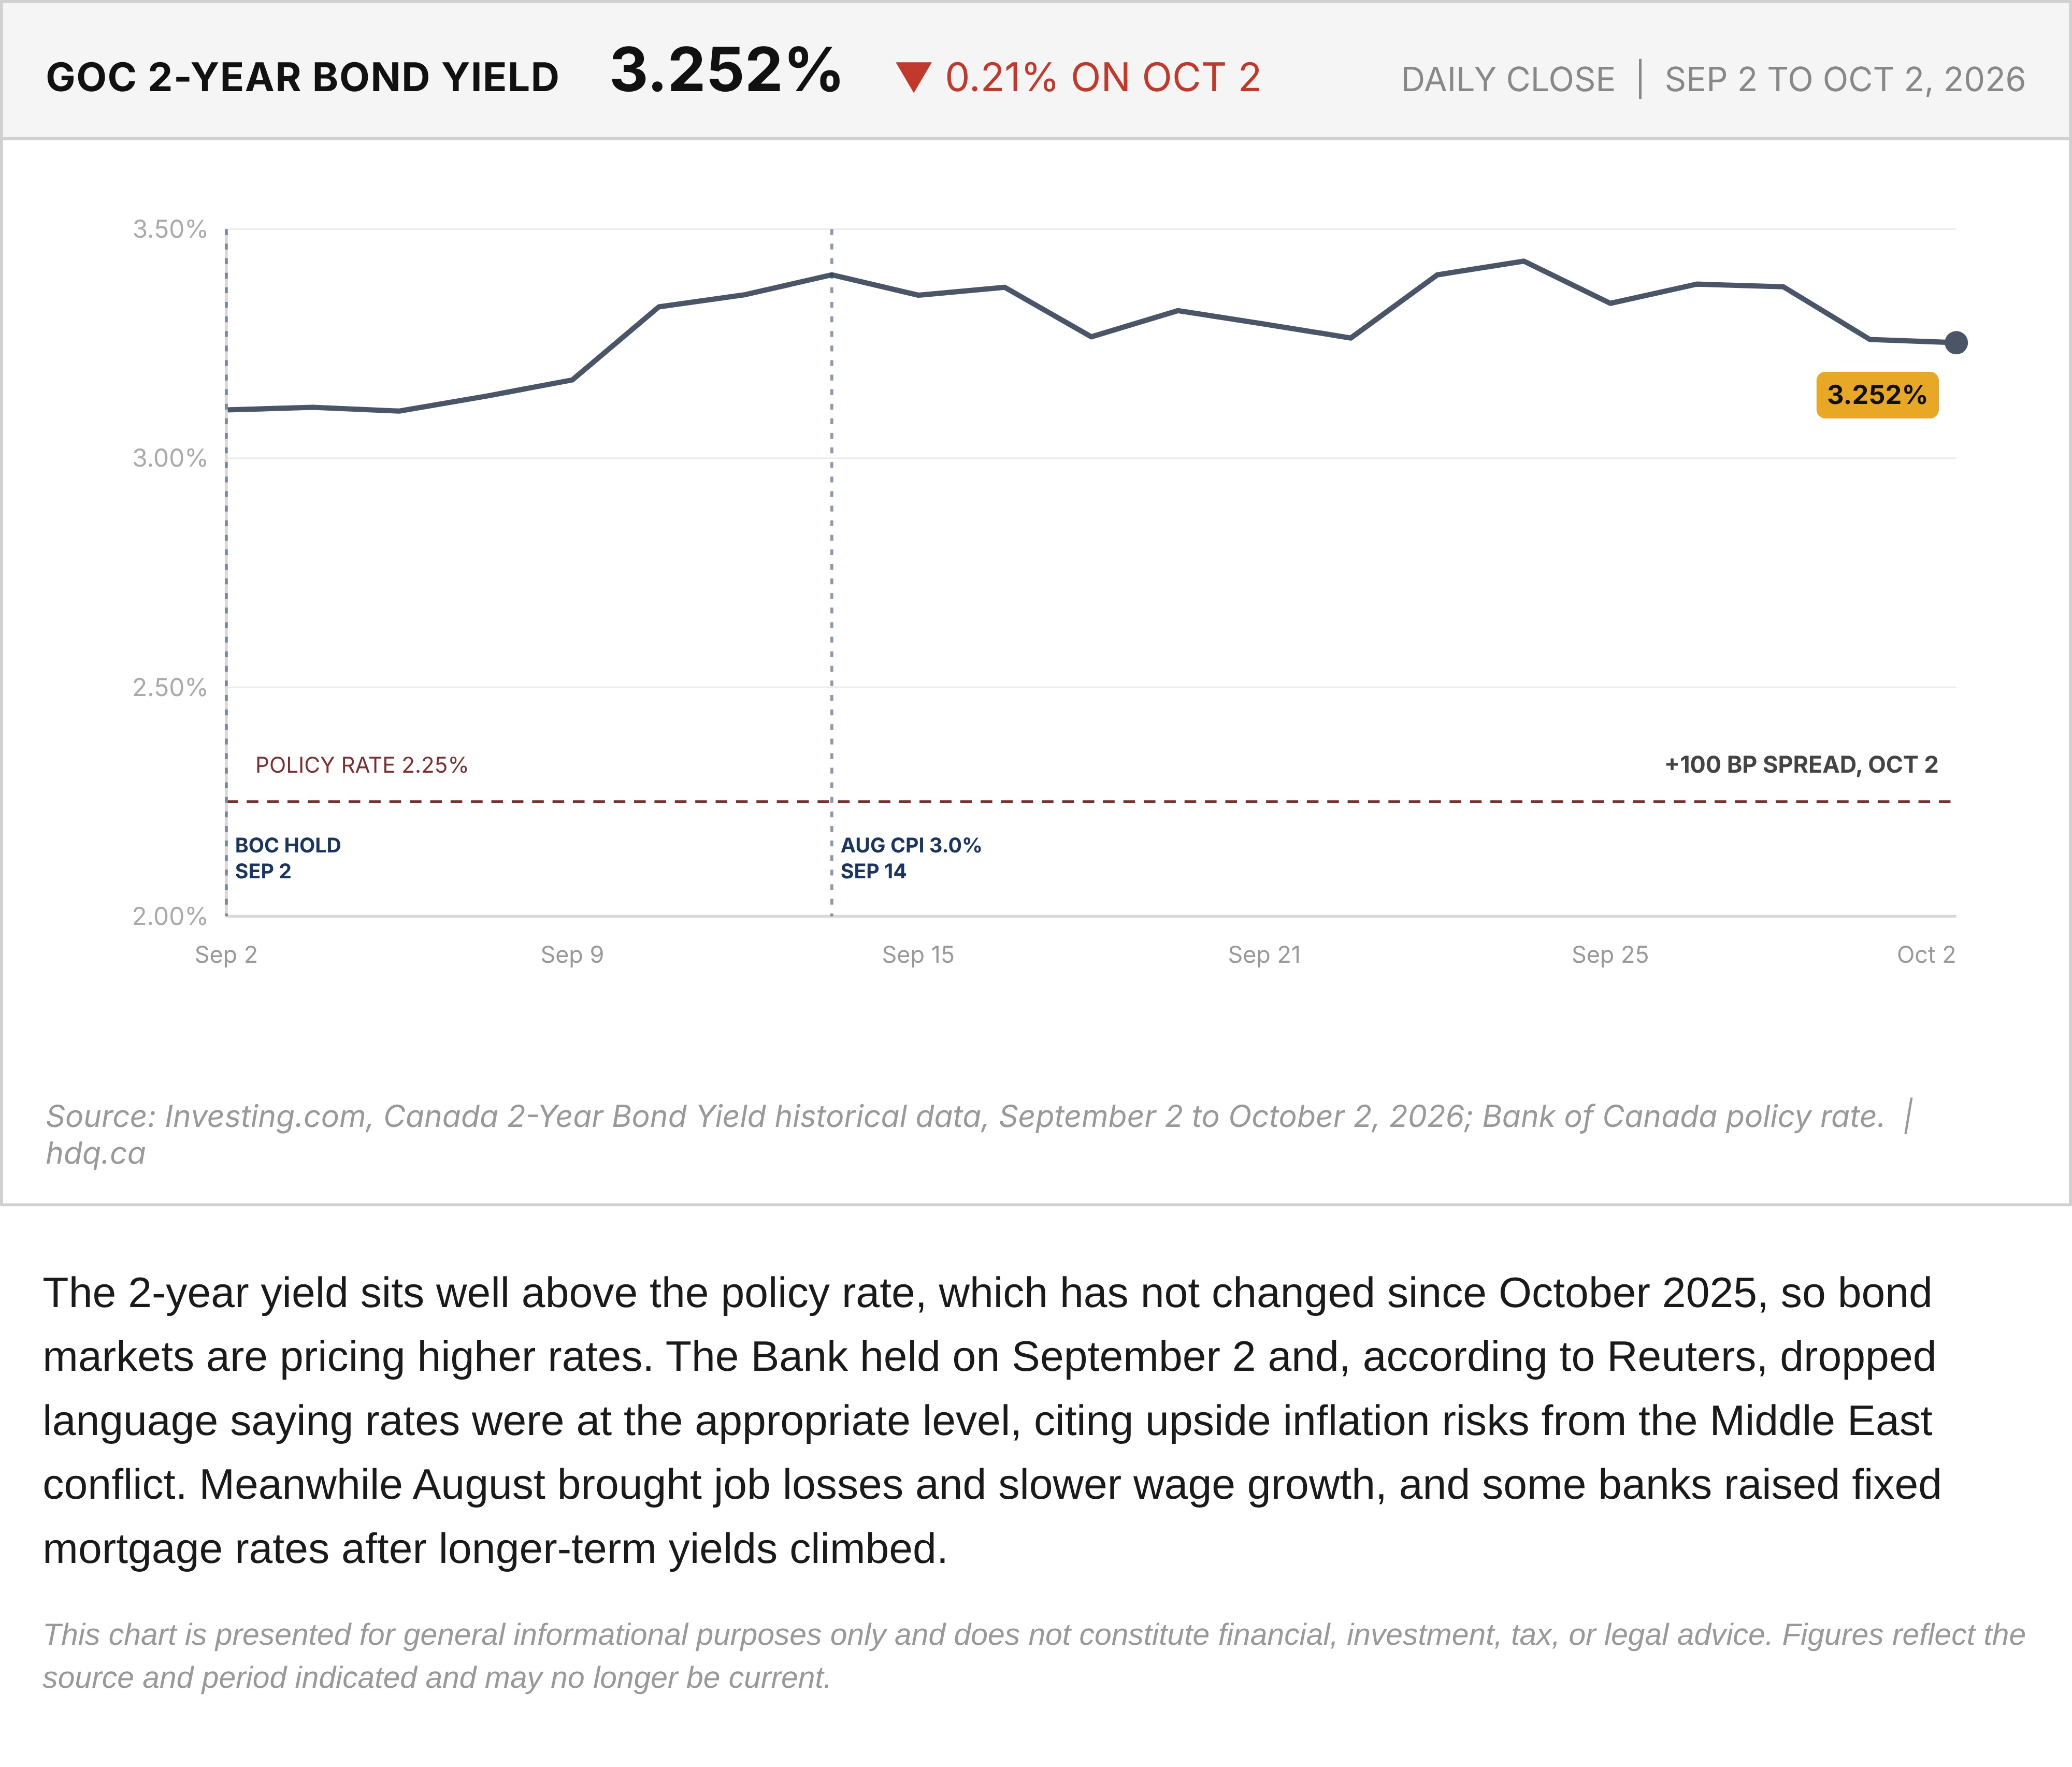
The 2-year yield sits well above the policy rate, which has not changed since October 2025, so bond markets are pricing higher rates. The Bank held on September 2 and, according to Reuters, dropped language saying rates were at the appropriate level, citing upside inflation risks from the Middle East conflict. Meanwhile August brought job losses and slower wage growth, and some banks raised fixed mortgage rates after longer-term yields climbed.
This chart is presented for general informational purposes only and does not constitute financial, investment, tax, or legal advice. Figures reflect the source and period indicated and may no longer be current.
Related charts
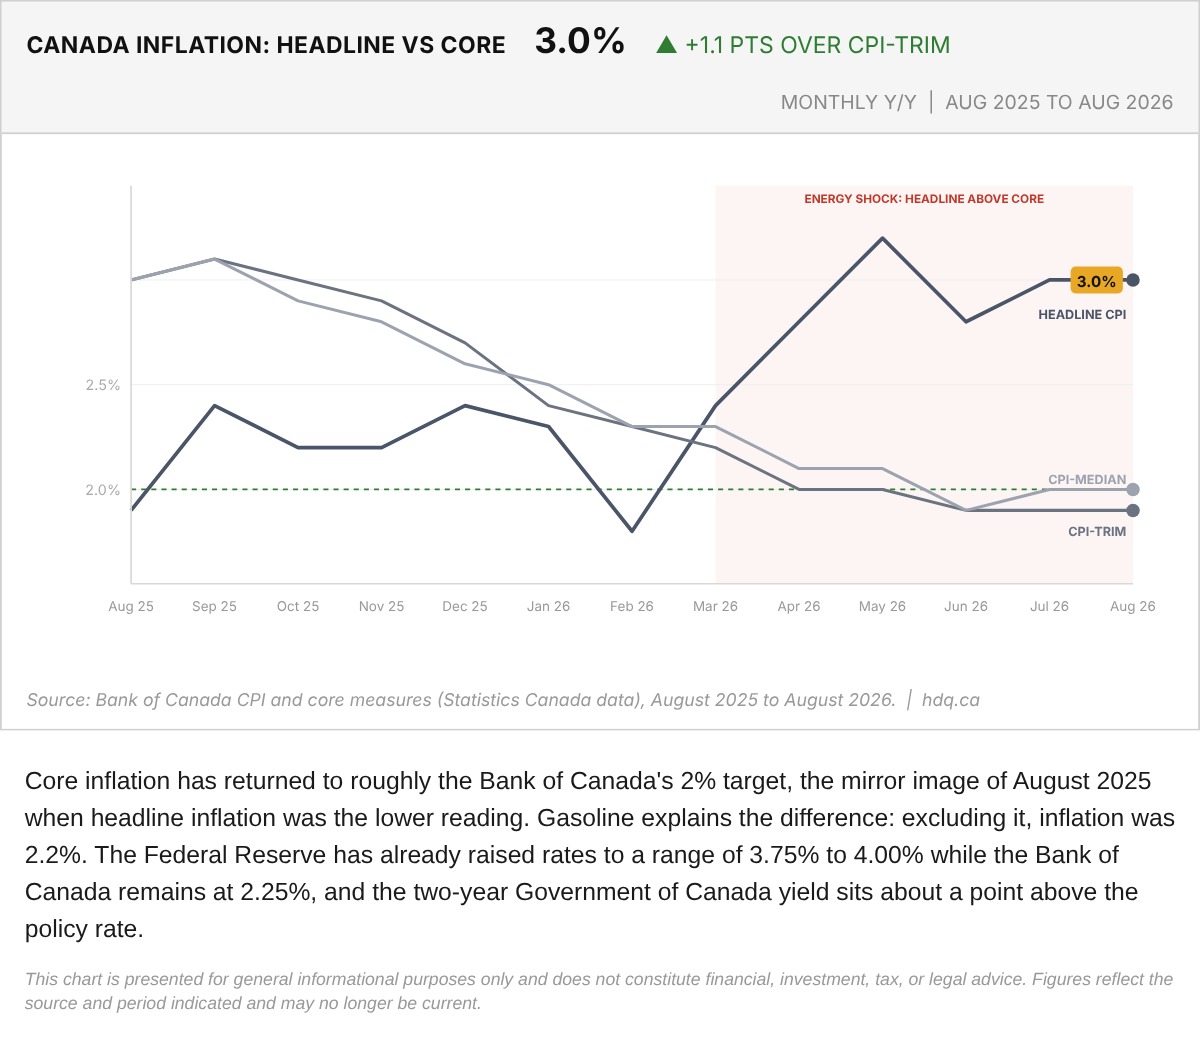
Core inflation has returned to roughly the Bank of Canada's 2% target, the mirror image of August 2025 when headline inflation was the lower reading.
Canada Headline CPI and Core Inflation Against the 2% Target
October 8, 2026
View chart & download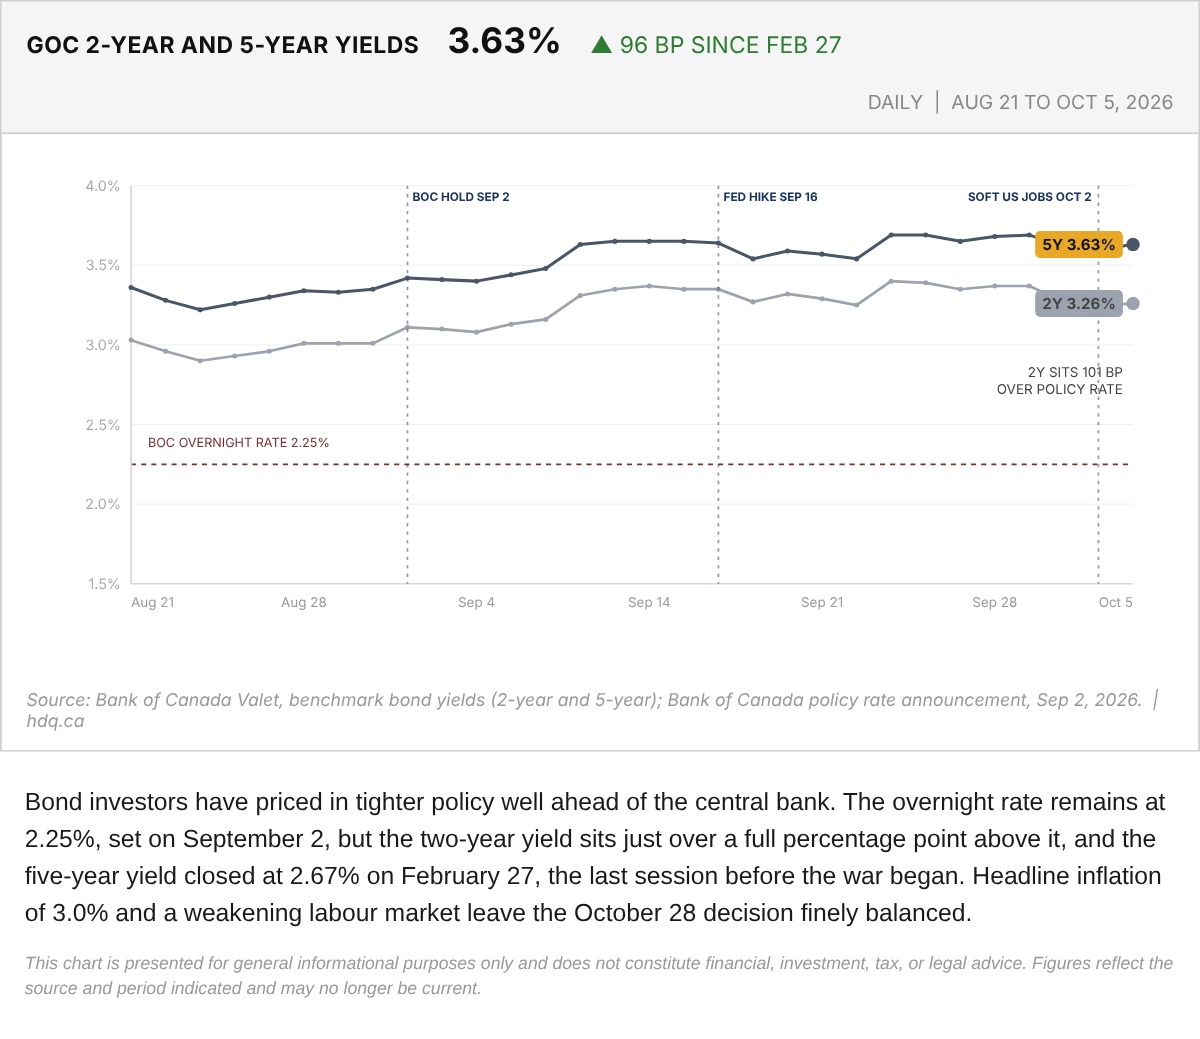
Bond investors have priced in tighter policy well ahead of the central bank.
Government of Canada 2-Year and 5-Year Yields Since the Pre-War Close
October 7, 2026
View chart & download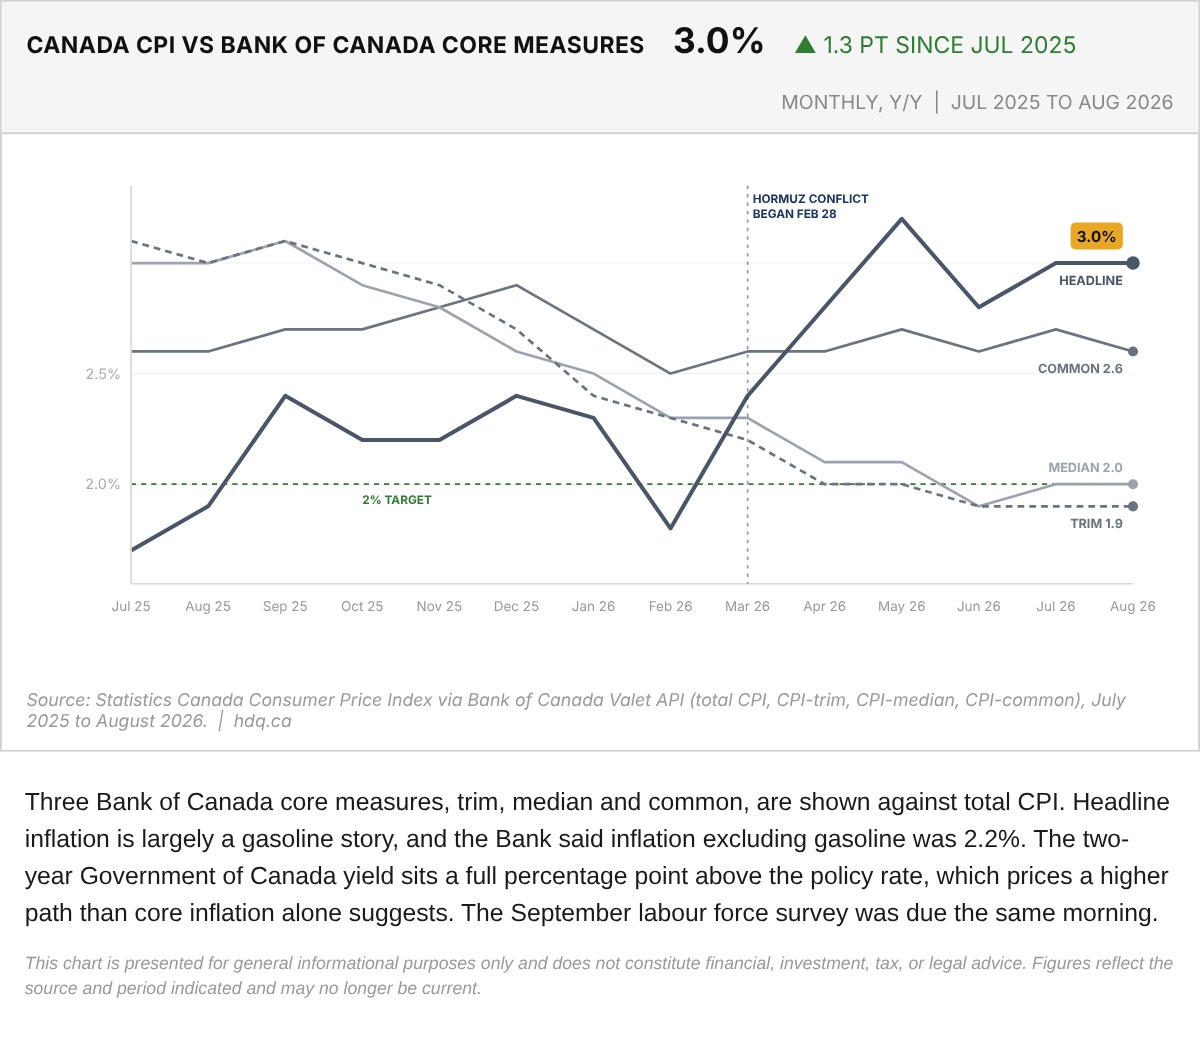
Three Bank of Canada core measures, trim, median and common, are shown against total CPI.
Canada CPI Against Bank of Canada Core Measures, July 2025 to August 2026
October 9, 2026
View chart & download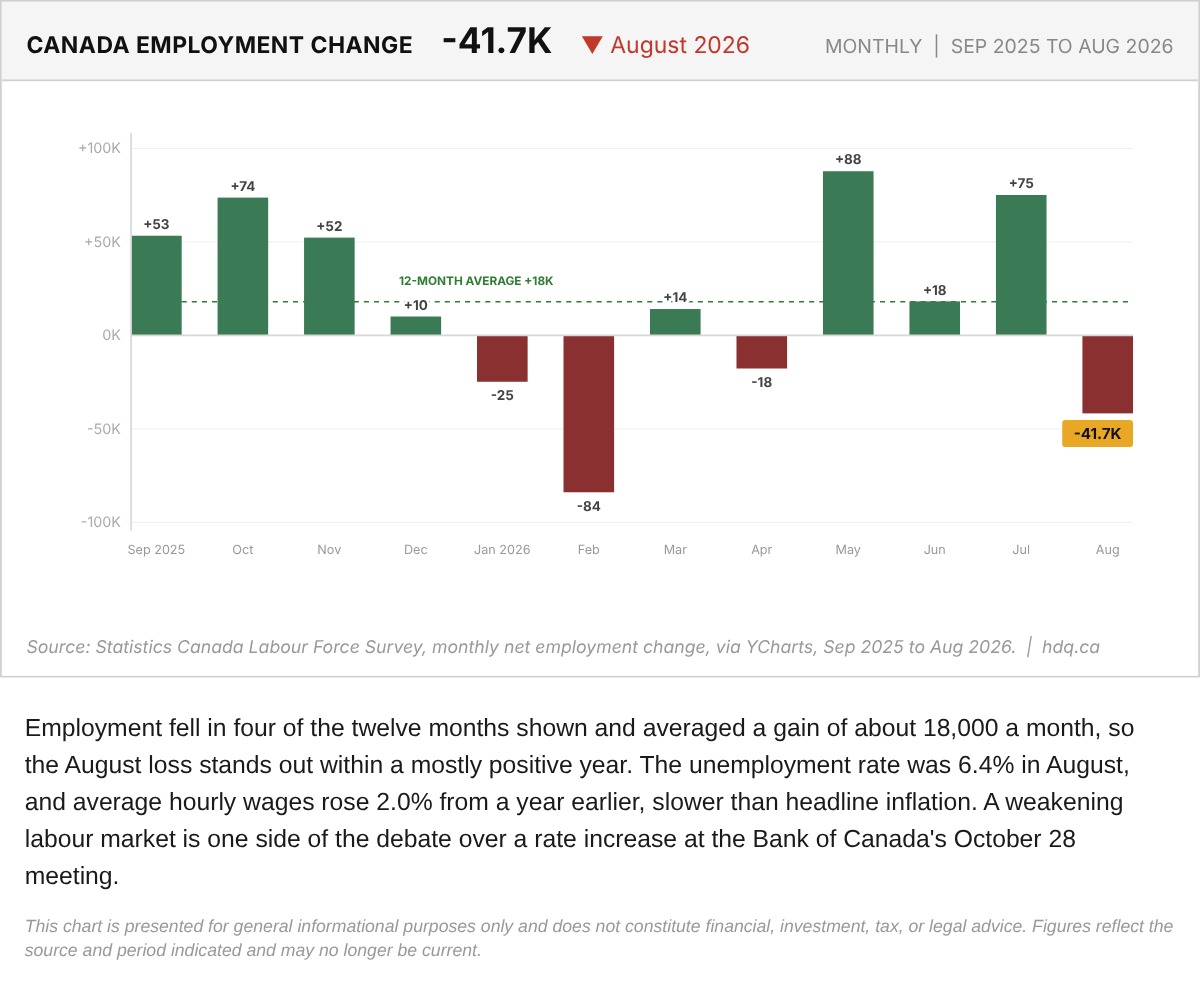
Employment fell in four of the twelve months shown and averaged a gain of about 18,000 a month, so the August loss stands out within a mostly positive year.
Canada Monthly Net Employment Change, September 2025 to August 2026
October 6, 2026
View chart & download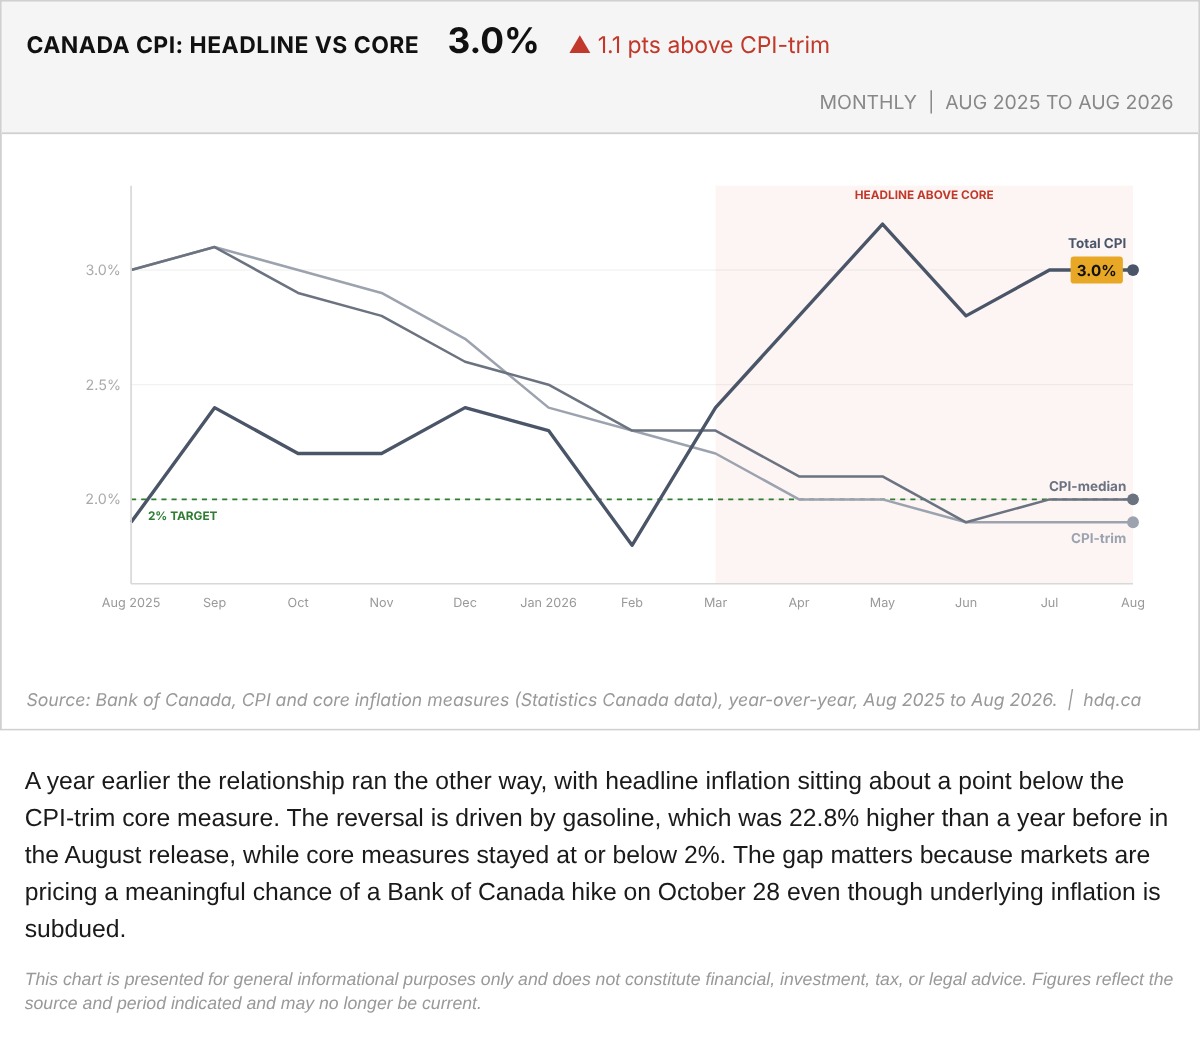
A year earlier the relationship ran the other way, with headline inflation sitting about a point below the CPI-trim core measure.
Canada Headline CPI Against Bank of Canada Core Measures, August 2026
October 6, 2026
View chart & download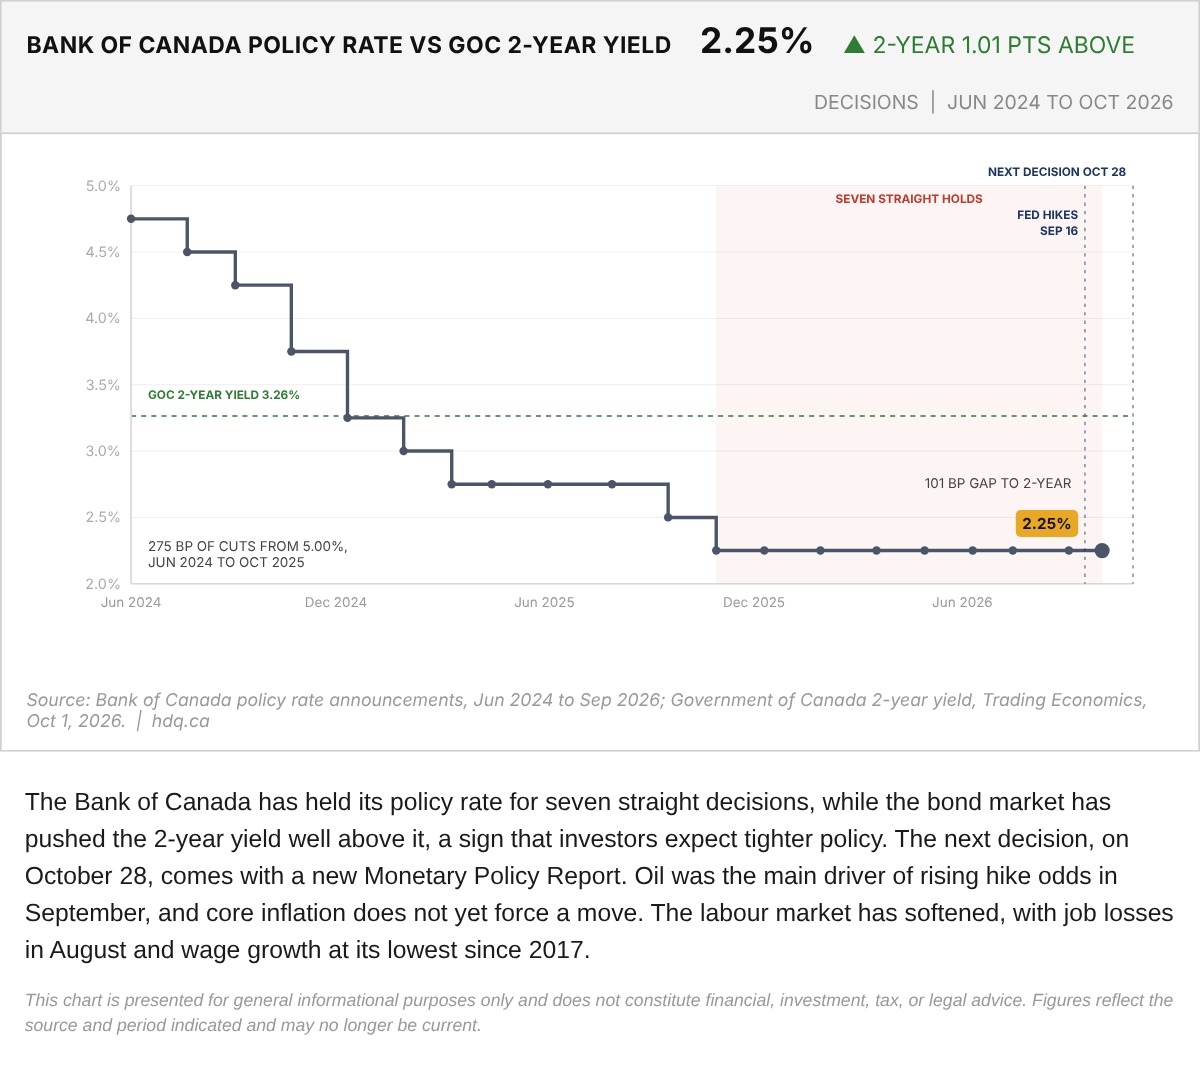
The Bank of Canada has held its policy rate for seven straight decisions, while the bond market has pushed the 2-year yield well above it,…
Bank of Canada Policy Rate Versus the Government of Canada 2-Year Yield, June 2024 to October 2026
October 2, 2026
View chart & download