Browse the full archive by month →
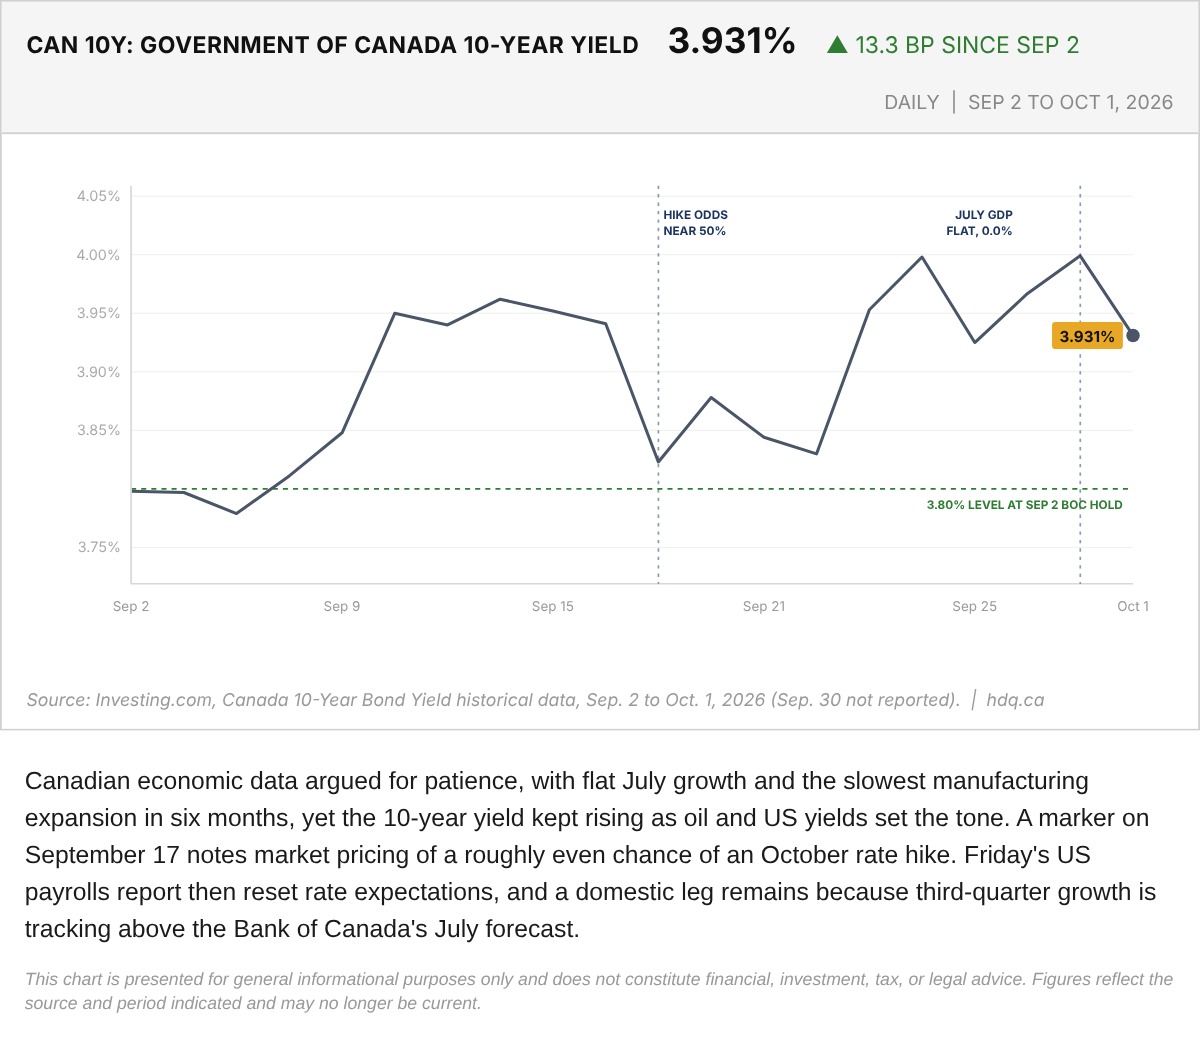
Canadian economic data argued for patience, with flat July growth and the slowest manufacturing expansion in six months, yet the 10-year…
Government of Canada 10-Year Bond Yield, September 2 to October 1, 2026
October 3, 2026
View chart & download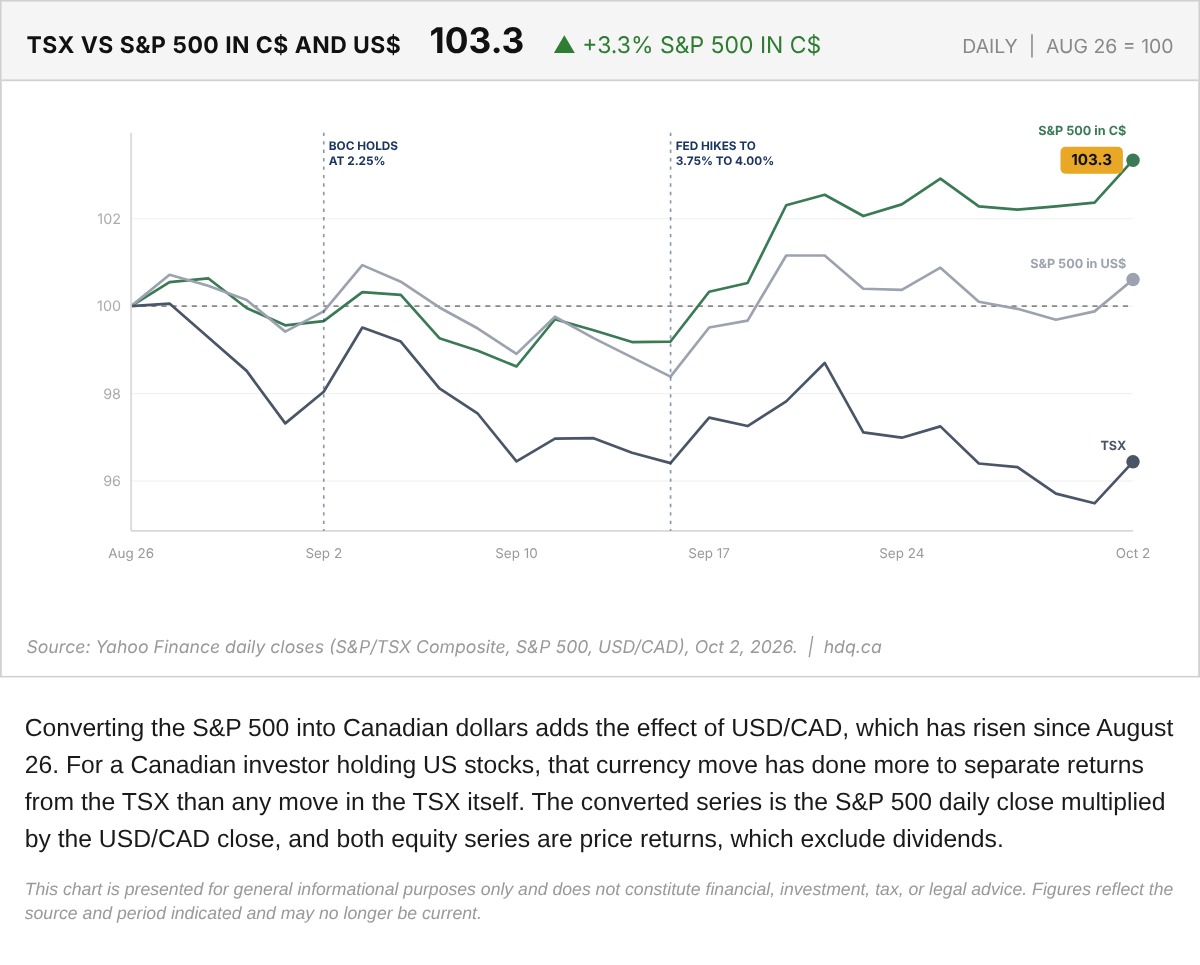
Converting the S&P 500 into Canadian dollars adds the effect of USD/CAD, which has risen since August 26.
TSX Versus S&P 500 in Canadian and US Dollars, Indexed to August 26, 2026
October 2, 2026
View chart & download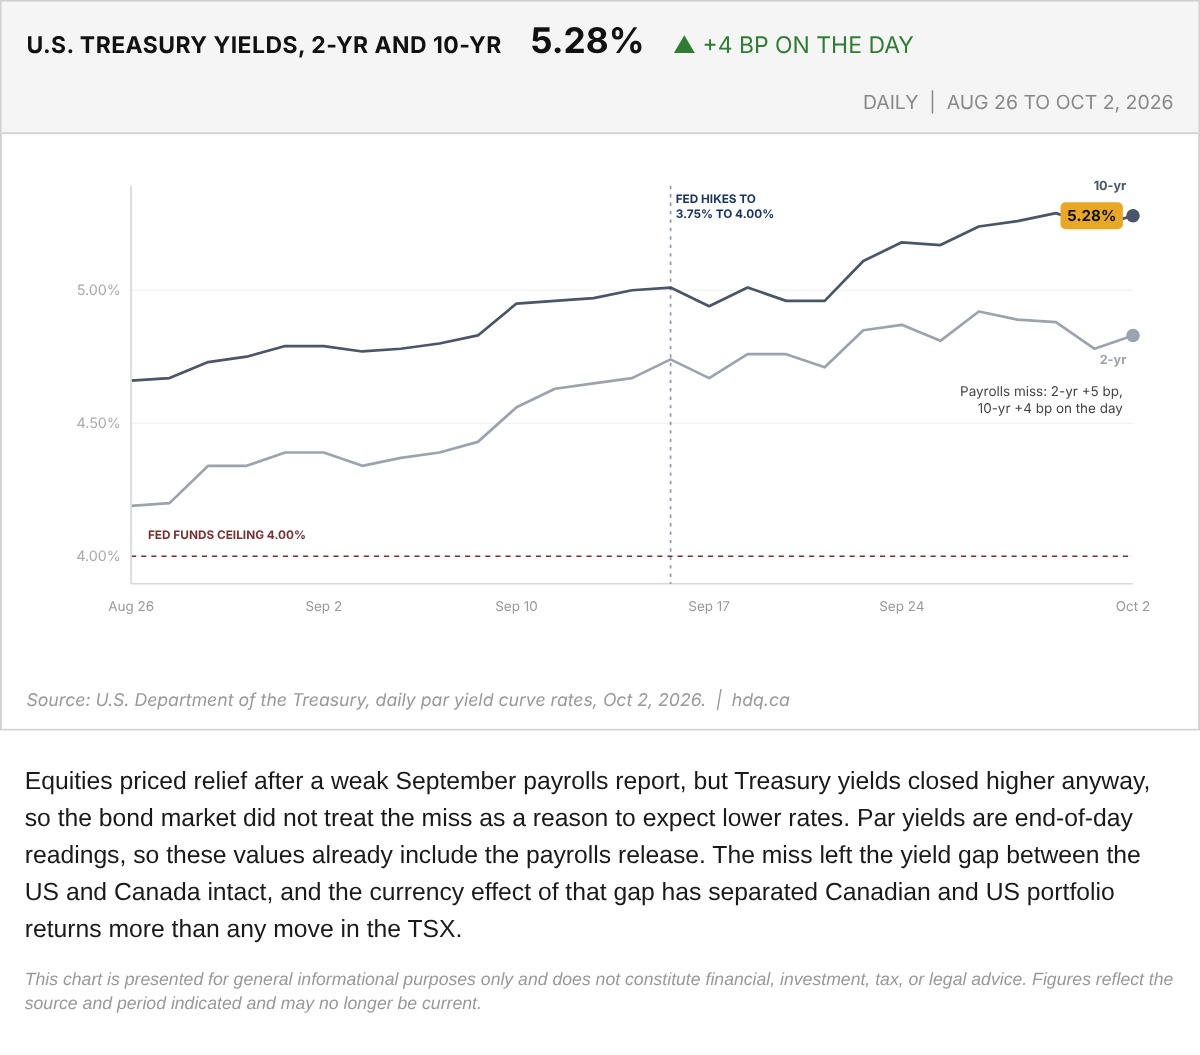
Equities priced relief after a weak September payrolls report, but Treasury yields closed higher anyway, so the bond market did not treat the miss as a reason to expect lower rates.
US Treasury Par Yields: 2-Year and 10-Year, August 26 to October 2, 2026
October 2, 2026
View chart & download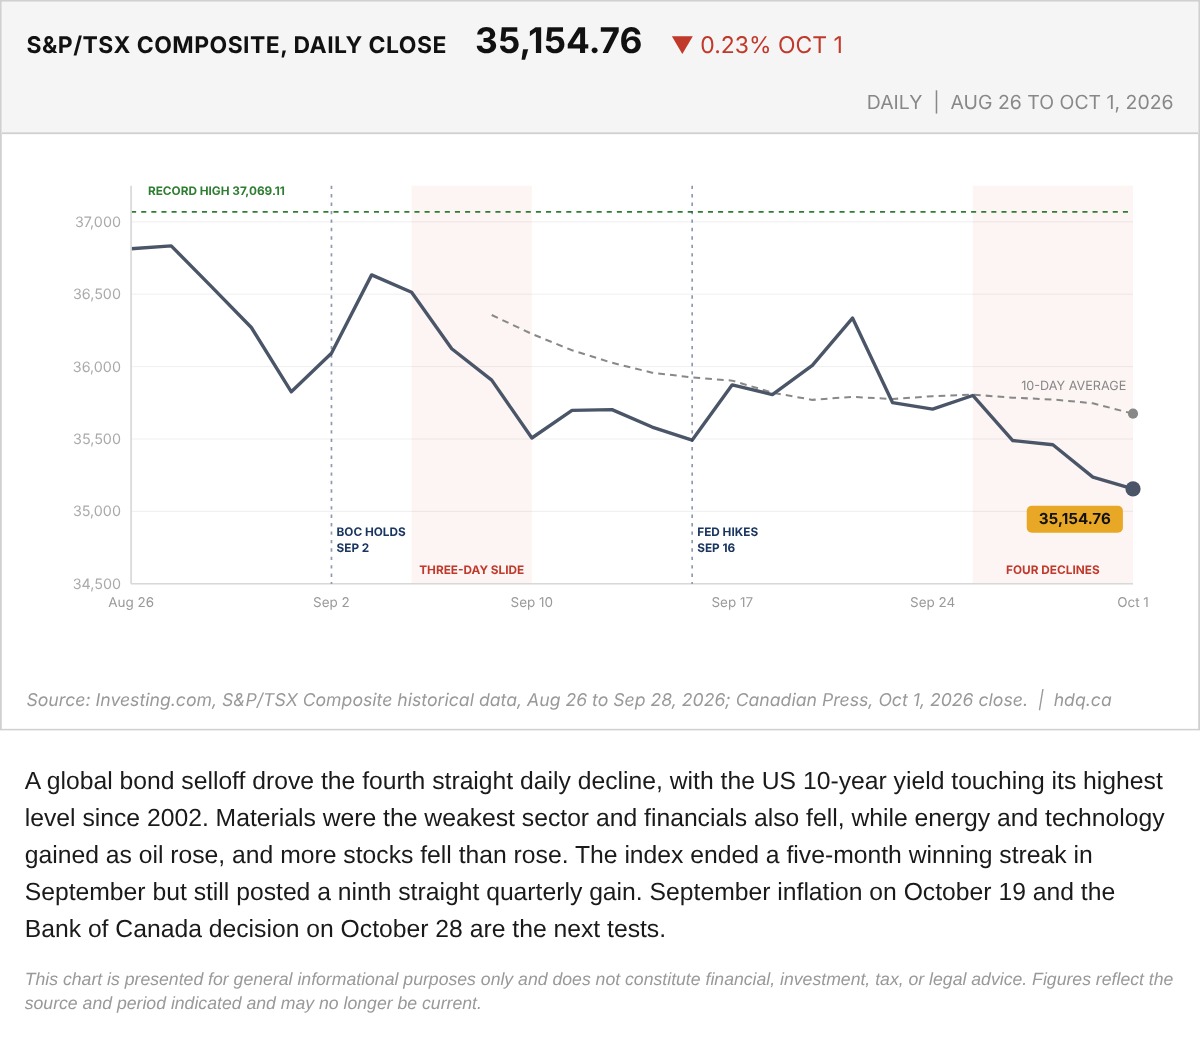
A global bond selloff drove the fourth straight daily decline, with the US 10-year yield touching its highest level since 2002.
S&P/TSX Composite Daily Close, August 26 to October 1, 2026
October 2, 2026
View chart & download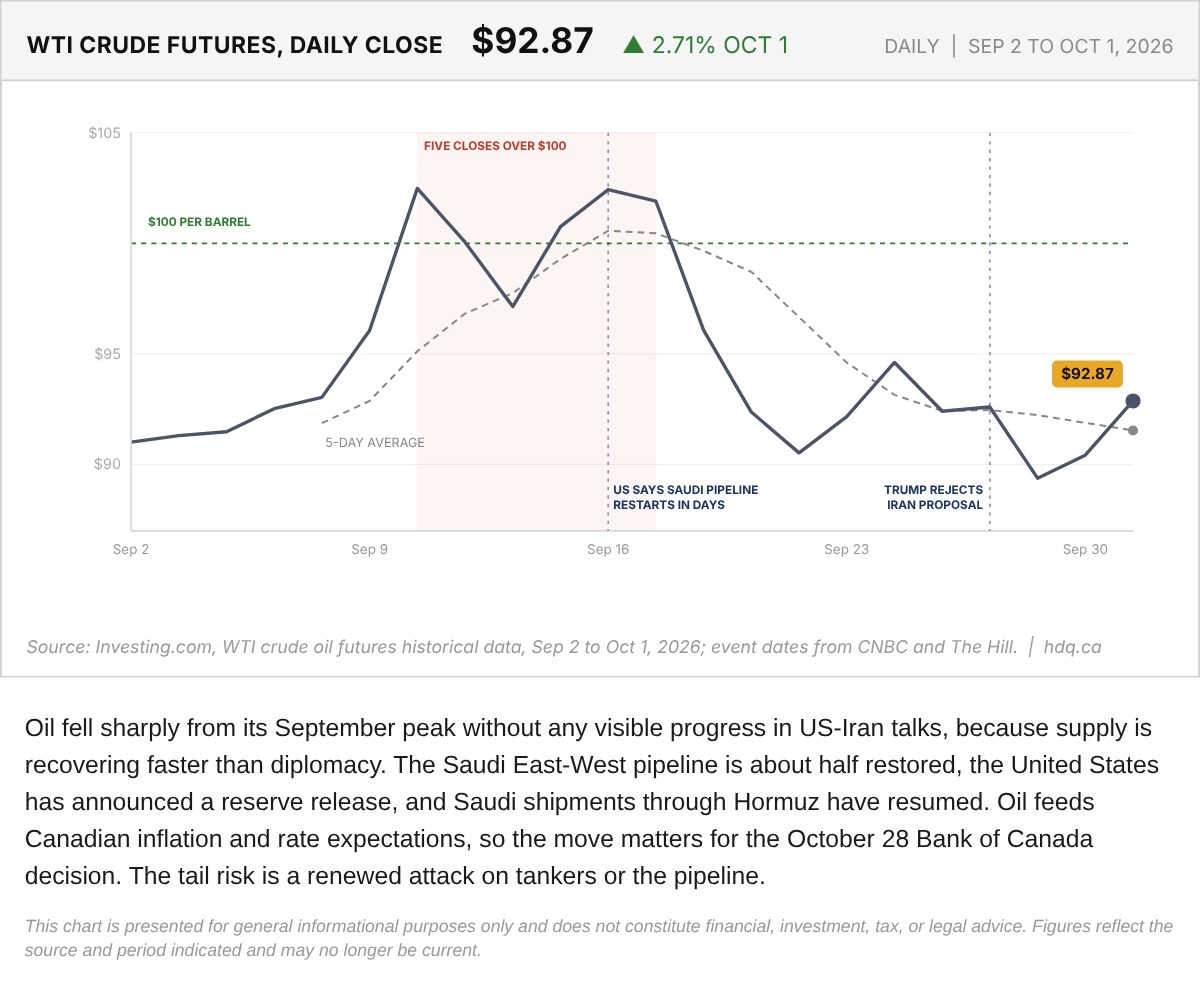
Oil fell sharply from its September peak without any visible progress in US-Iran talks, because supply is recovering faster than diplomacy.
WTI Crude Oil Futures Daily Close, September 2 to October 1, 2026
October 2, 2026
View chart & download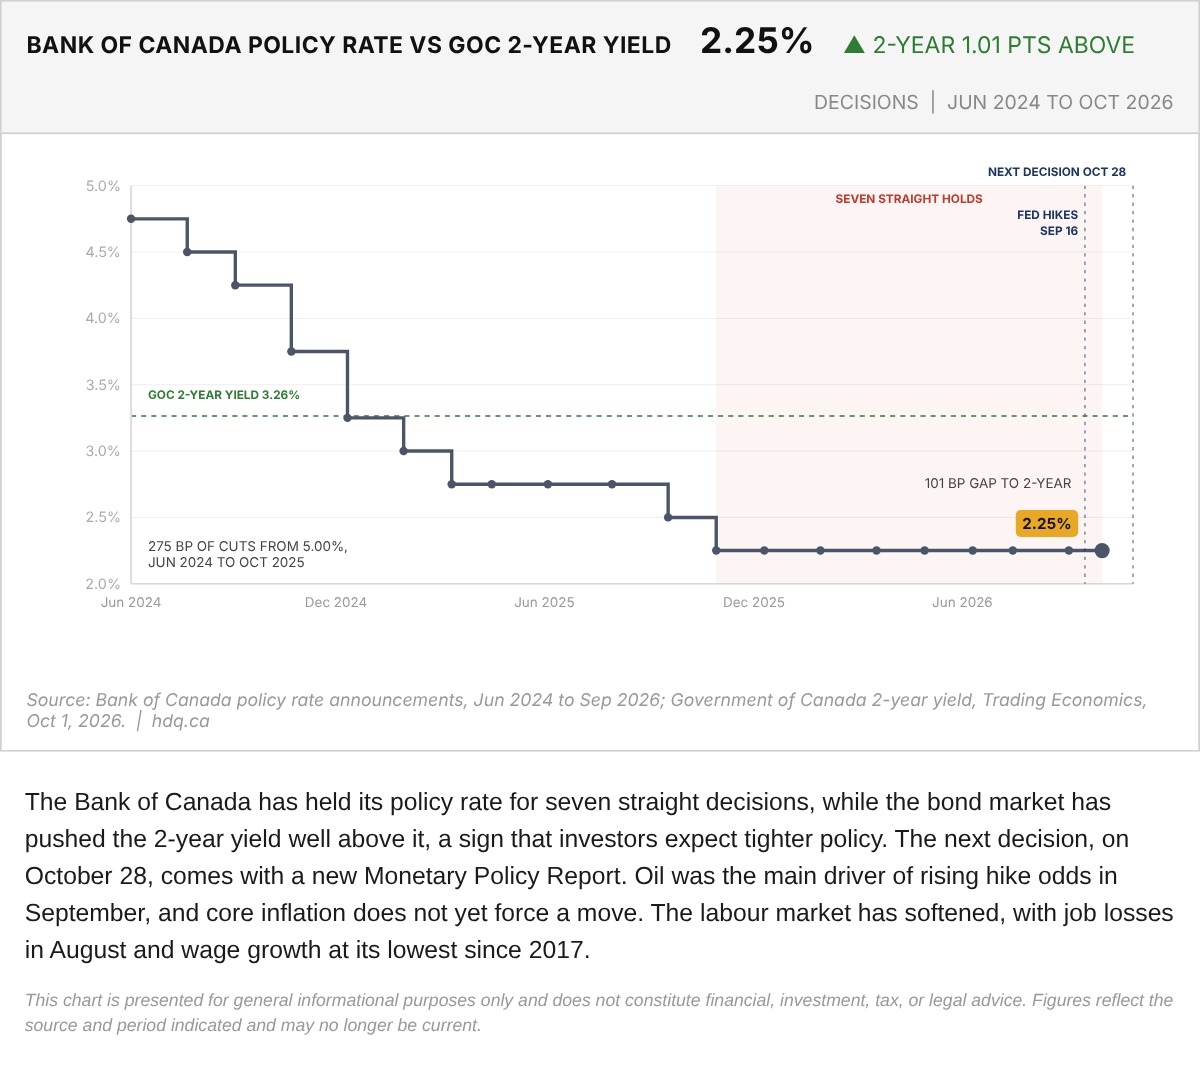
The Bank of Canada has held its policy rate for seven straight decisions, while the bond market has pushed the 2-year yield well above it,…
Bank of Canada Policy Rate Versus the Government of Canada 2-Year Yield, June 2024 to October 2026
October 2, 2026
View chart & download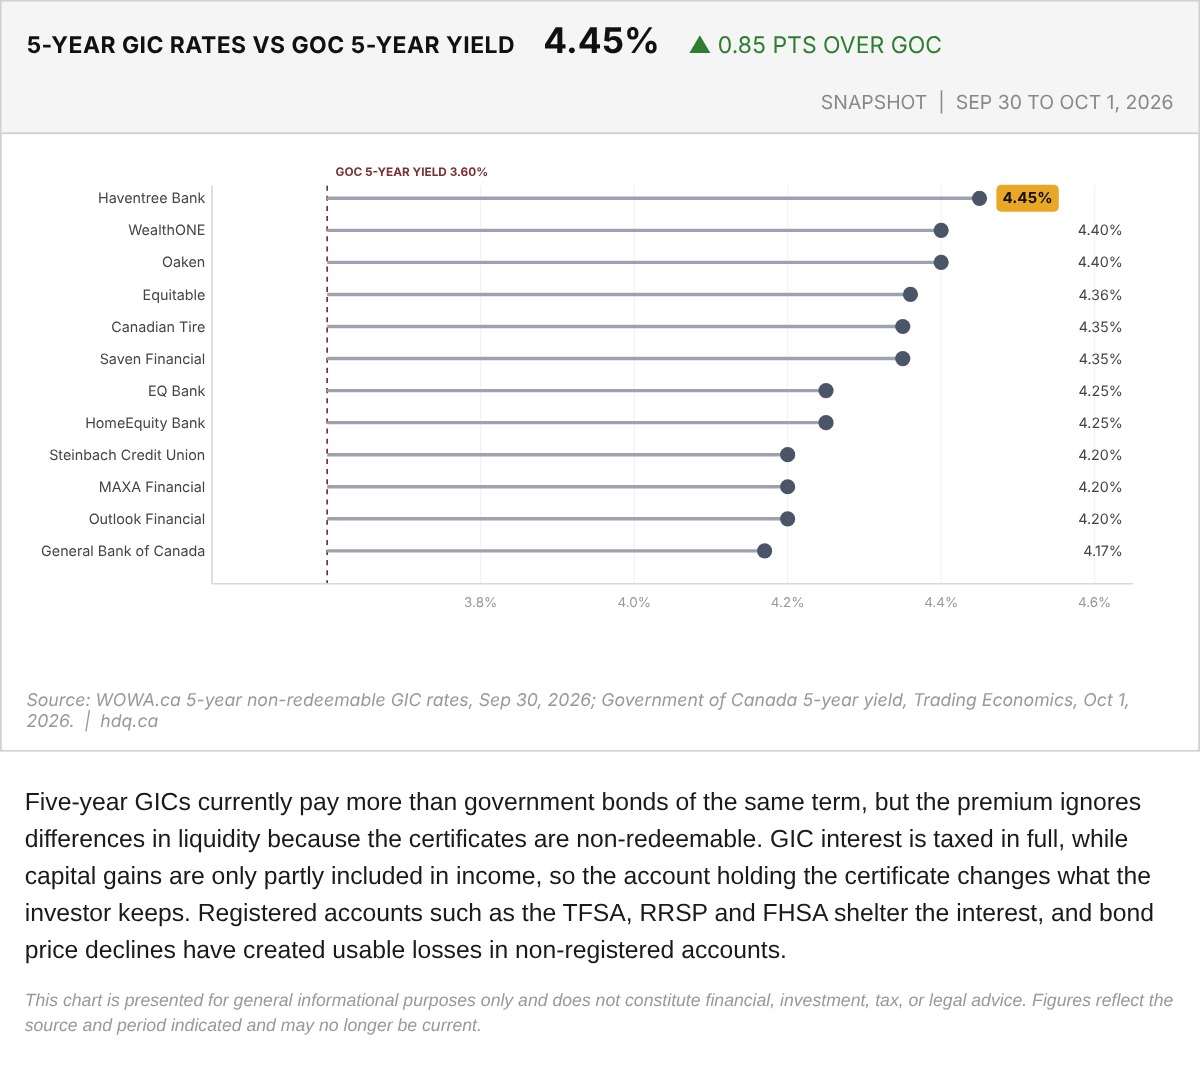
Five-year GICs currently pay more than government bonds of the same term, but the premium ignores differences in liquidity because the certificates are non-redeemable.
Five-Year GIC Rates Versus the Government of Canada 5-Year Yield, September 30 to October 1, 2026
October 2, 2026
View chart & download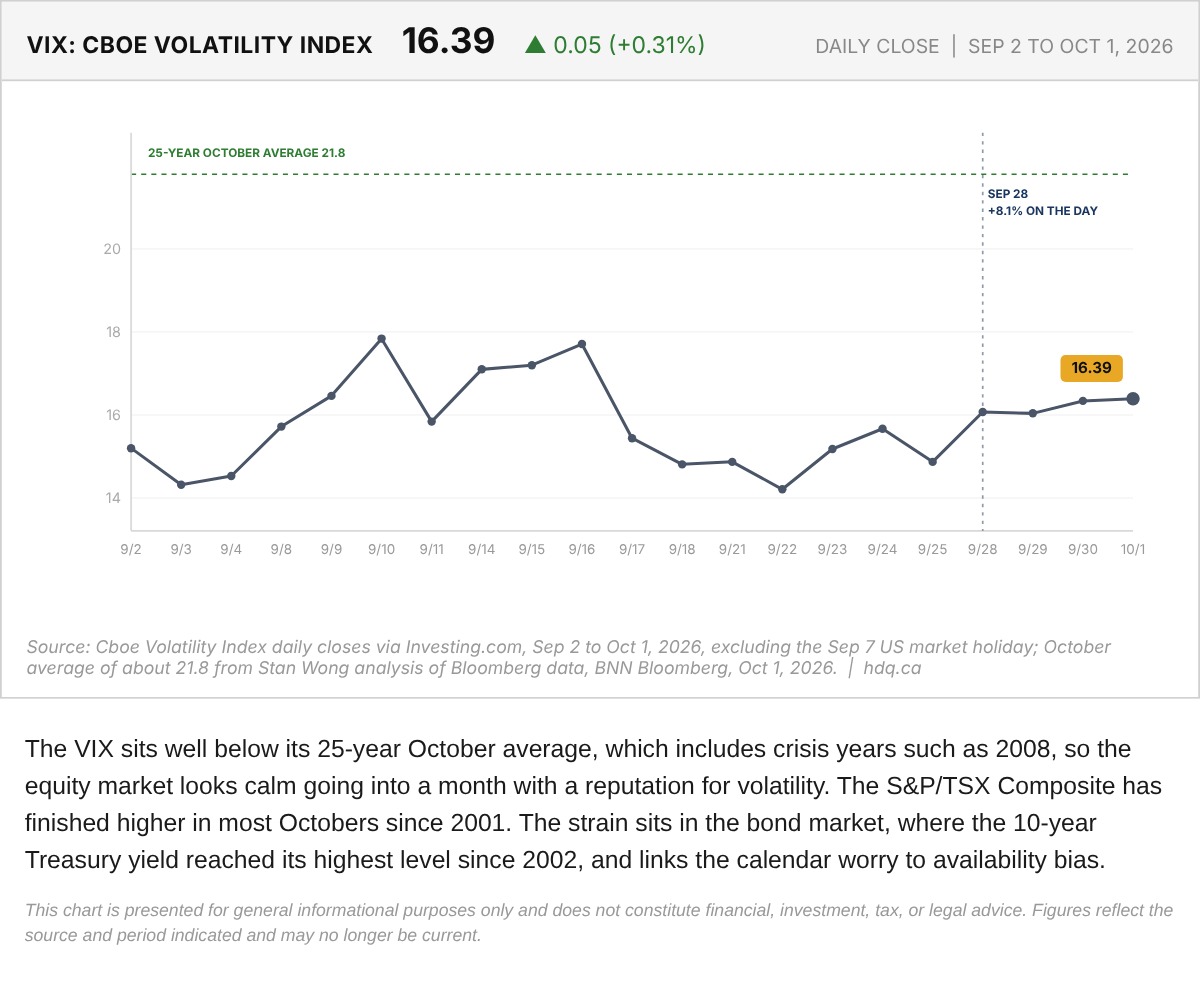
The VIX sits well below its 25-year October average, which includes crisis years such as 2008, so the equity market looks calm going into a month with a reputation for volatility.
Cboe Volatility Index (VIX) and the October Average, September 2 to October 1, 2026
October 2, 2026
View chart & download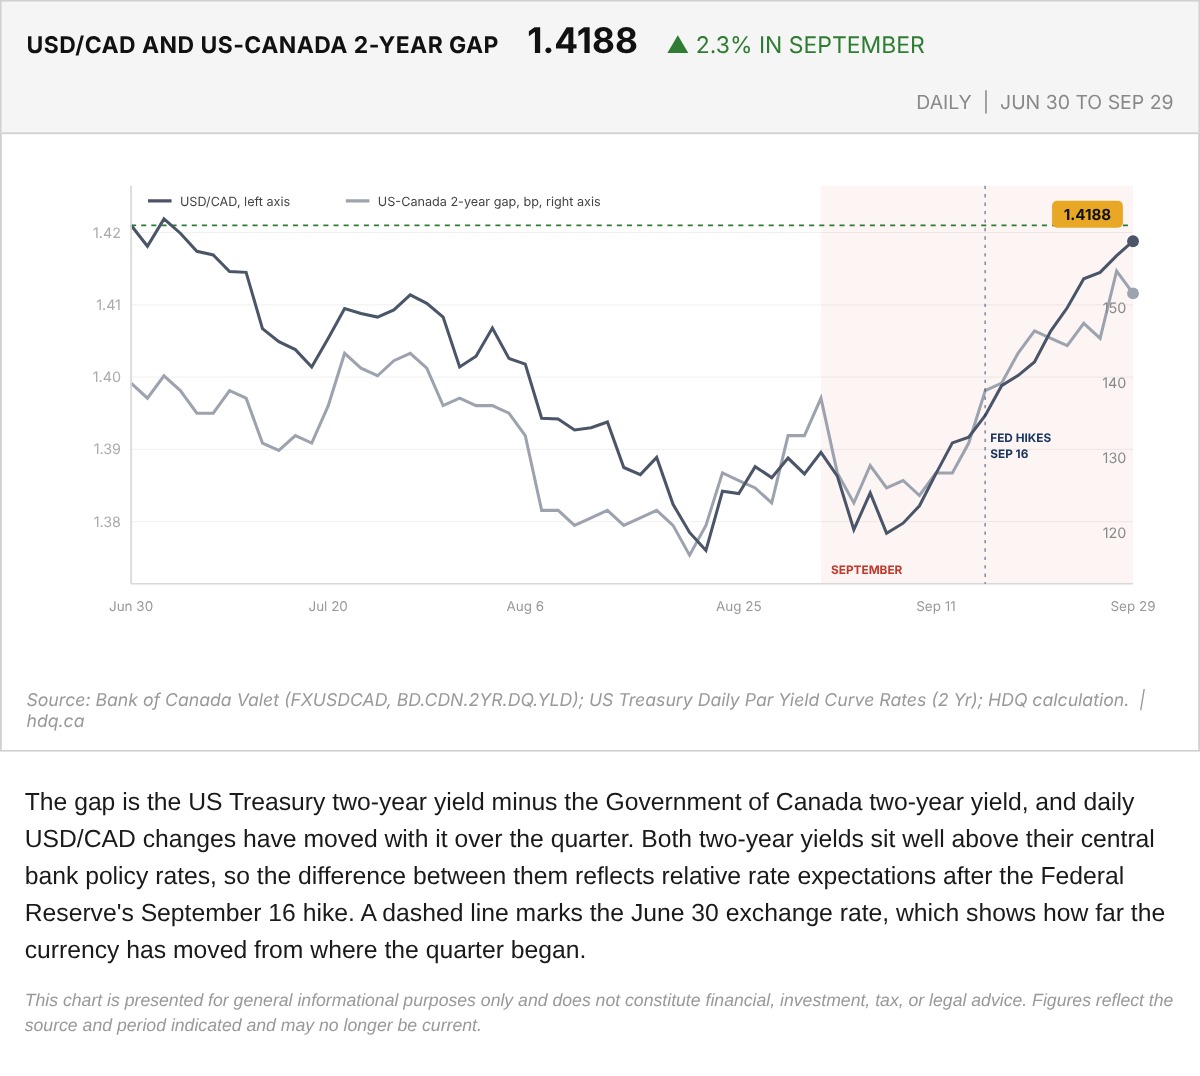
The gap is the US Treasury two-year yield minus the Government of Canada two-year yield, and daily USD/CAD changes have moved with it over the quarter.
USD/CAD and the US-Canada Two-Year Yield Gap, June 30 to September 29, 2026
October 1, 2026
View chart & download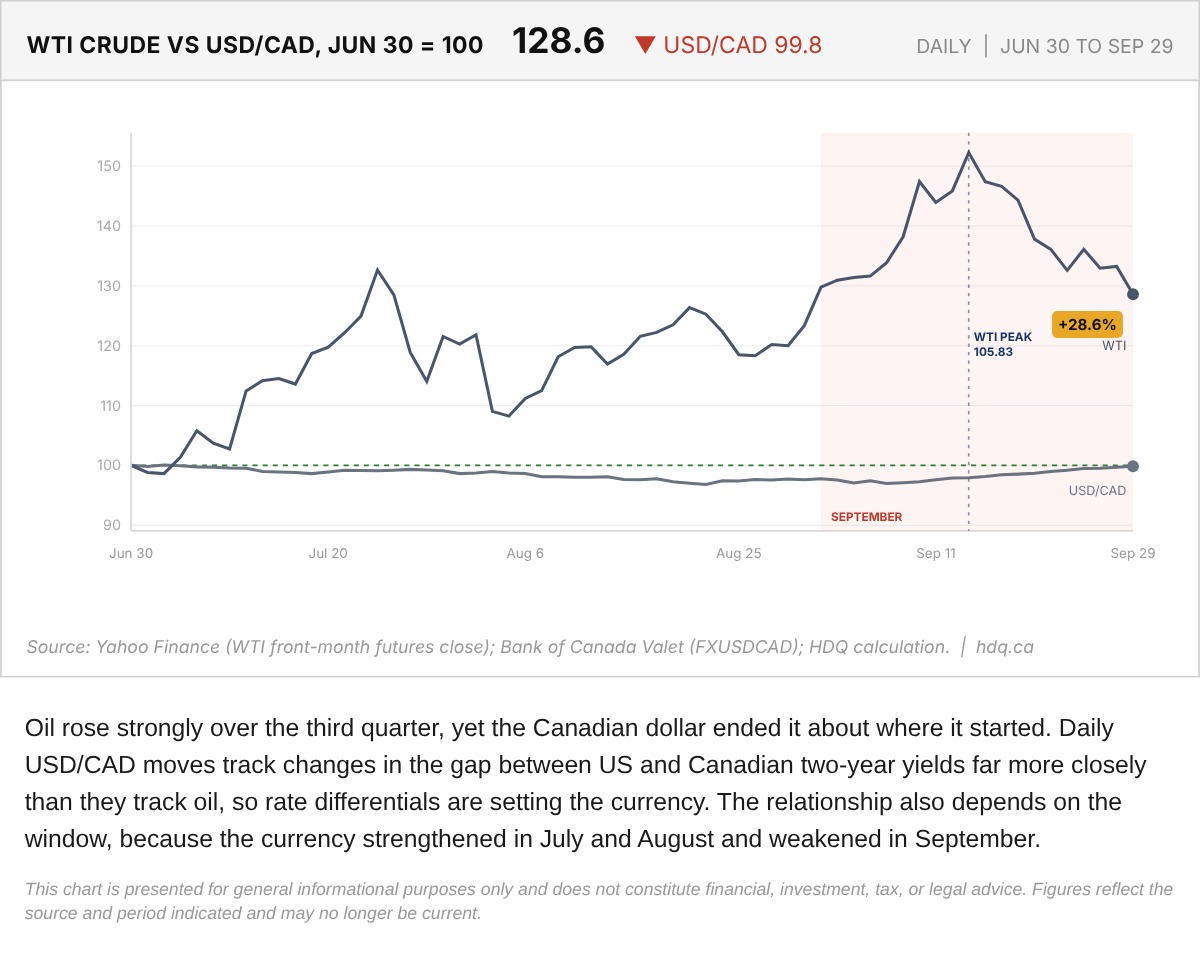
Oil rose strongly over the third quarter, yet the Canadian dollar ended it about where it started.
WTI Crude Oil and USD/CAD Indexed to June 30, 2026
October 1, 2026
View chart & download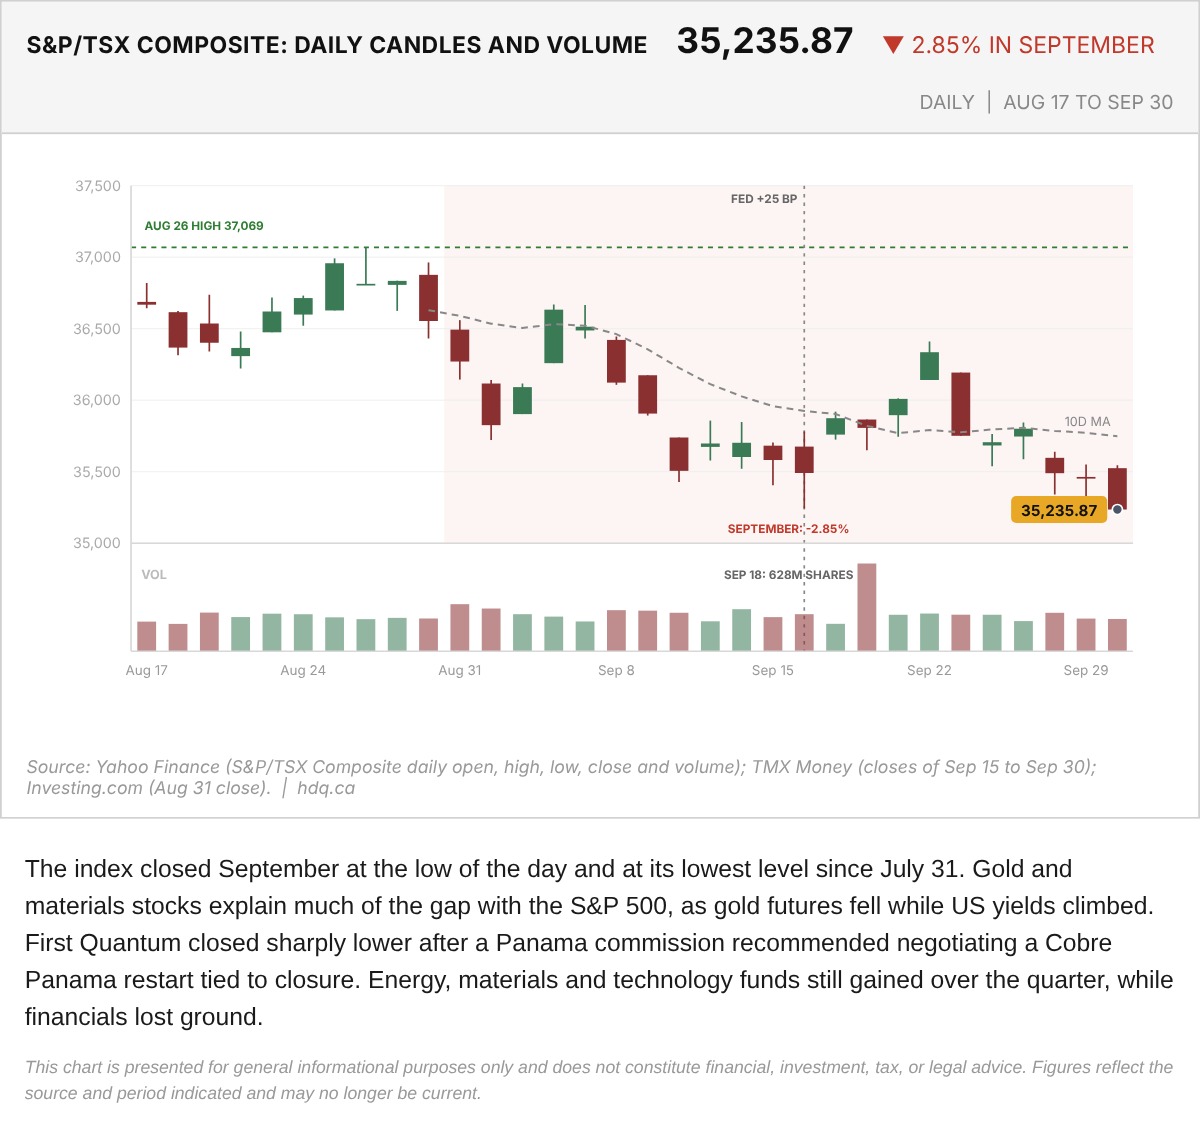
The index closed September at the low of the day and at its lowest level since July 31.
S&P/TSX Composite Daily Candles and Volume, August 17 to September 30, 2026
October 1, 2026
View chart & download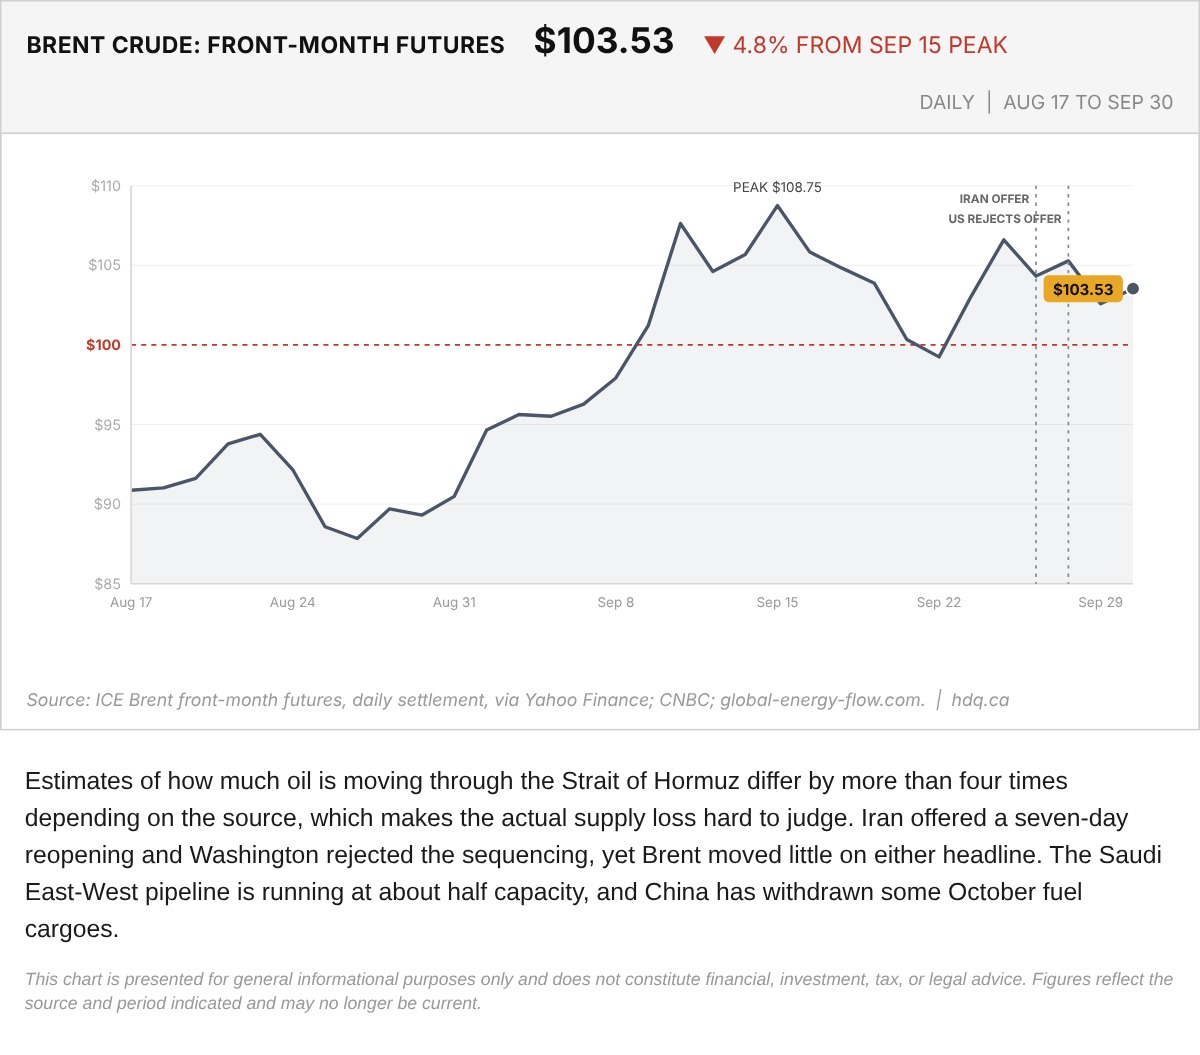
Estimates of how much oil is moving through the Strait of Hormuz differ by more than four times depending on the source, which makes the actual supply loss hard to judge.
Brent Crude Front-Month Futures, August 17 to September 30, 2026
October 1, 2026
View chart & download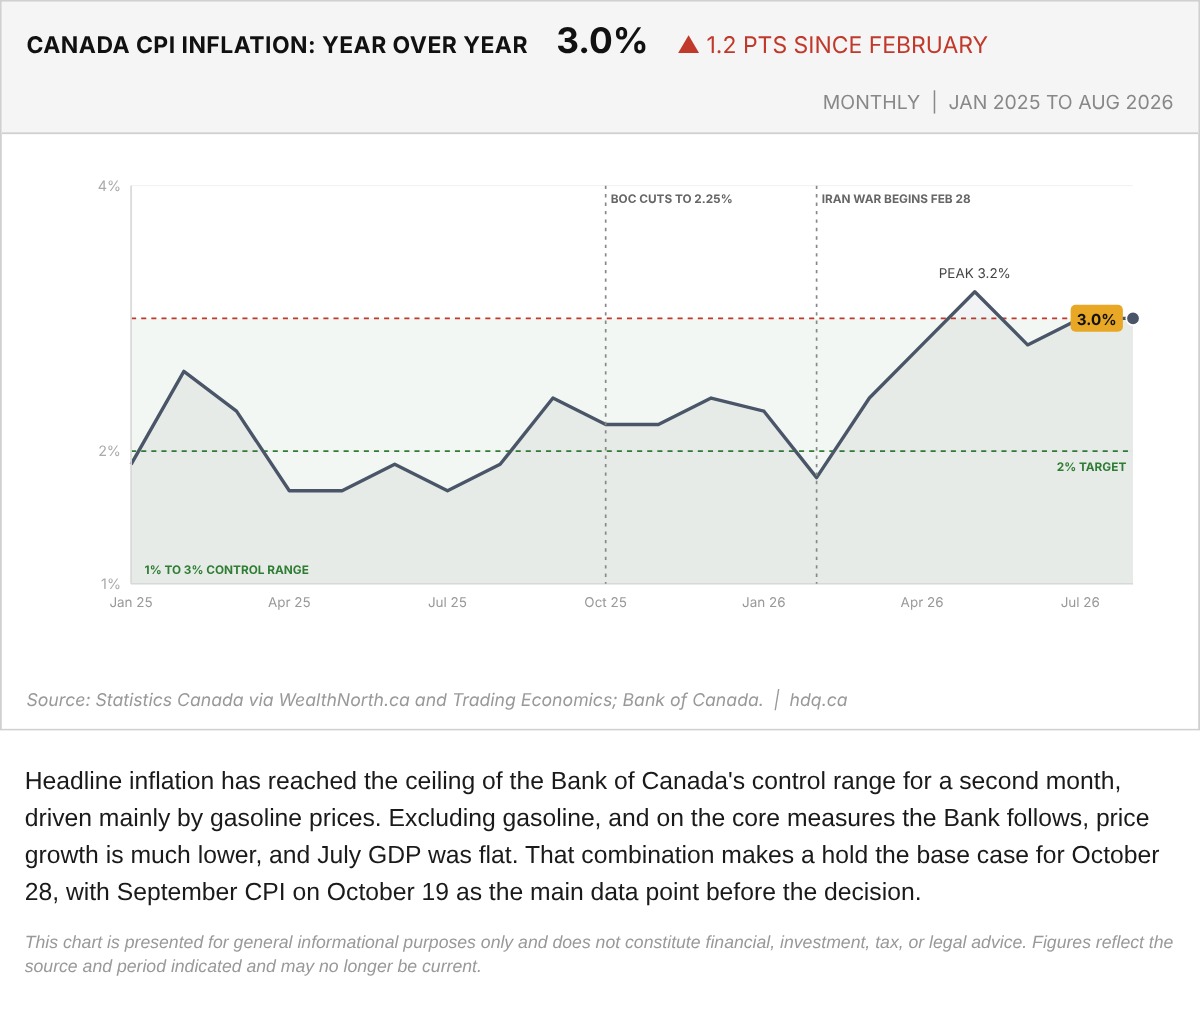
Headline inflation has reached the ceiling of the Bank of Canada's control range for a second month, driven mainly by gasoline prices.
Canada Consumer Price Index Inflation, January 2025 to August 2026
October 1, 2026
View chart & download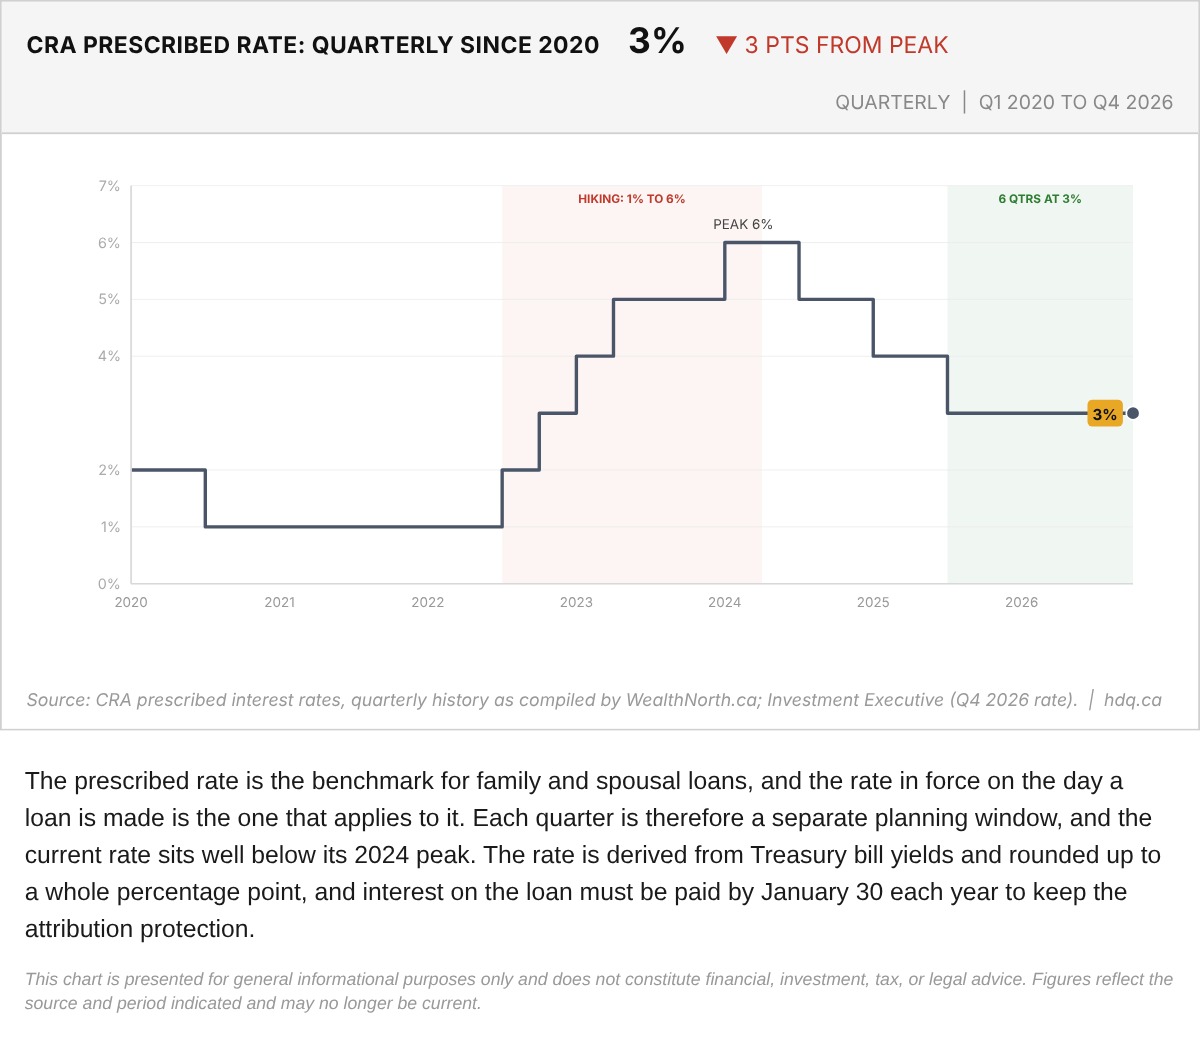
The prescribed rate is the benchmark for family and spousal loans, and the rate in force on the day a loan is made is the one that applies to it.
CRA Prescribed Interest Rate, Quarterly, Q1 2020 to Q4 2026
October 1, 2026
View chart & download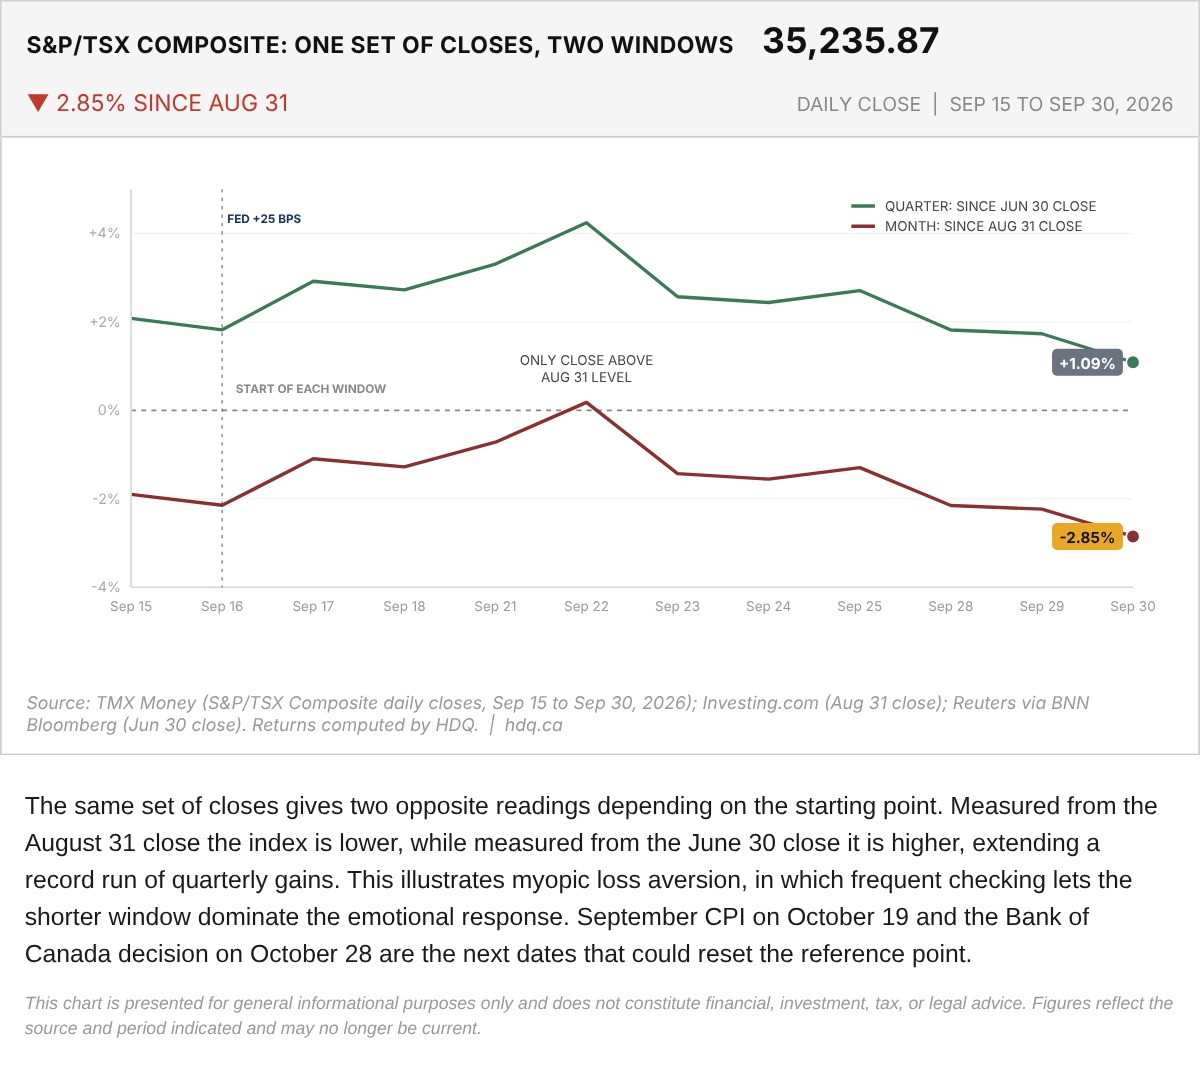
The same set of closes gives two opposite readings depending on the starting point.
S&P/TSX Composite: Monthly and Quarterly Returns From the Same Closes
October 1, 2026
View chart & download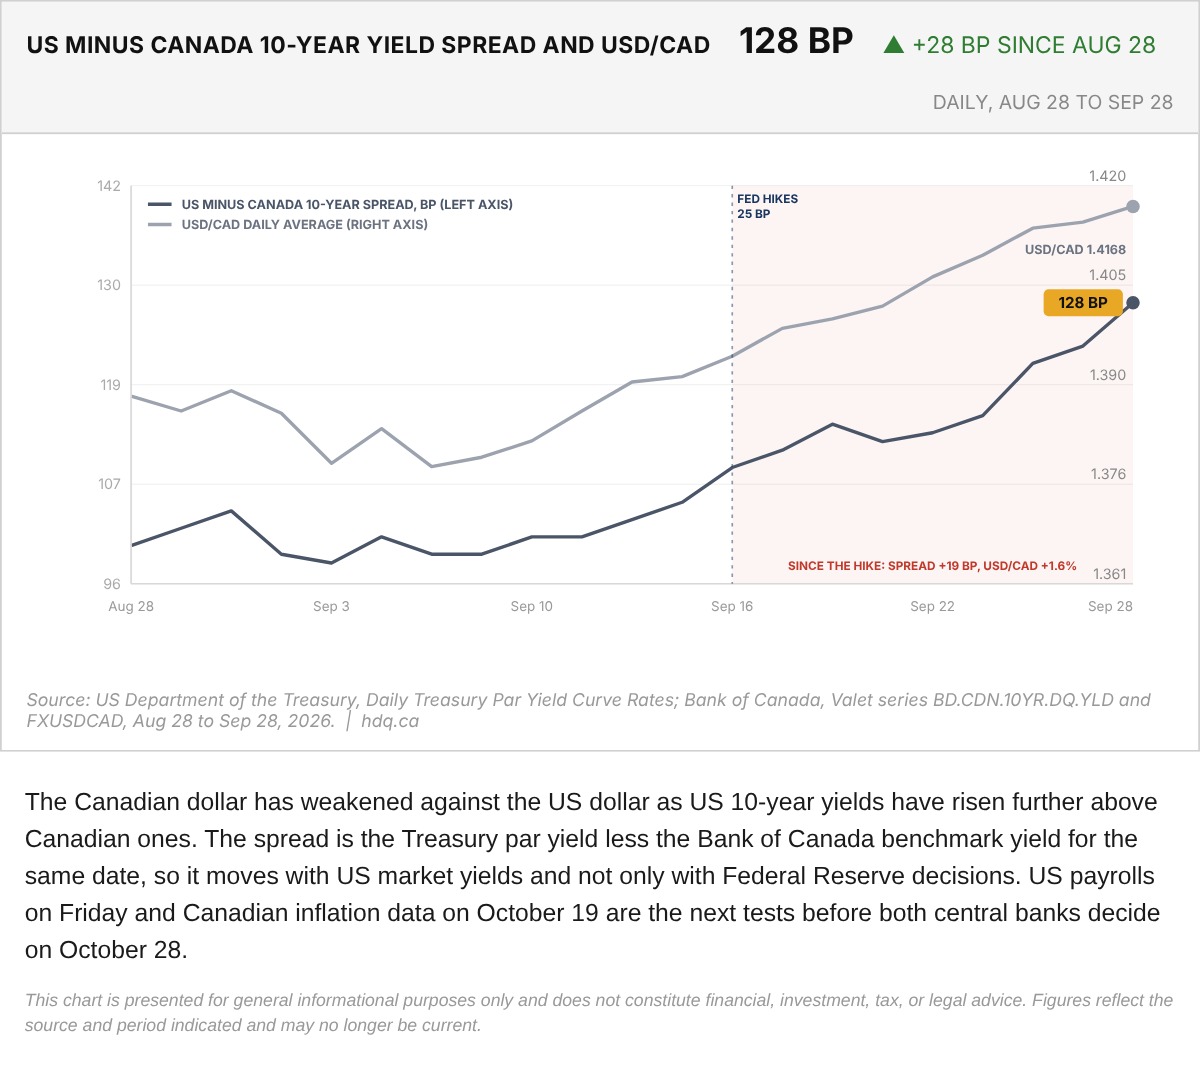
The Canadian dollar has weakened against the US dollar as US 10-year yields have risen further above Canadian ones.
US-Canada 10-Year Yield Spread and the USD/CAD Exchange Rate, August 28 to September 28, 2026
September 30, 2026
View chart & download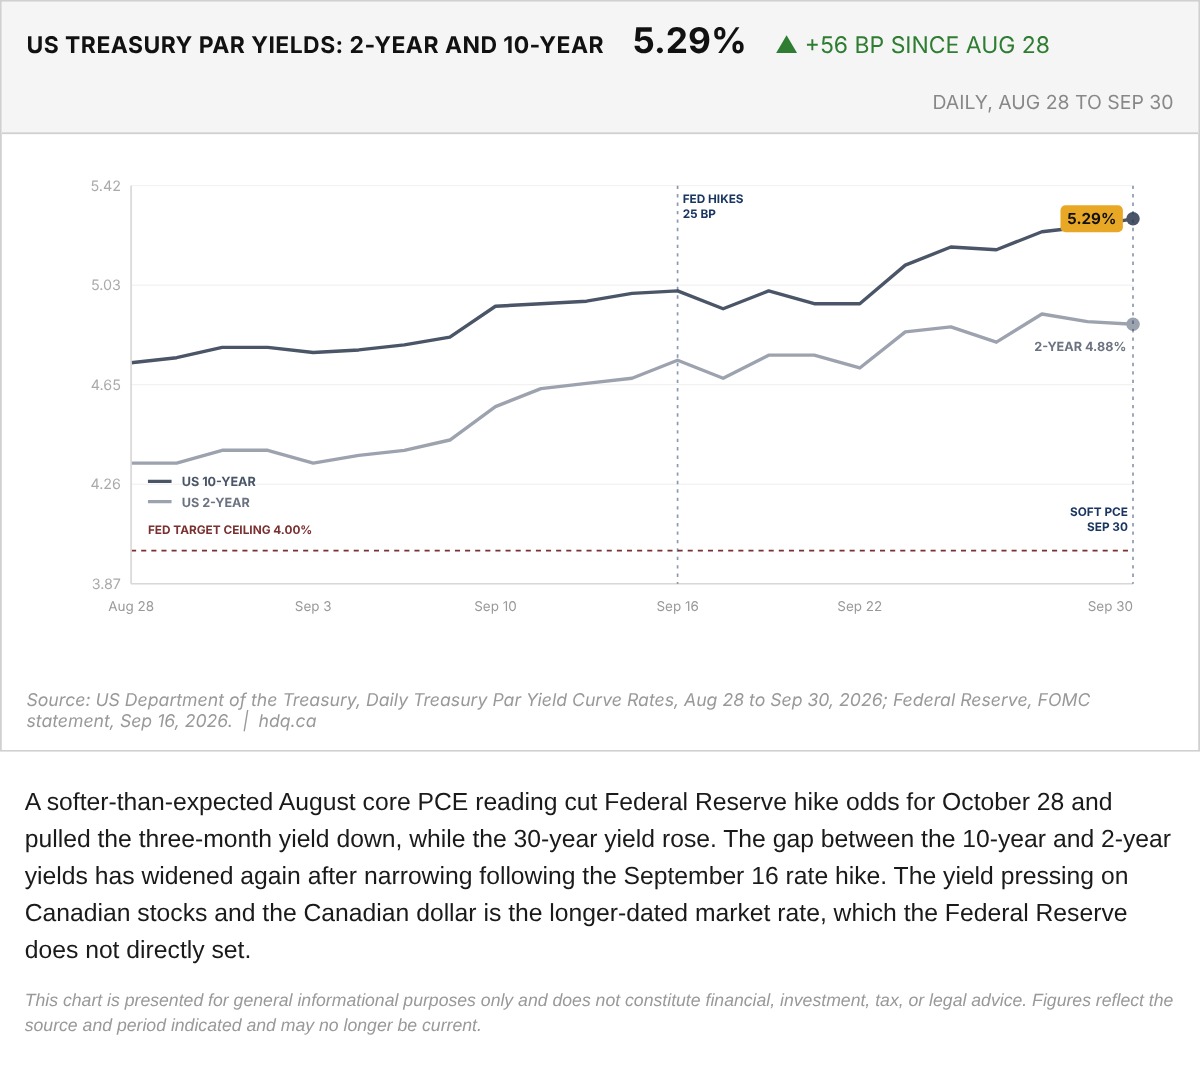
A softer-than-expected August core PCE reading cut Federal Reserve hike odds for October 28 and pulled the three-month yield down, while the 30-year yield rose.
US Treasury Par Yields: 2-Year and 10-Year, August 28 to September 30, 2026
September 30, 2026
View chart & download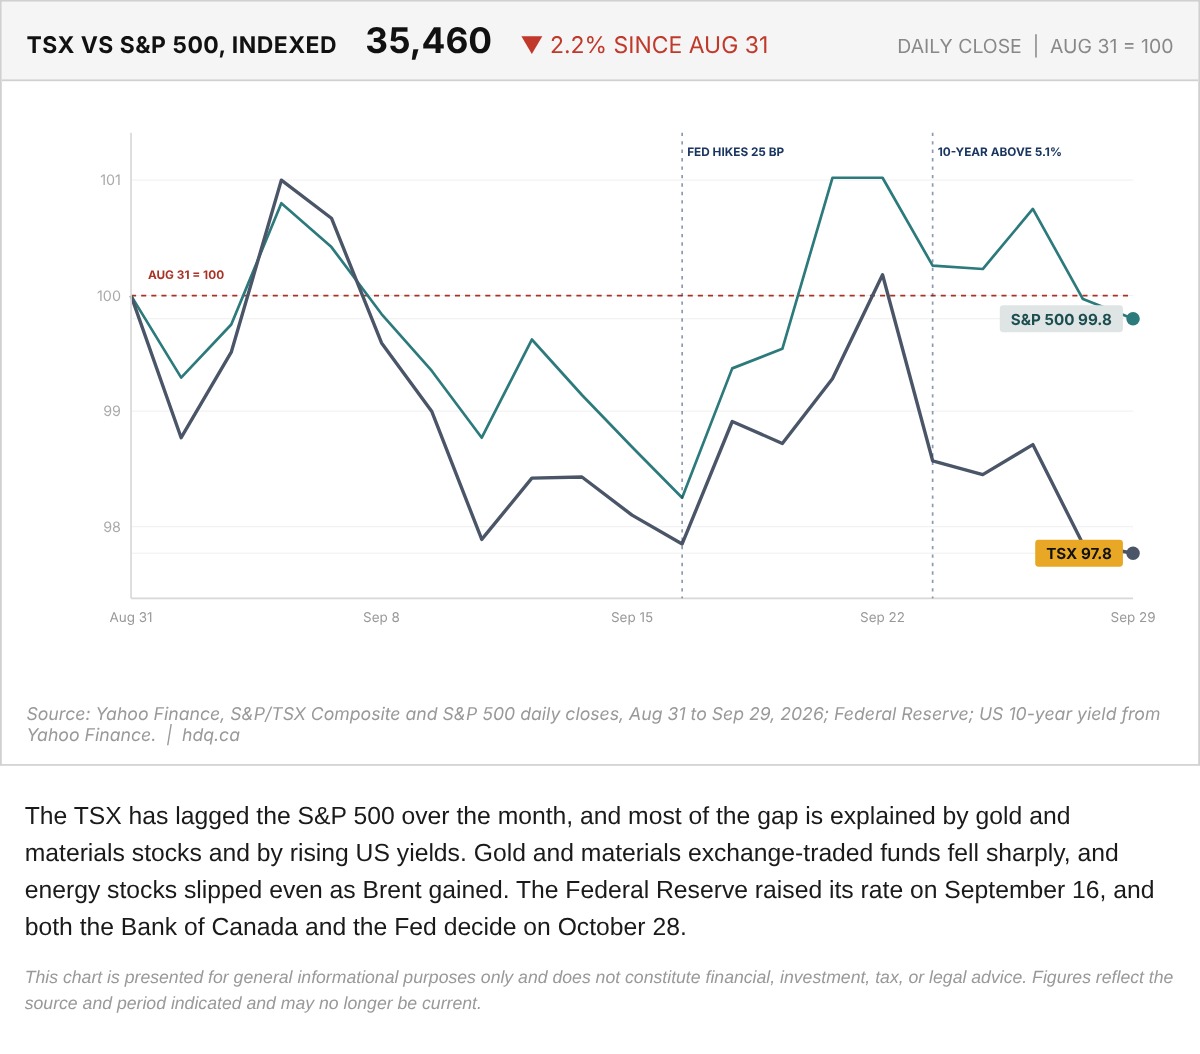
The TSX has lagged the S&P 500 over the month, and most of the gap is explained by gold and materials stocks and by rising US yields.
S&P/TSX Composite Versus S&P 500, Indexed to August 31, 2026
September 30, 2026
View chart & download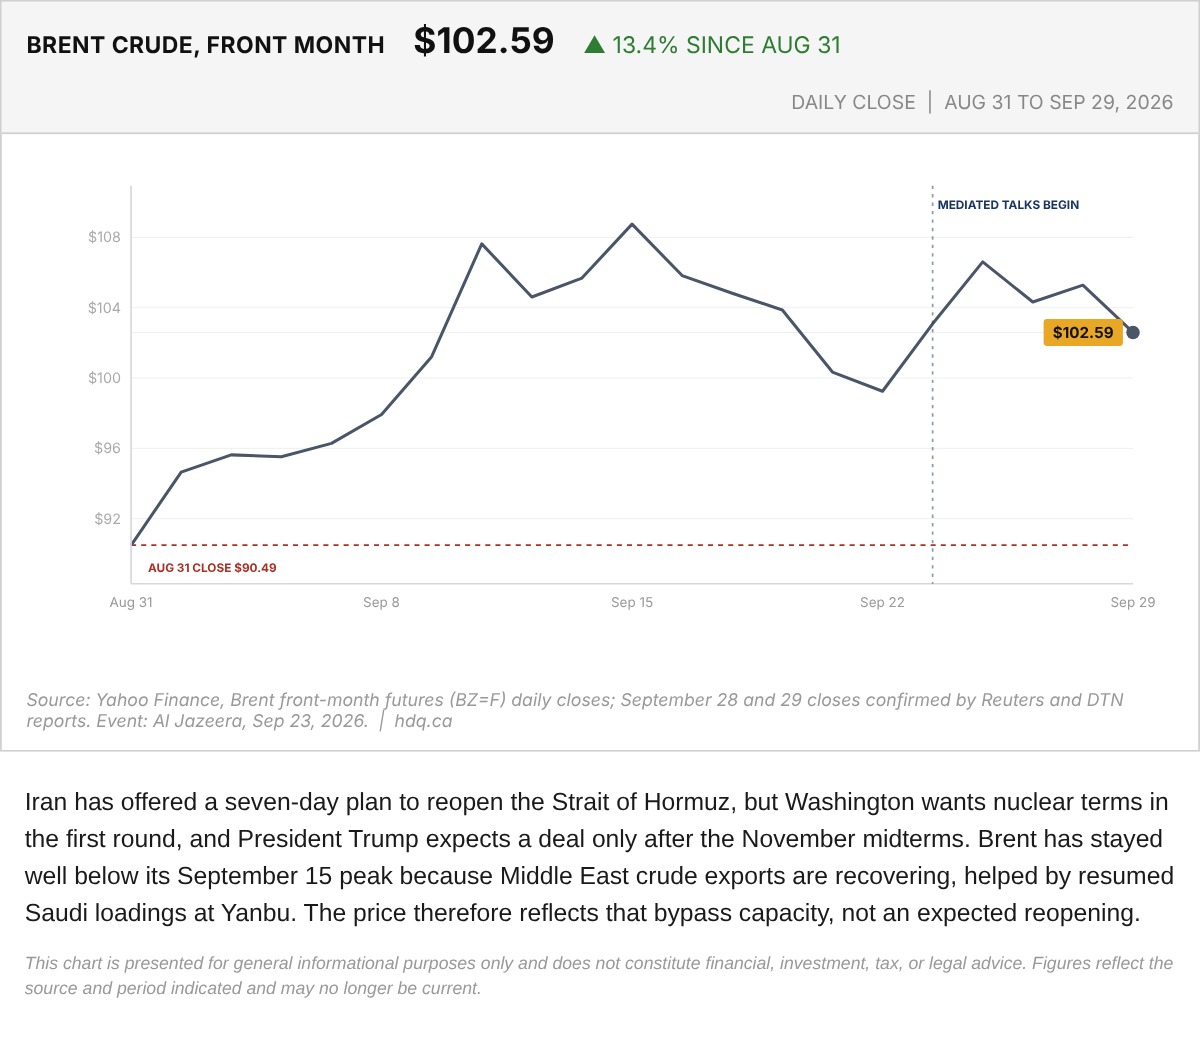
Iran has offered a seven-day plan to reopen the Strait of Hormuz, but Washington wants nuclear terms in the first round, and President…
Brent Crude Front-Month Futures, August 31 to September 29, 2026
September 30, 2026
View chart & download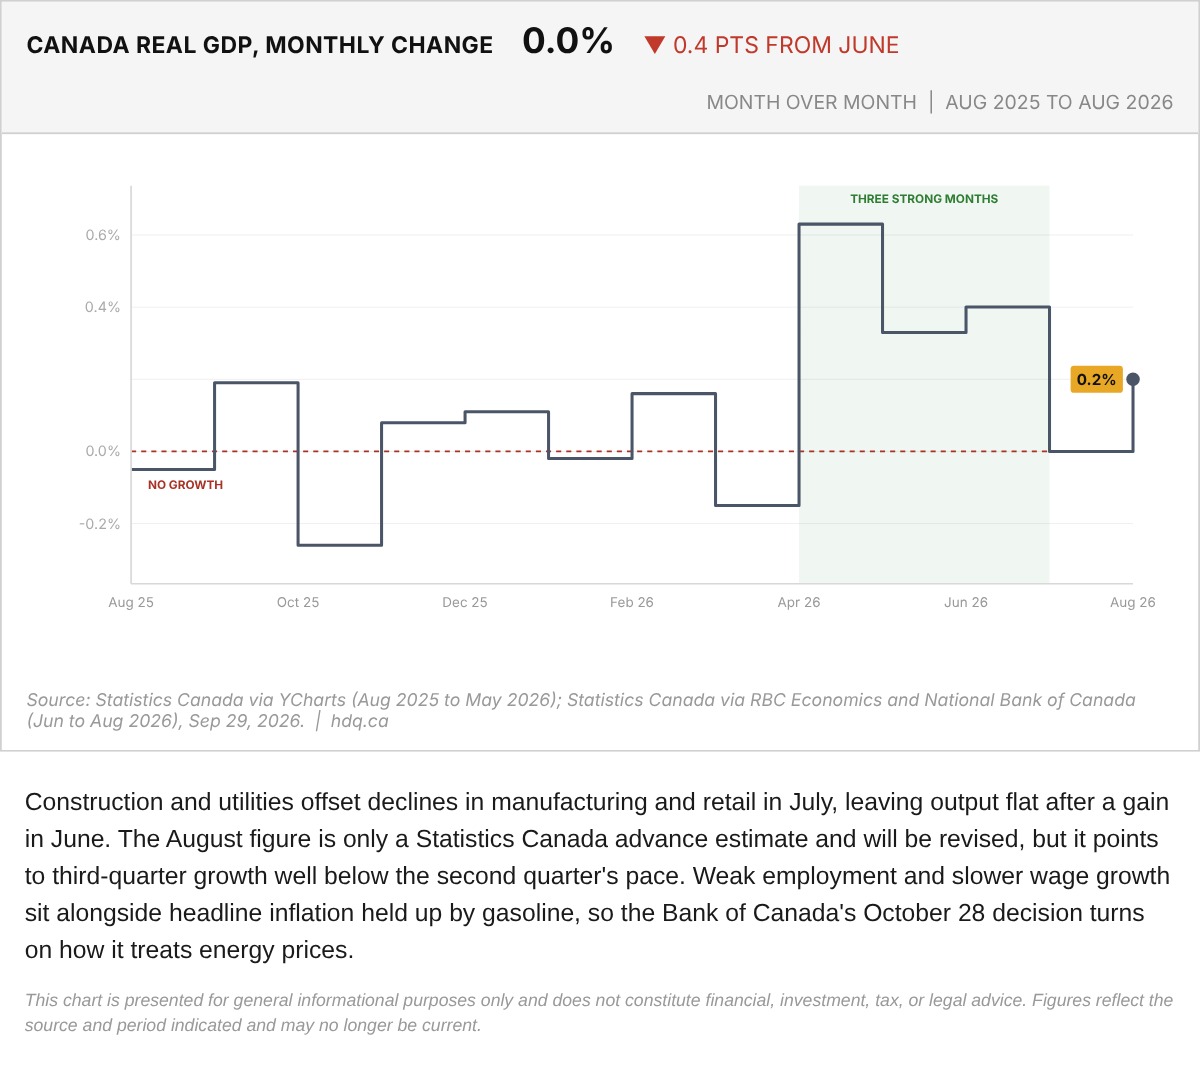
Construction and utilities offset declines in manufacturing and retail in July, leaving output flat after a gain in June.
Canada Real GDP Monthly Change, August 2025 to August 2026
September 30, 2026
View chart & download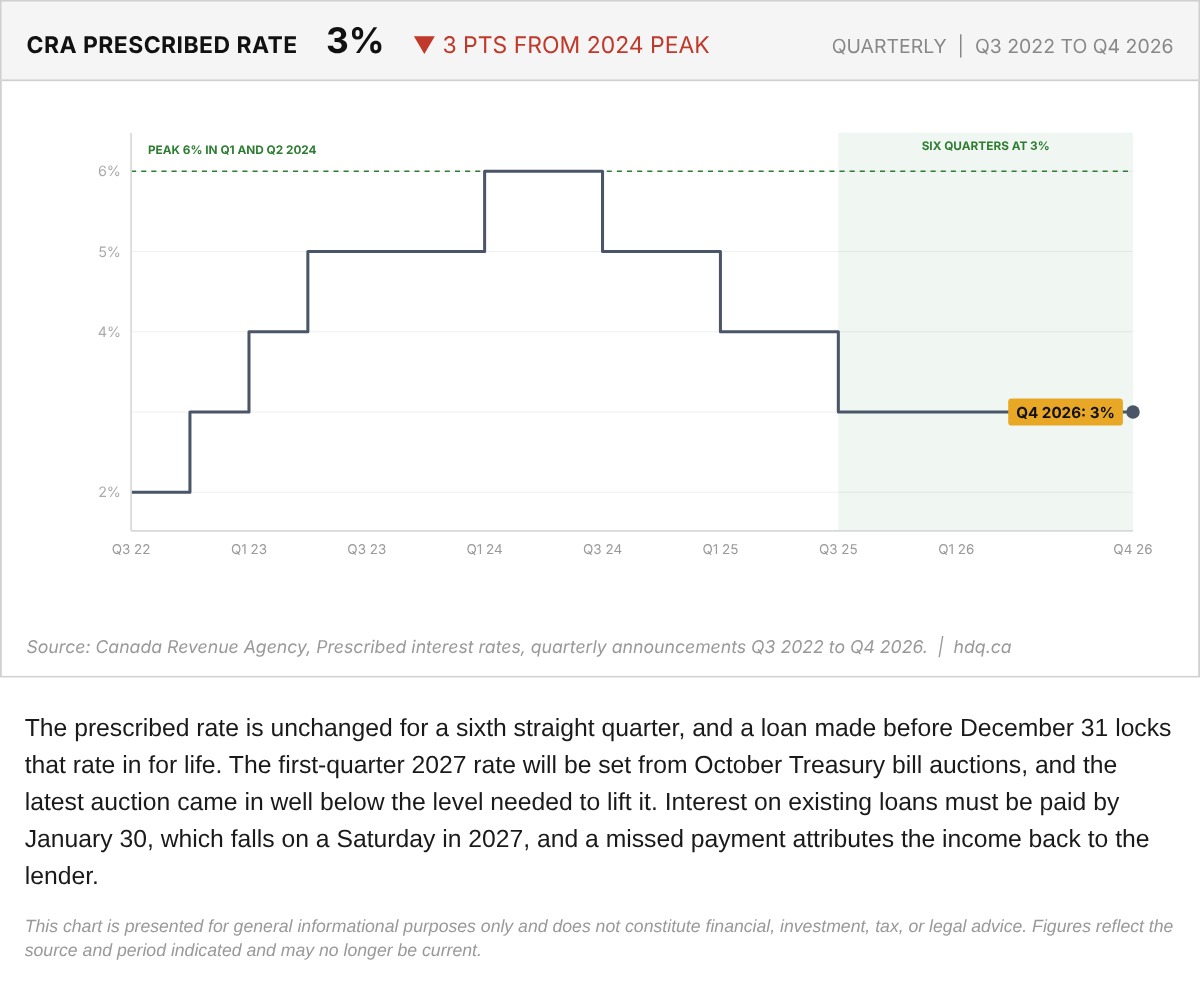
The prescribed rate is unchanged for a sixth straight quarter, and a loan made before December 31 locks that rate in for life.
CRA Prescribed Interest Rate by Quarter, Q3 2022 to Q4 2026
September 30, 2026
View chart & download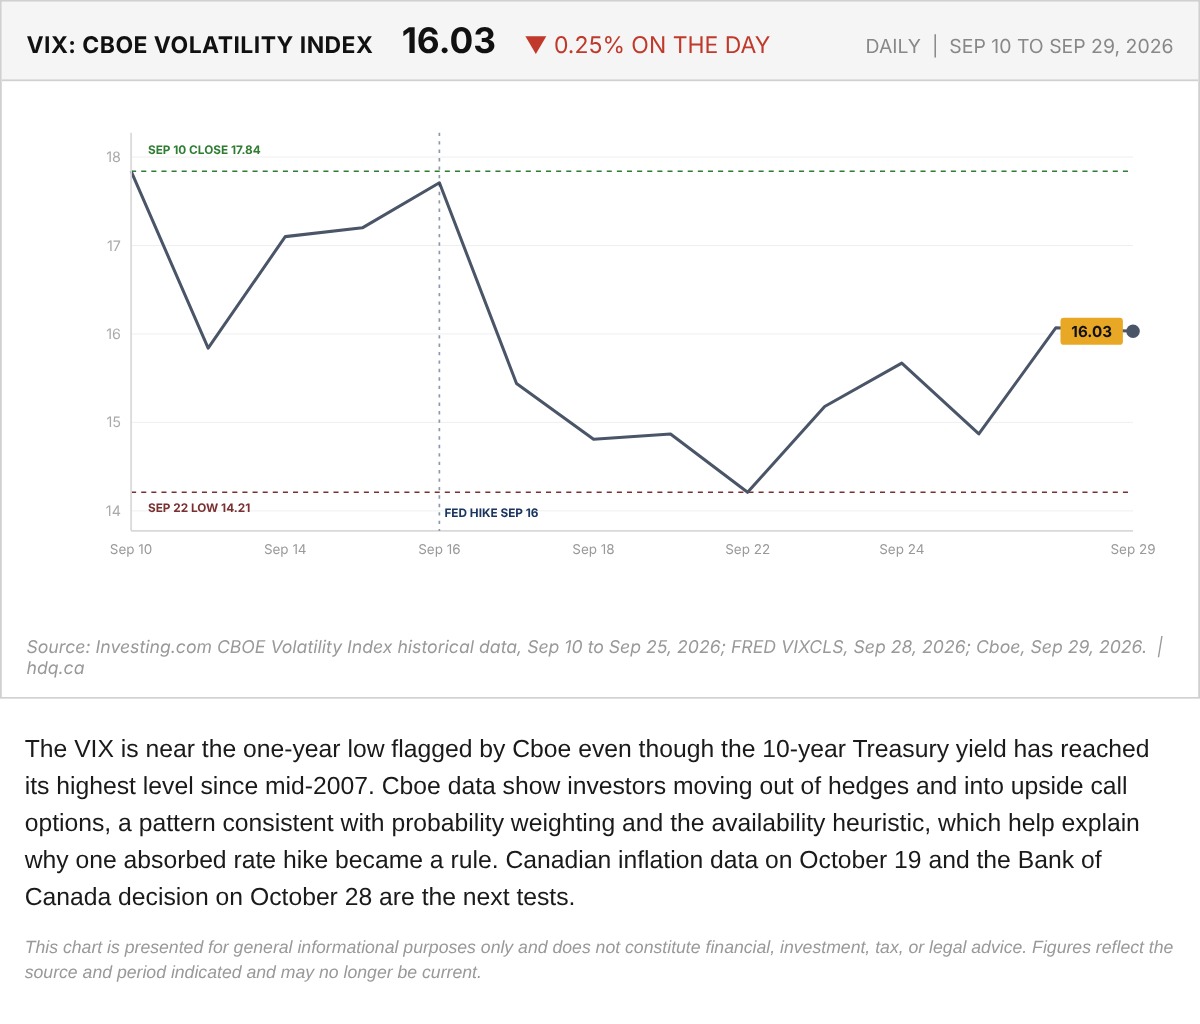
The VIX is near the one-year low flagged by Cboe even though the 10-year Treasury yield has reached its highest level since mid-2007.
Cboe Volatility Index (VIX), September 10 to September 29, 2026
September 30, 2026
View chart & download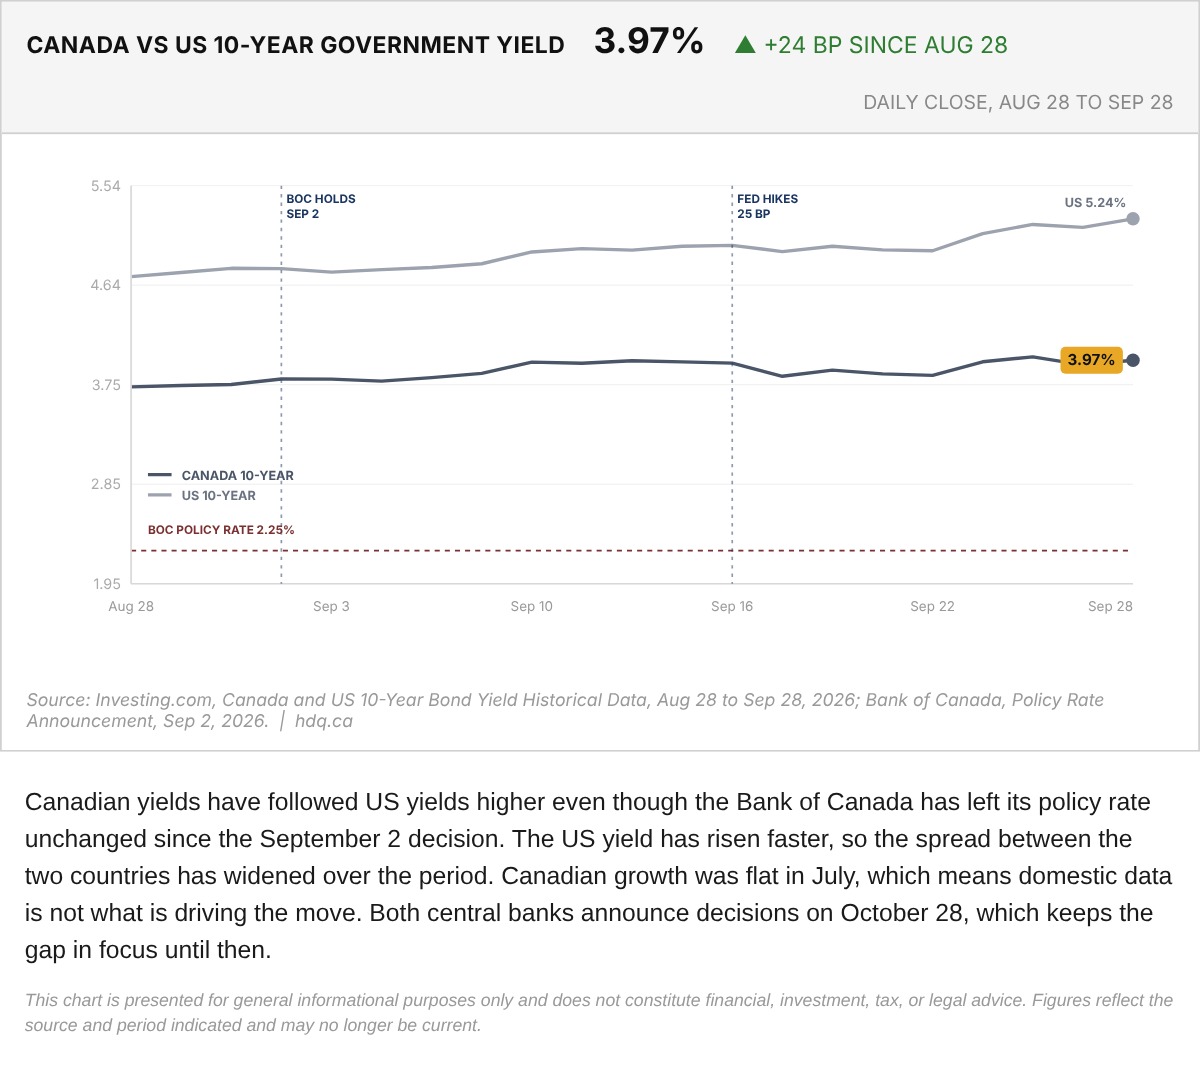
Canadian yields have followed US yields higher even though the Bank of Canada has left its policy rate unchanged since the September 2 decision.
Canada and US 10-Year Government Bond Yields, August 28 to September 28, 2026
September 29, 2026
View chart & download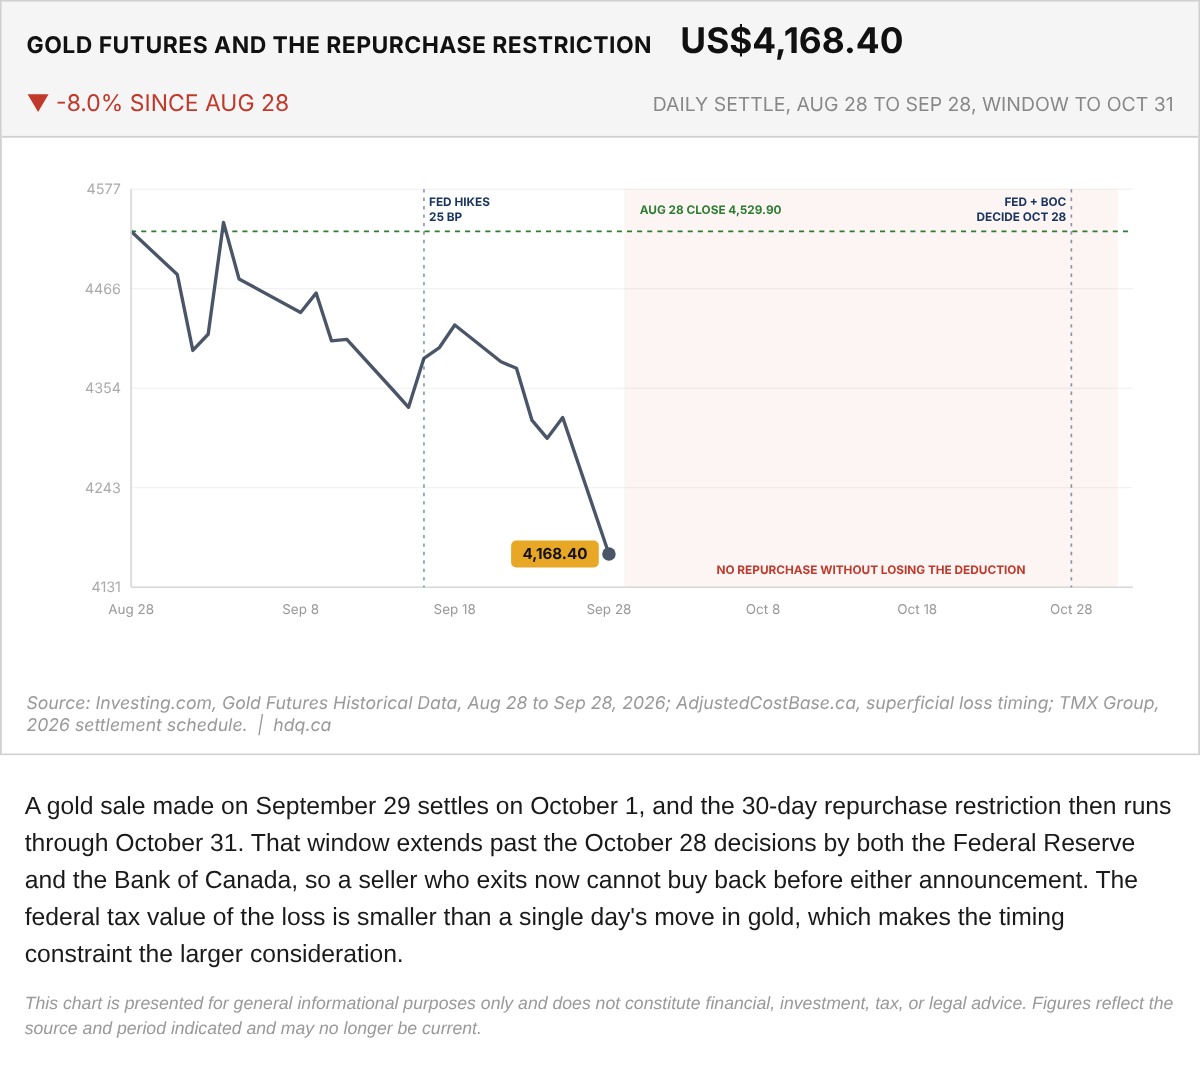
A gold sale made on September 29 settles on October 1, and the 30-day repurchase restriction then runs through October 31.
Gold Futures and the 30-Day Repurchase Restriction After a September 29 Sale
September 29, 2026
View chart & download