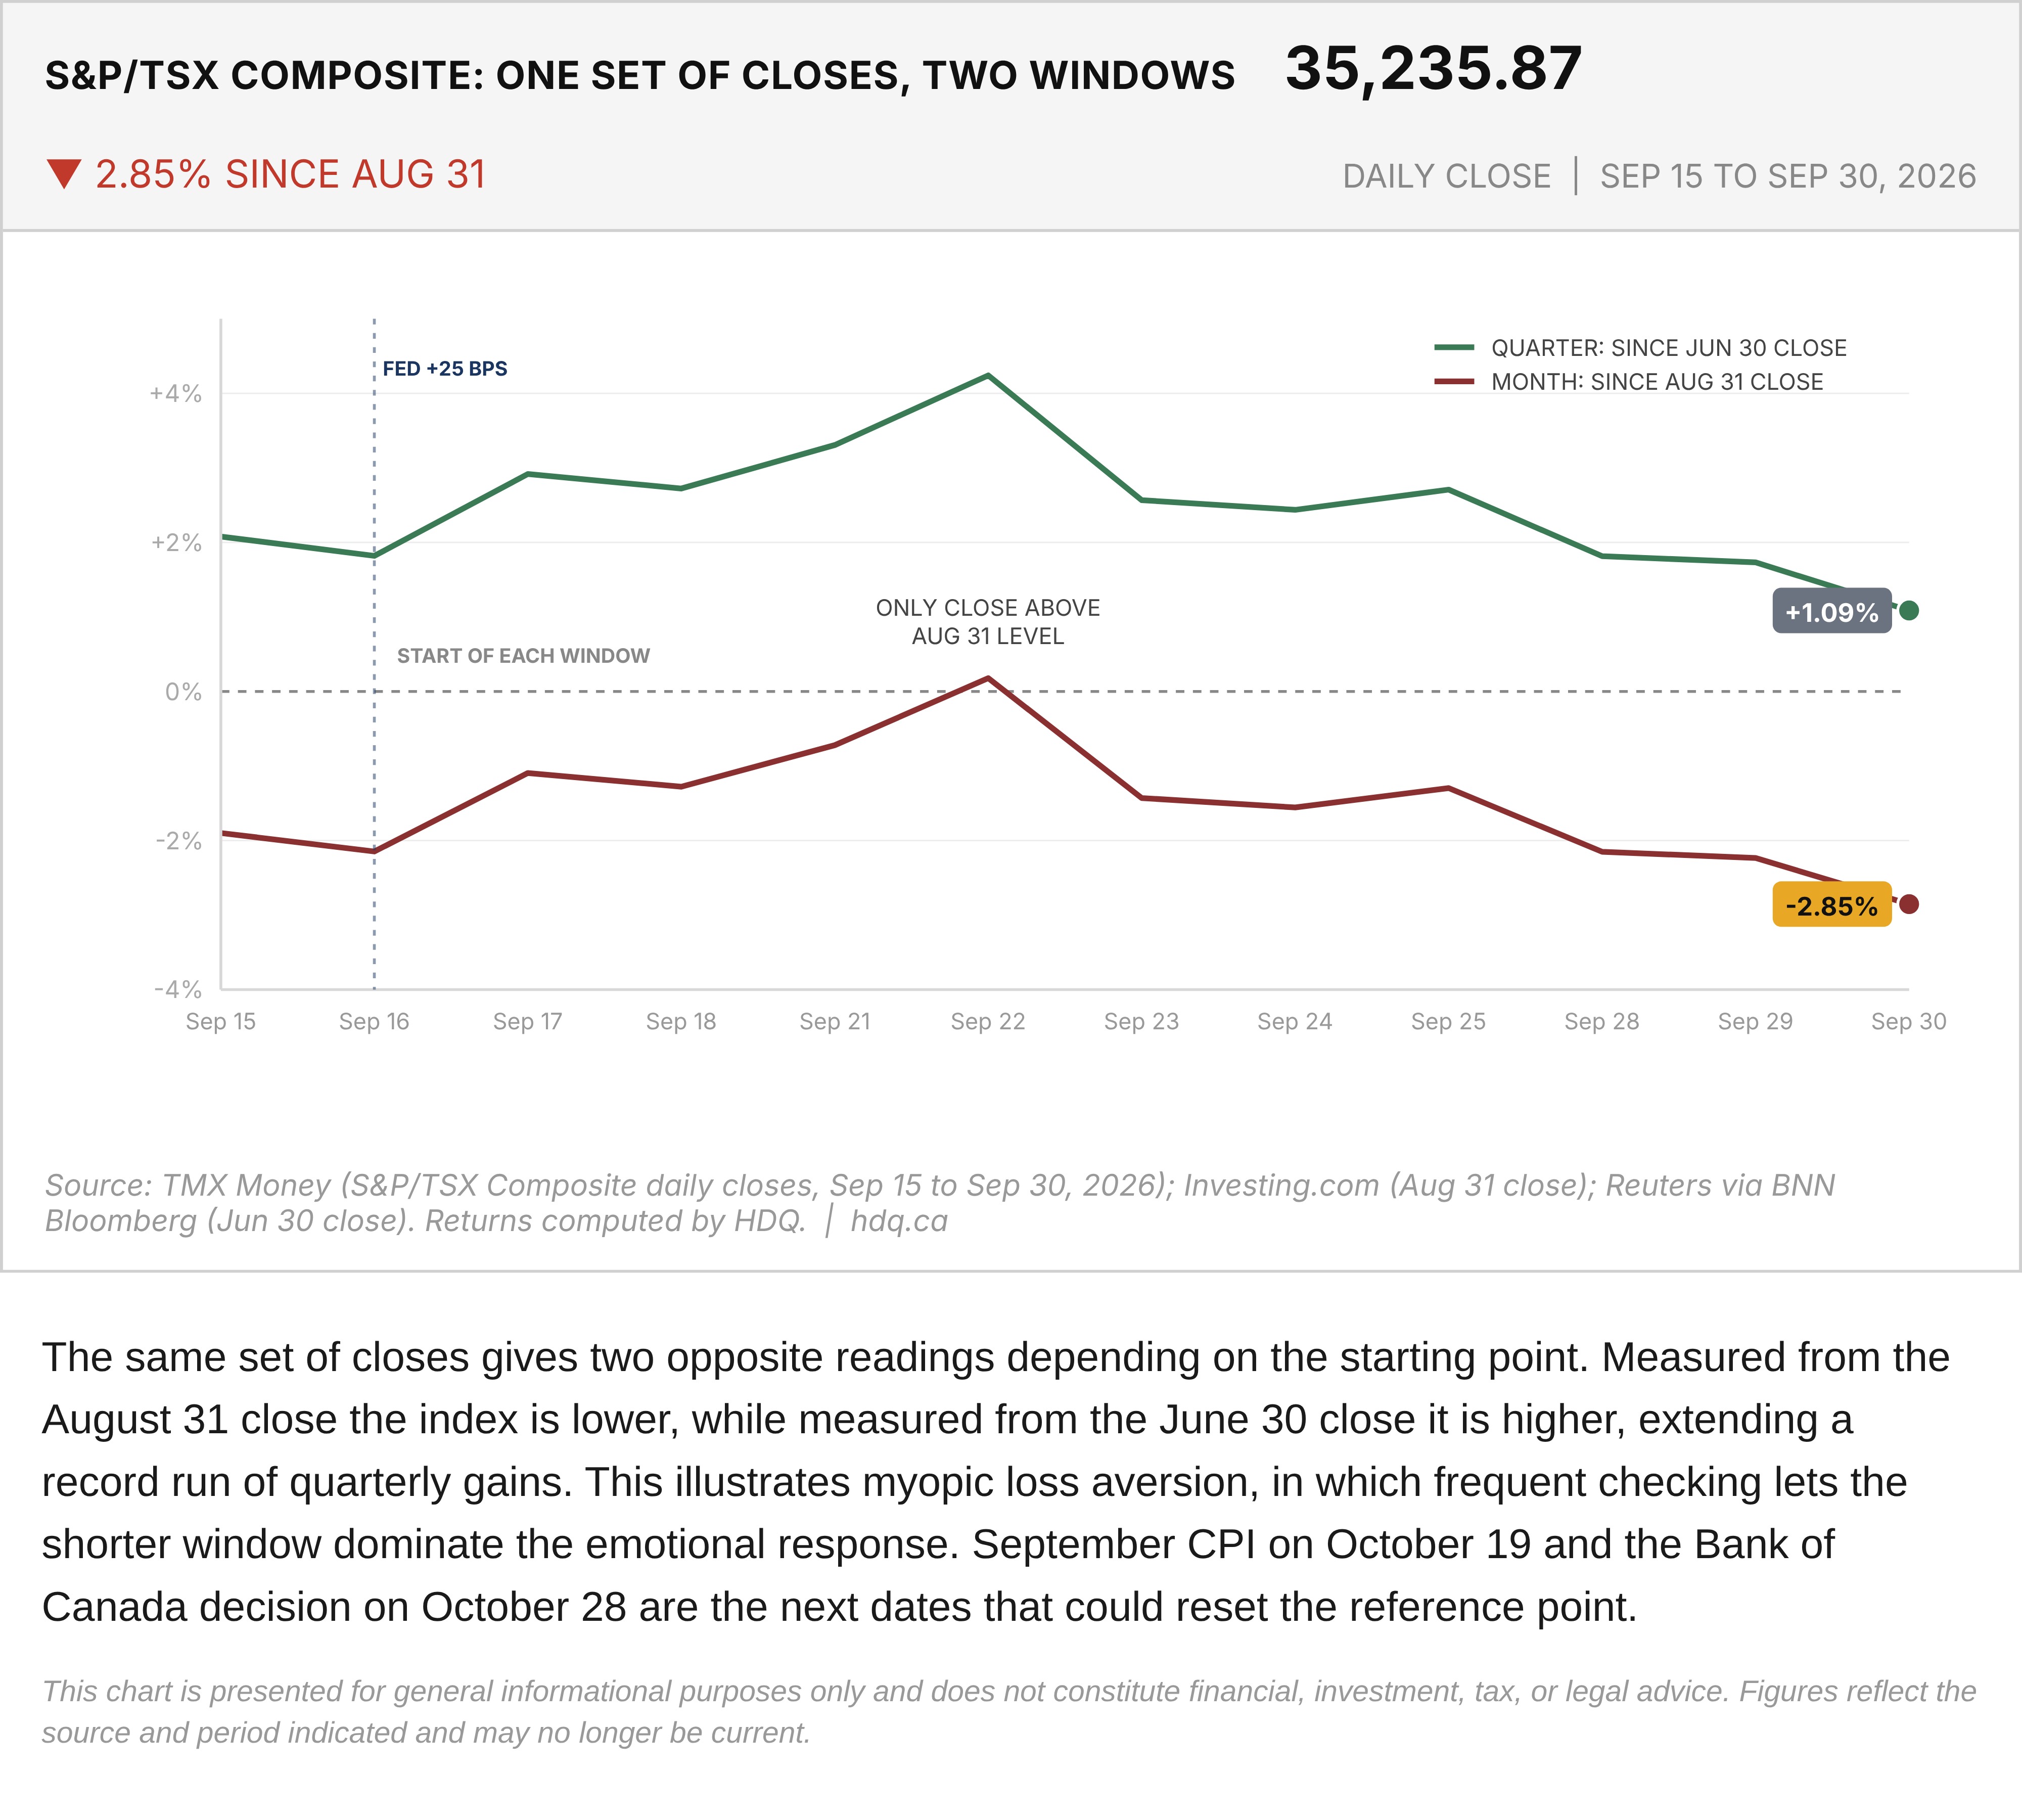
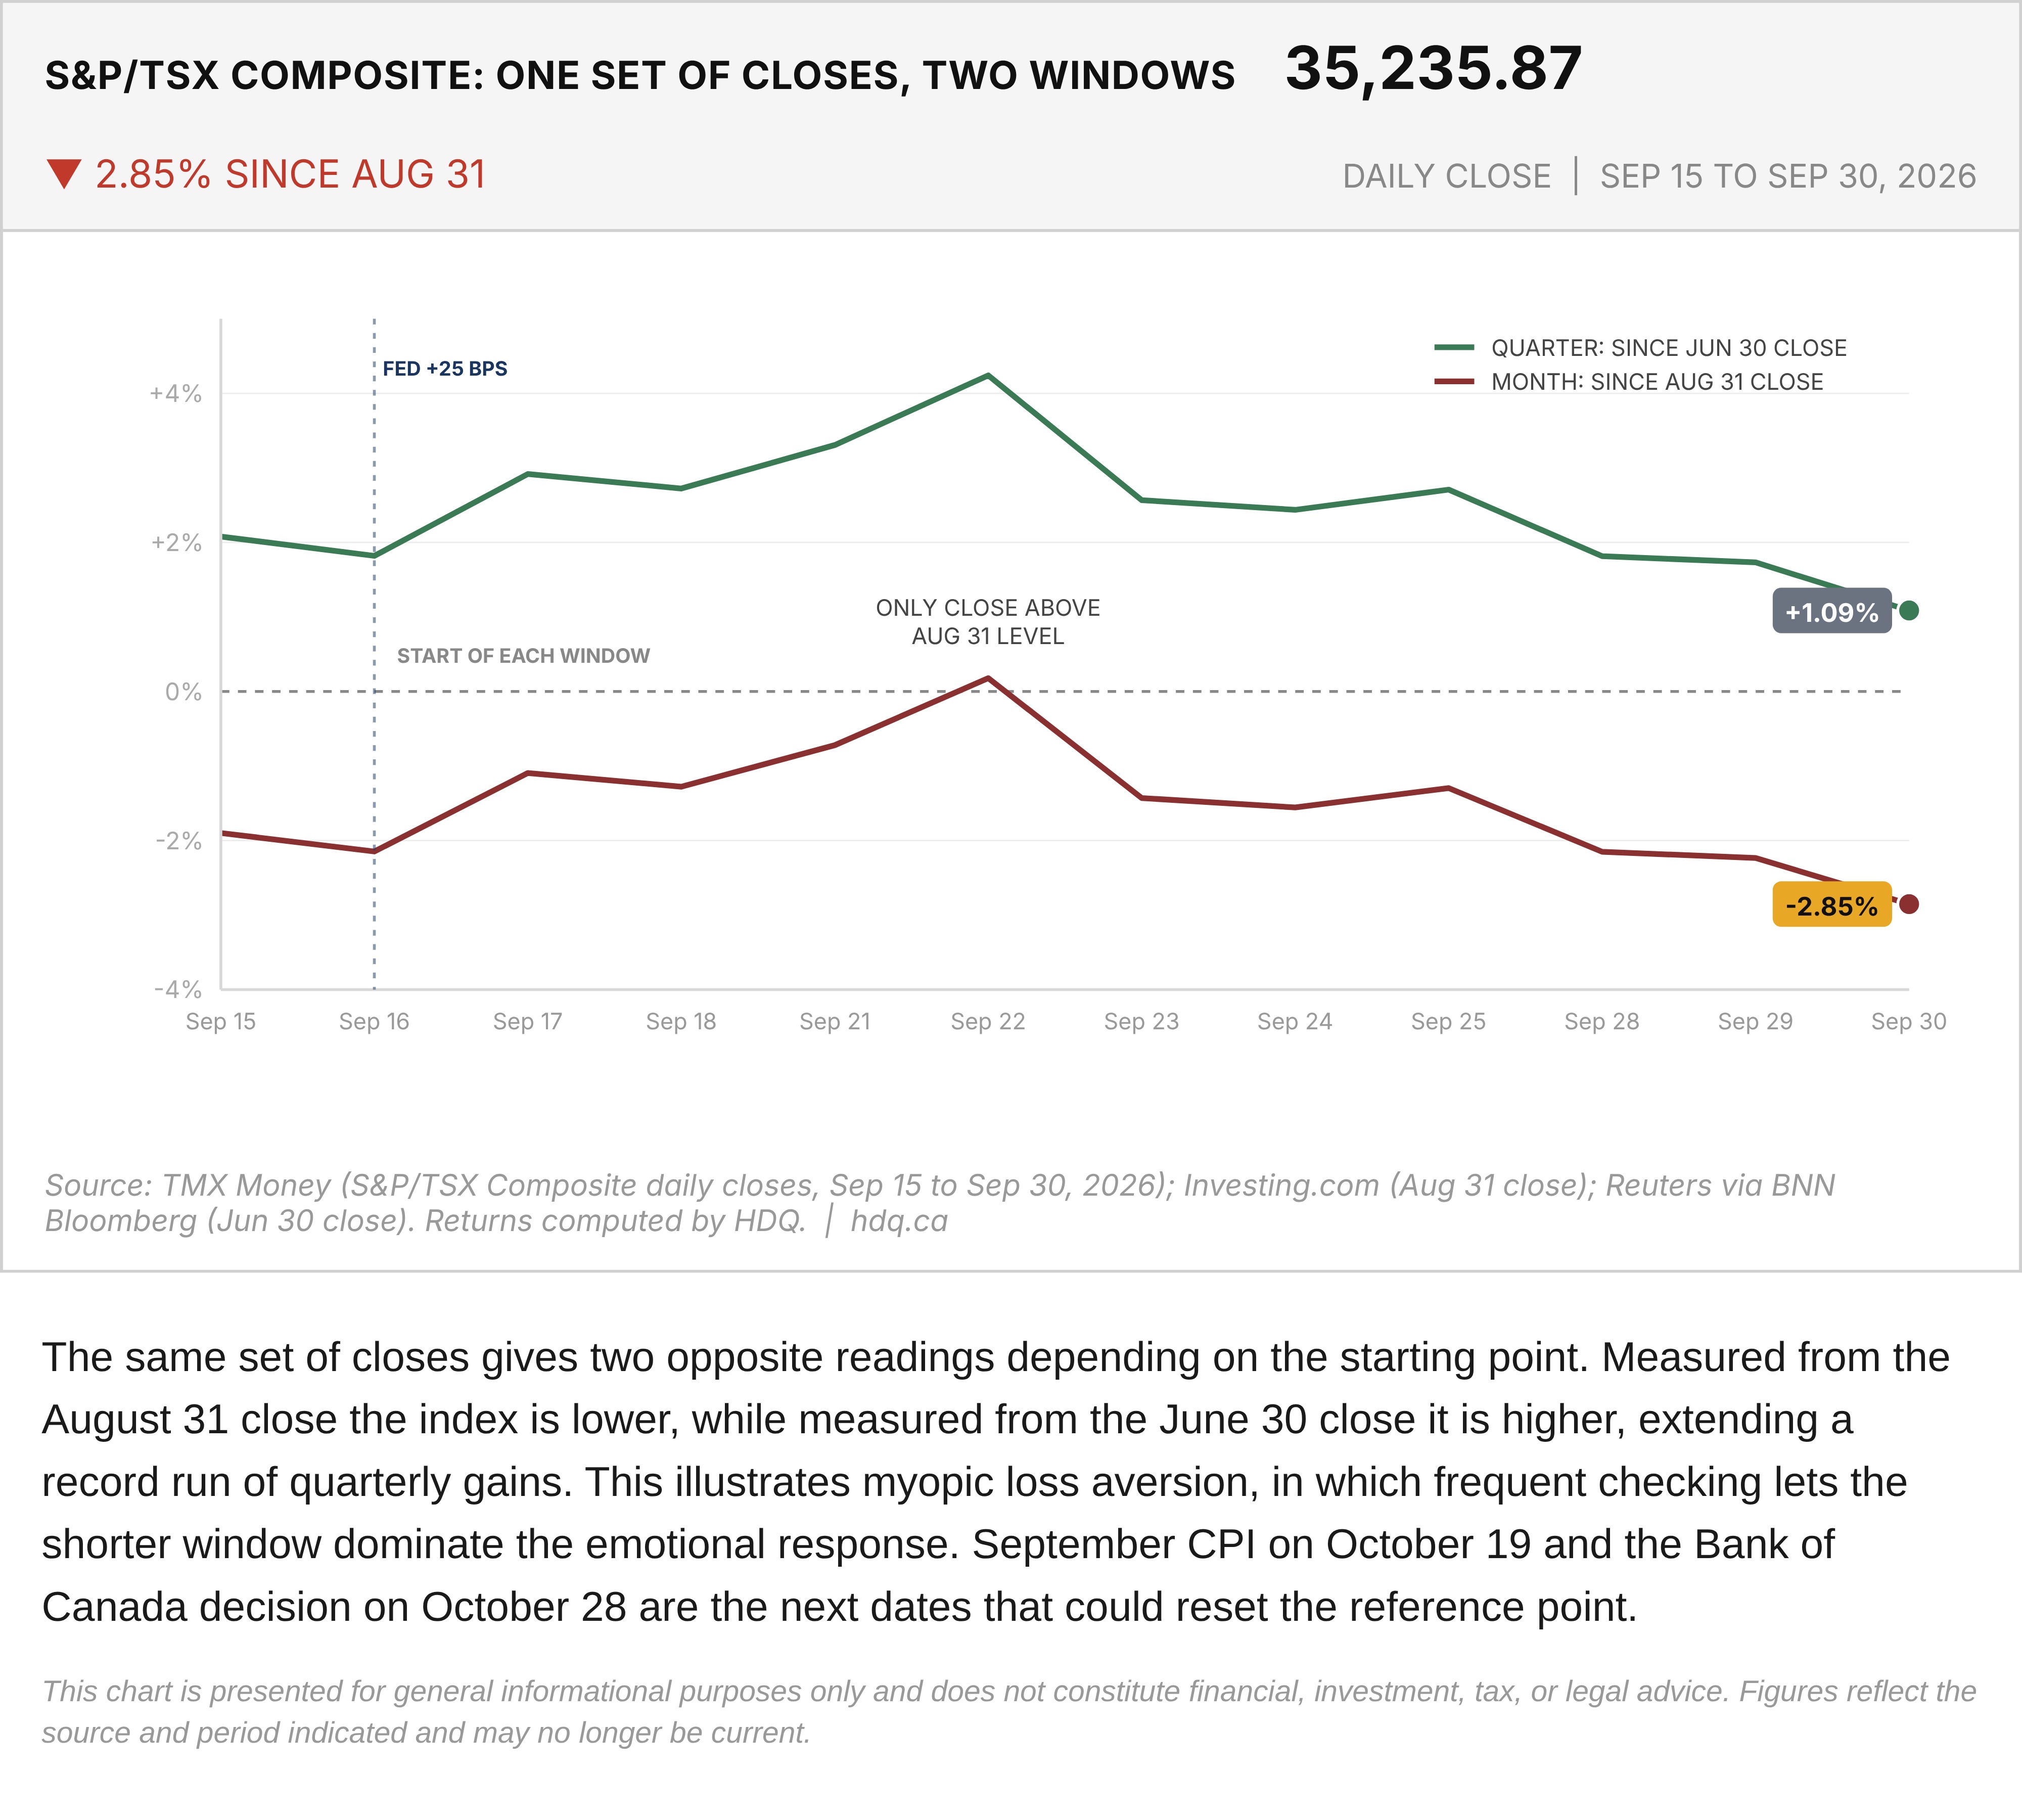
The same set of closes gives two opposite readings depending on the starting point. Measured from the August 31 close the index is lower, while measured from the June 30 close it is higher, extending a record run of quarterly gains. This illustrates myopic loss aversion, in which frequent checking lets the shorter window dominate the emotional response. September CPI on October 19 and the Bank of Canada decision on October 28 are the next dates that could reset the reference point.
This chart is presented for general informational purposes only and does not constitute financial, investment, tax, or legal advice. Figures reflect the source and period indicated and may no longer be current.
Related charts
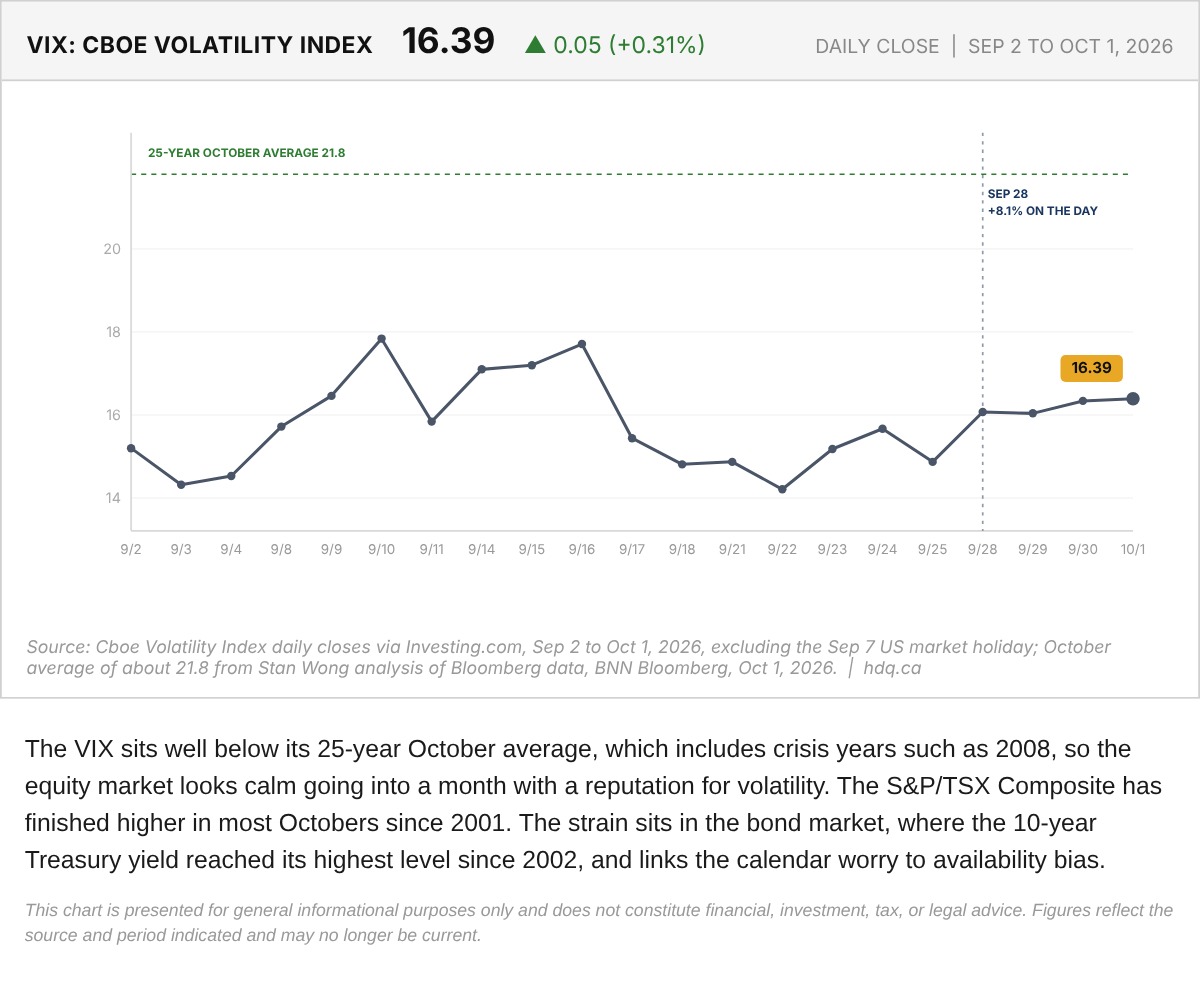
The VIX sits well below its 25-year October average, which includes crisis years such as 2008, so the equity market looks calm going into a month with a reputation for volatility.
Cboe Volatility Index (VIX) and the October Average, September 2 to October 1, 2026
October 2, 2026
View chart & download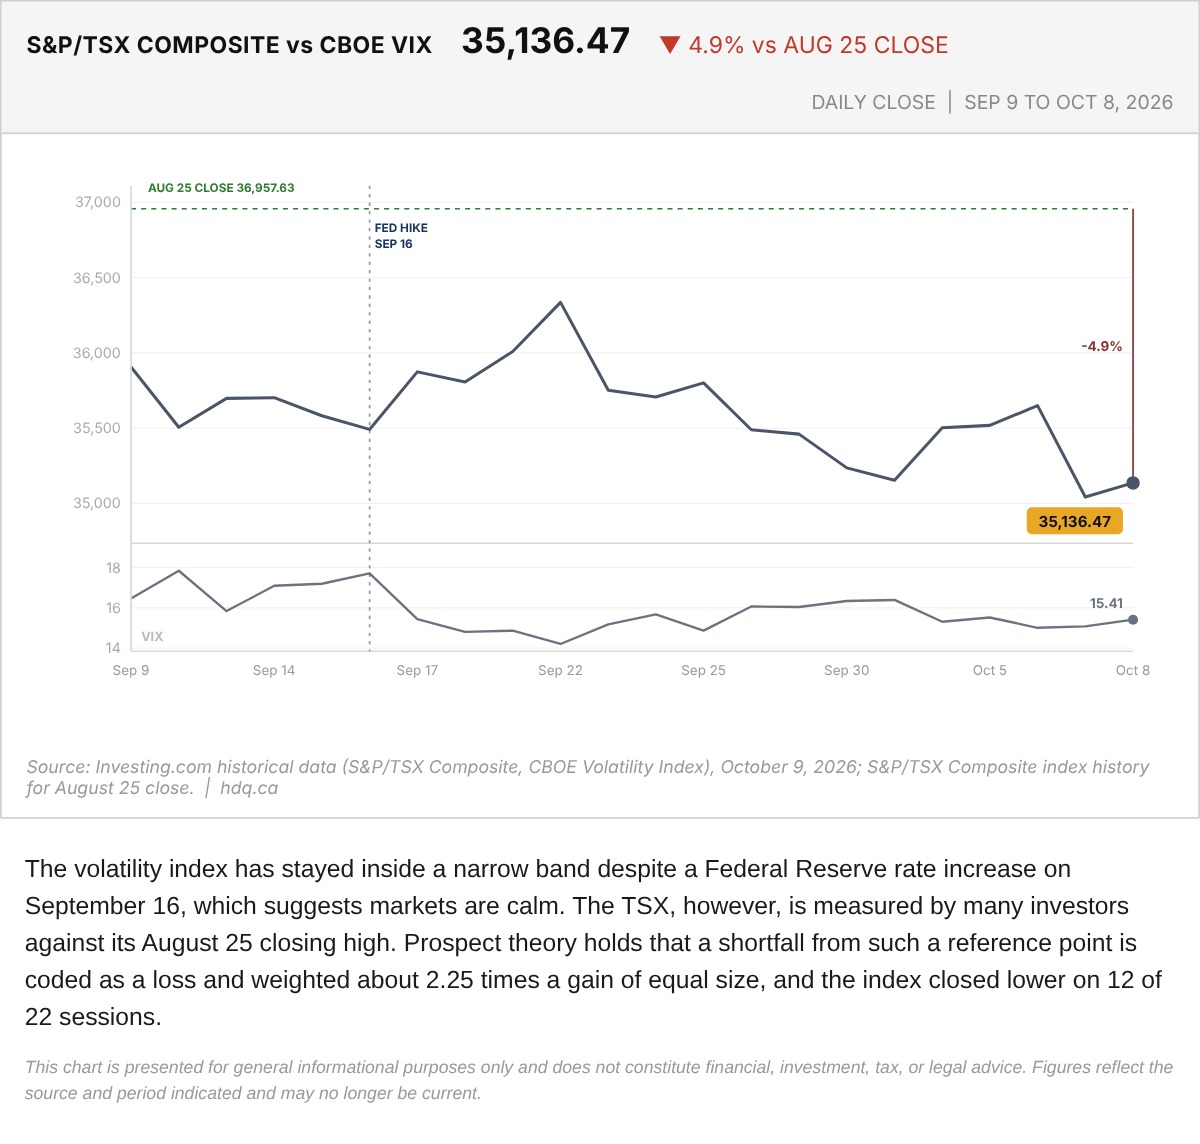
The volatility index has stayed inside a narrow band despite a Federal Reserve rate increase on September 16, which suggests markets are calm.
S&P/TSX Composite Against the Cboe VIX, September 9 to October 8
October 9, 2026
View chart & download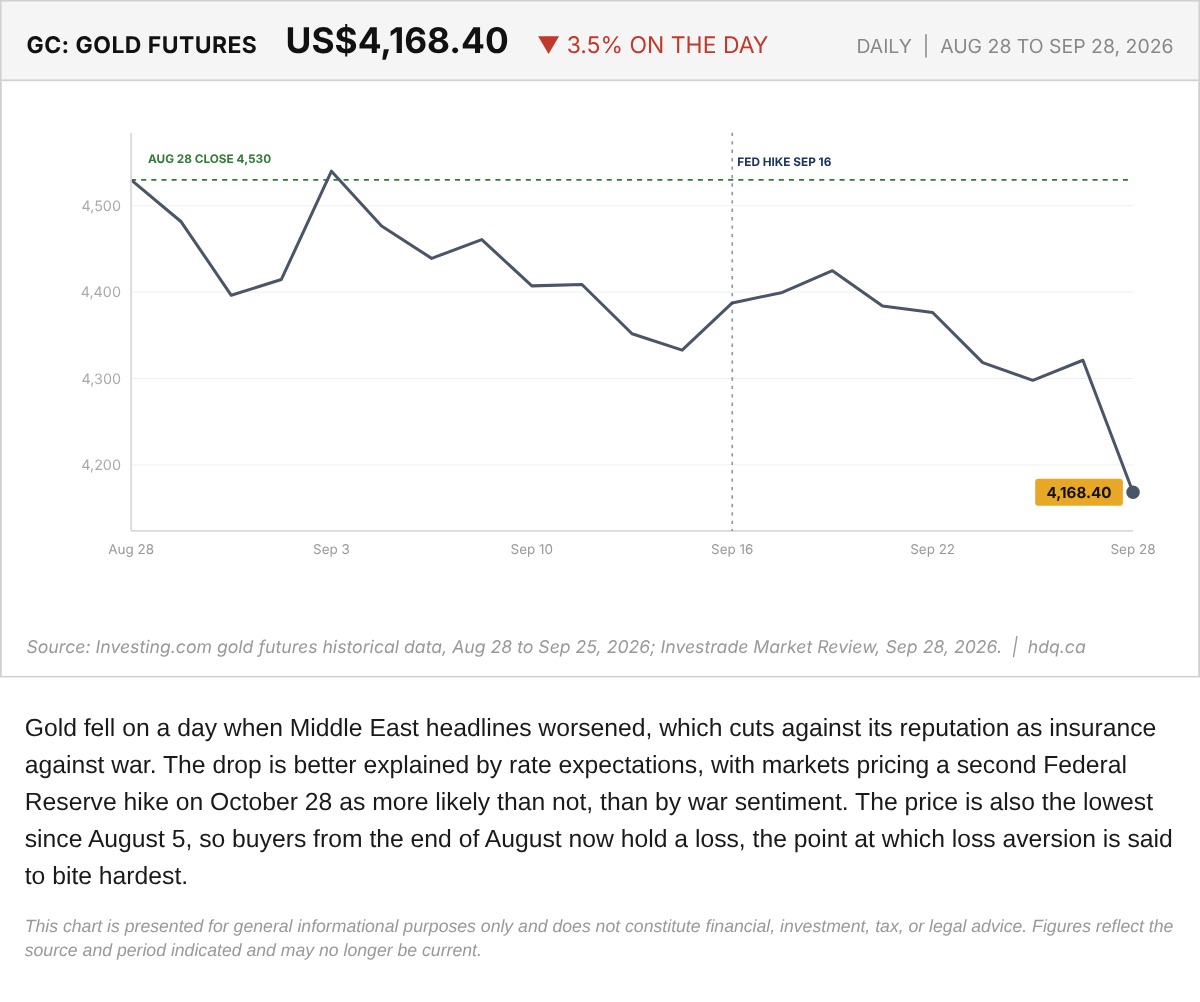
Gold fell on a day when Middle East headlines worsened, which cuts against its reputation as insurance against war.
Gold Futures After the September 28 Selloff, August 28 to September 28, 2026
September 29, 2026
View chart & download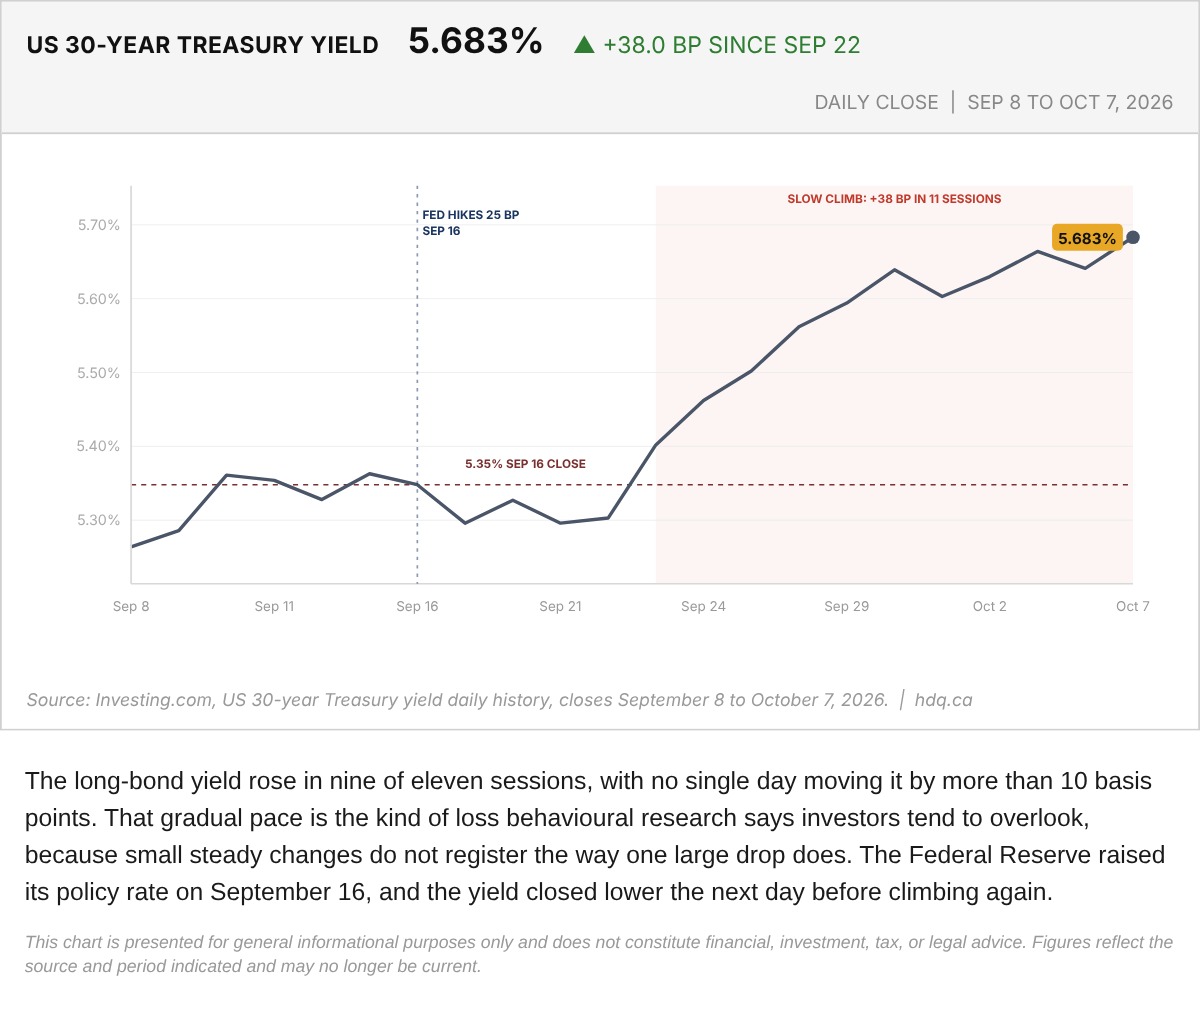
The long-bond yield rose in nine of eleven sessions, with no single day moving it by more than 10 basis points.
US 30-Year Treasury Yield Daily Close, September 8 to October 7
October 8, 2026
View chart & download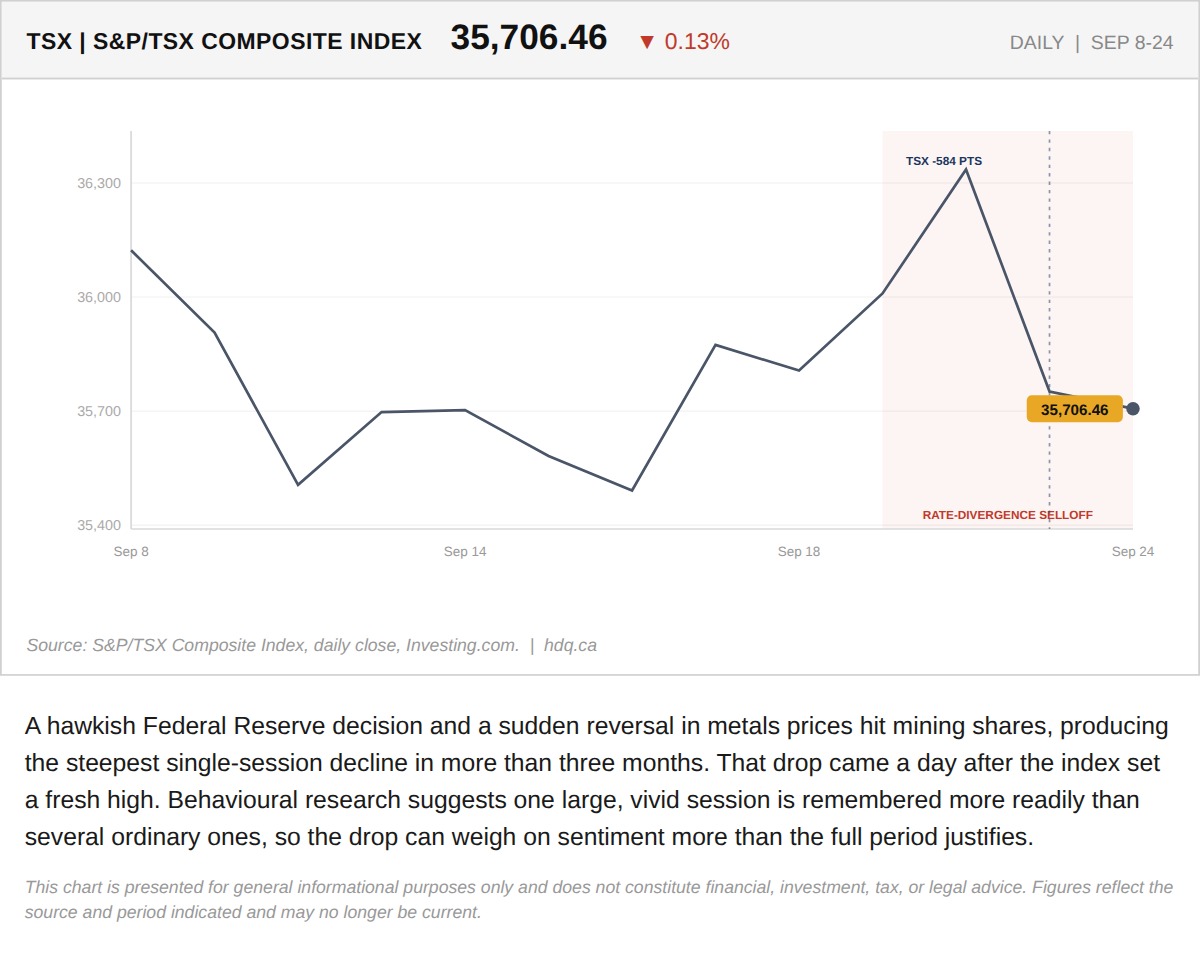
A hawkish Federal Reserve decision and a sudden reversal in metals prices hit mining shares, producing the steepest single-session decline in more than three months.
TSX Drops Sharply Midweek Amid Rate Divergence
September 25, 2026
View chart & download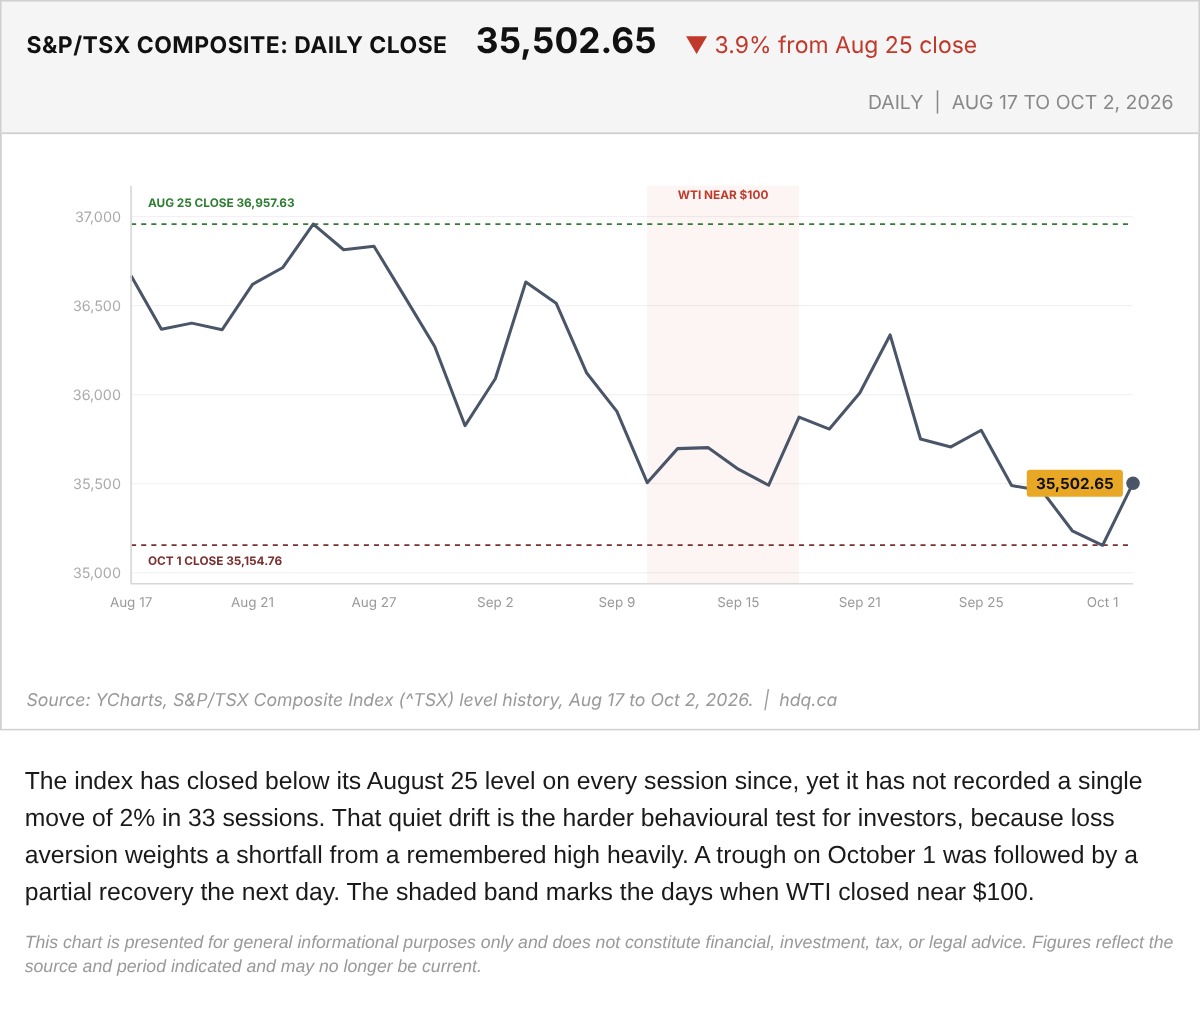
The index has closed below its August 25 level on every session since, yet it has not recorded a single move of 2% in 33 sessions.
S&P/TSX Composite Slide From the August 25 Close, to October 2
October 6, 2026
View chart & download