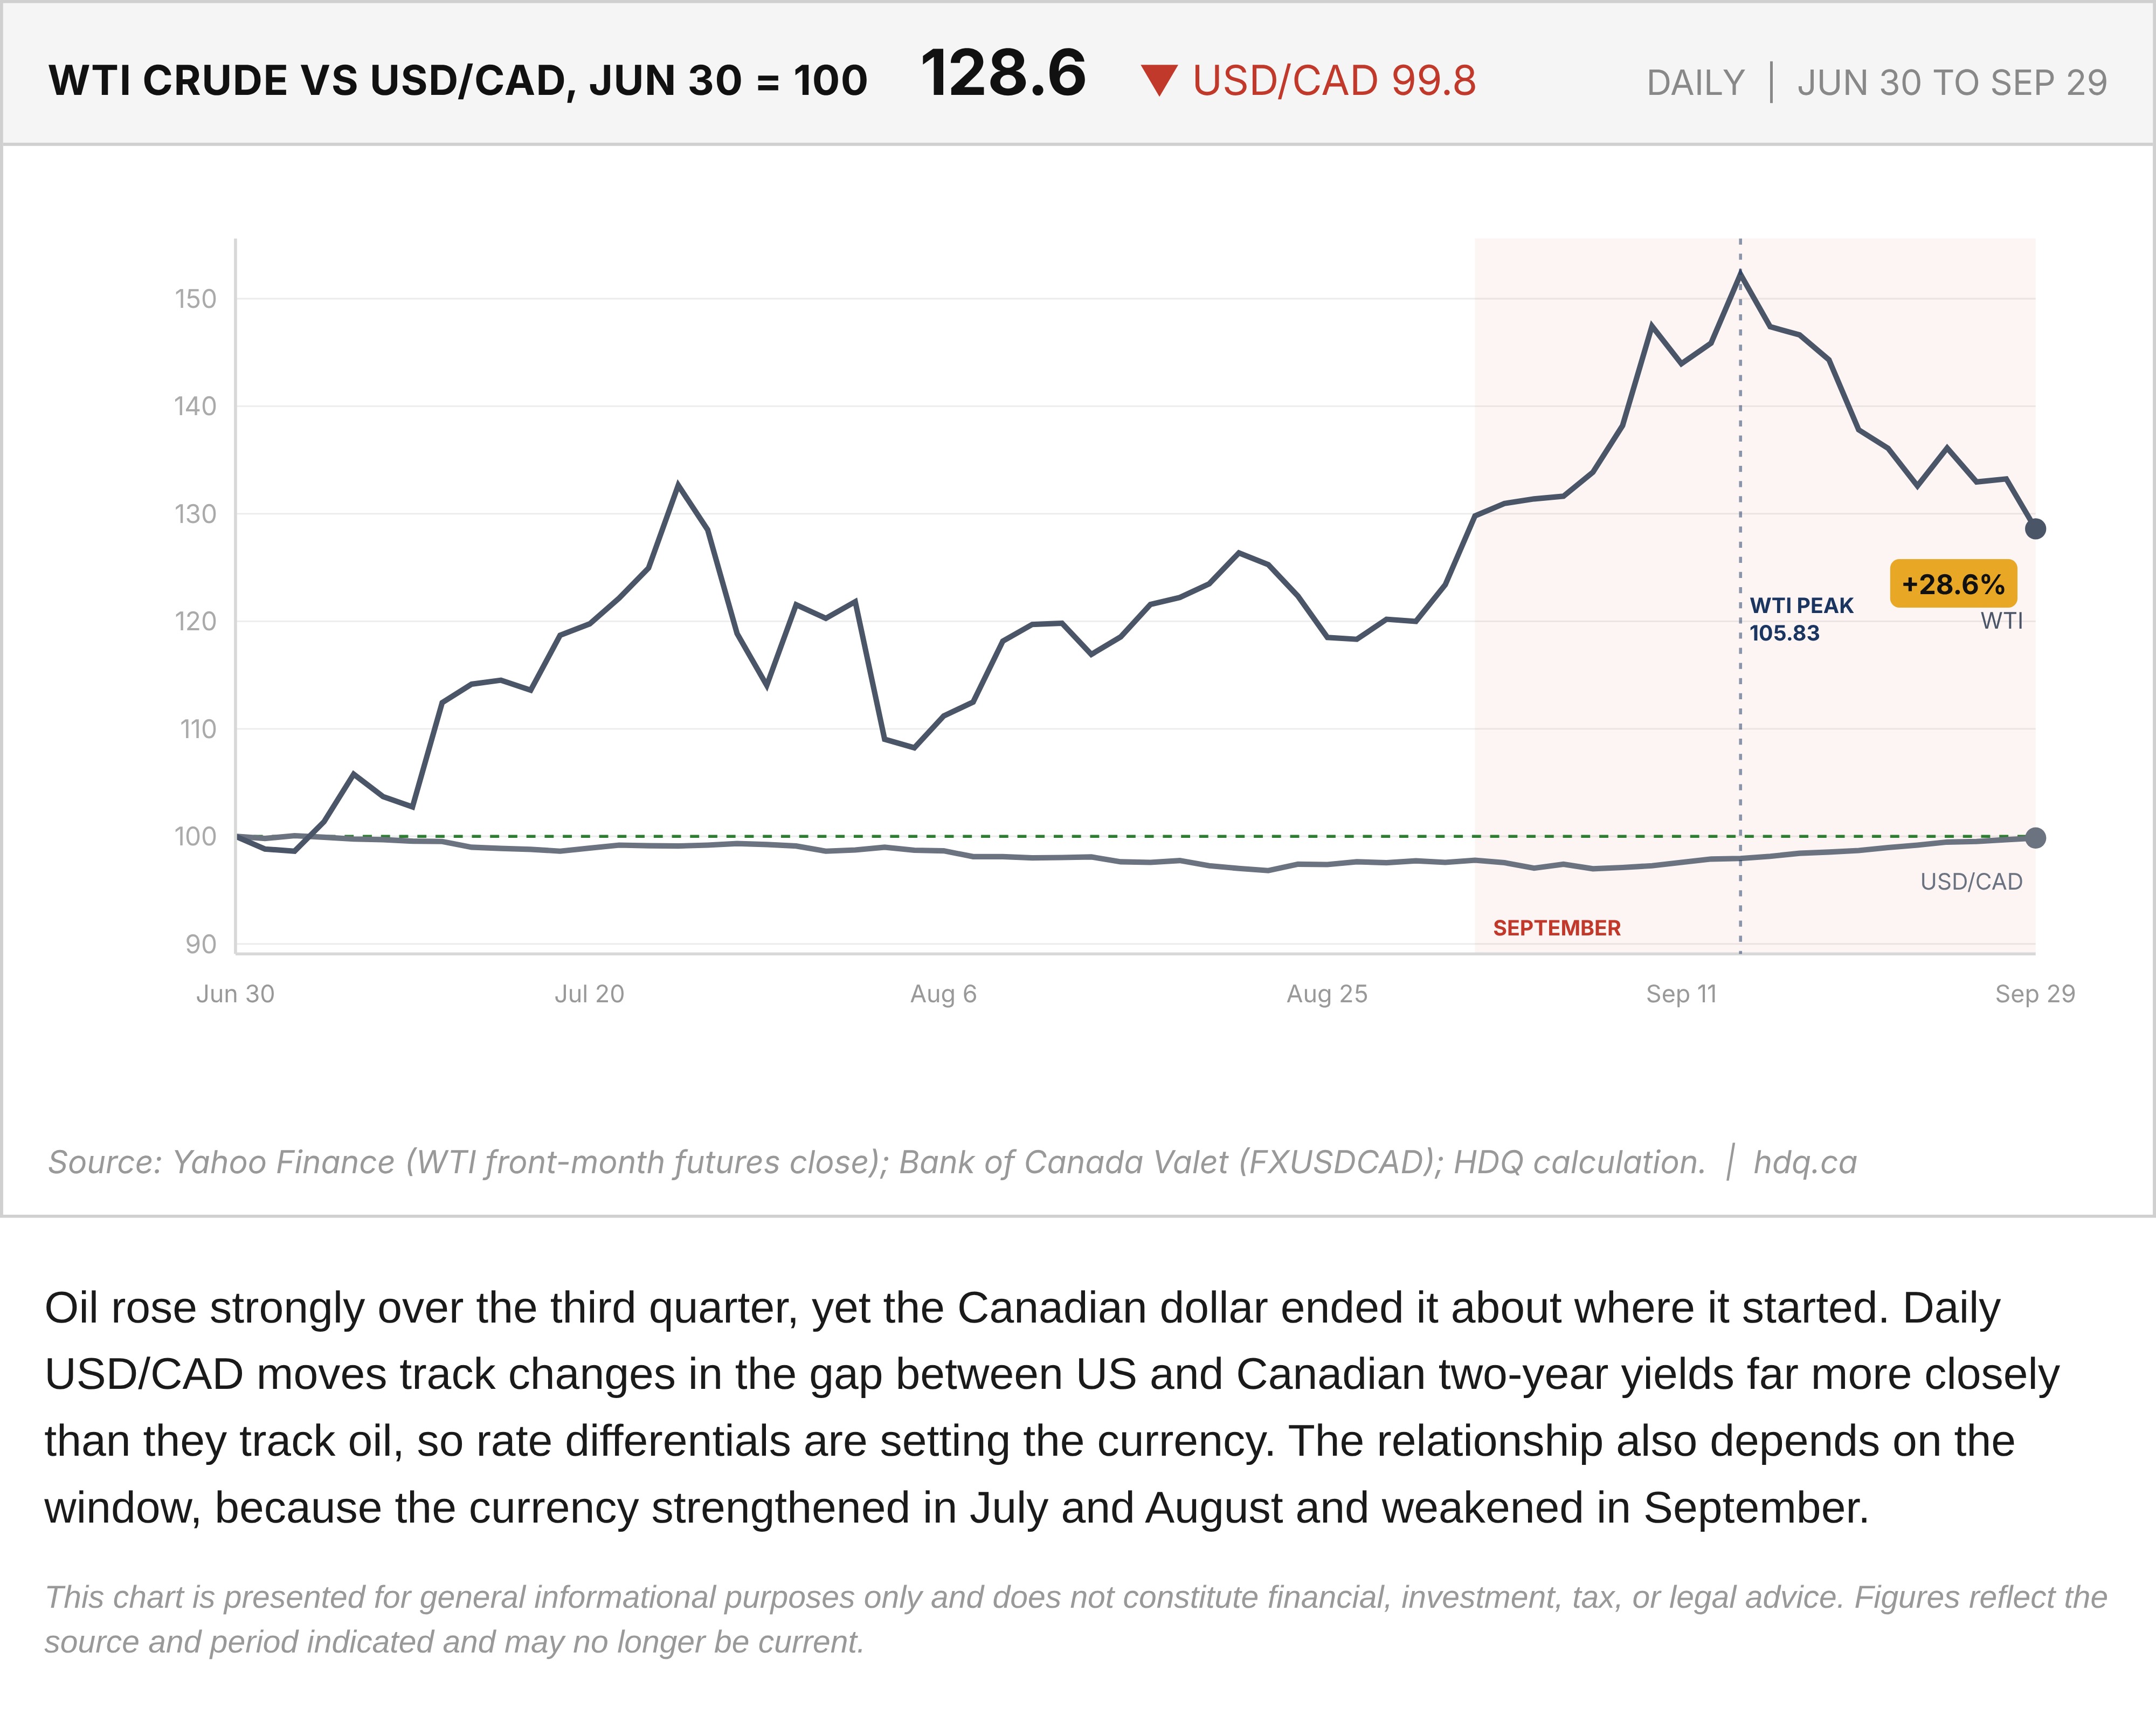
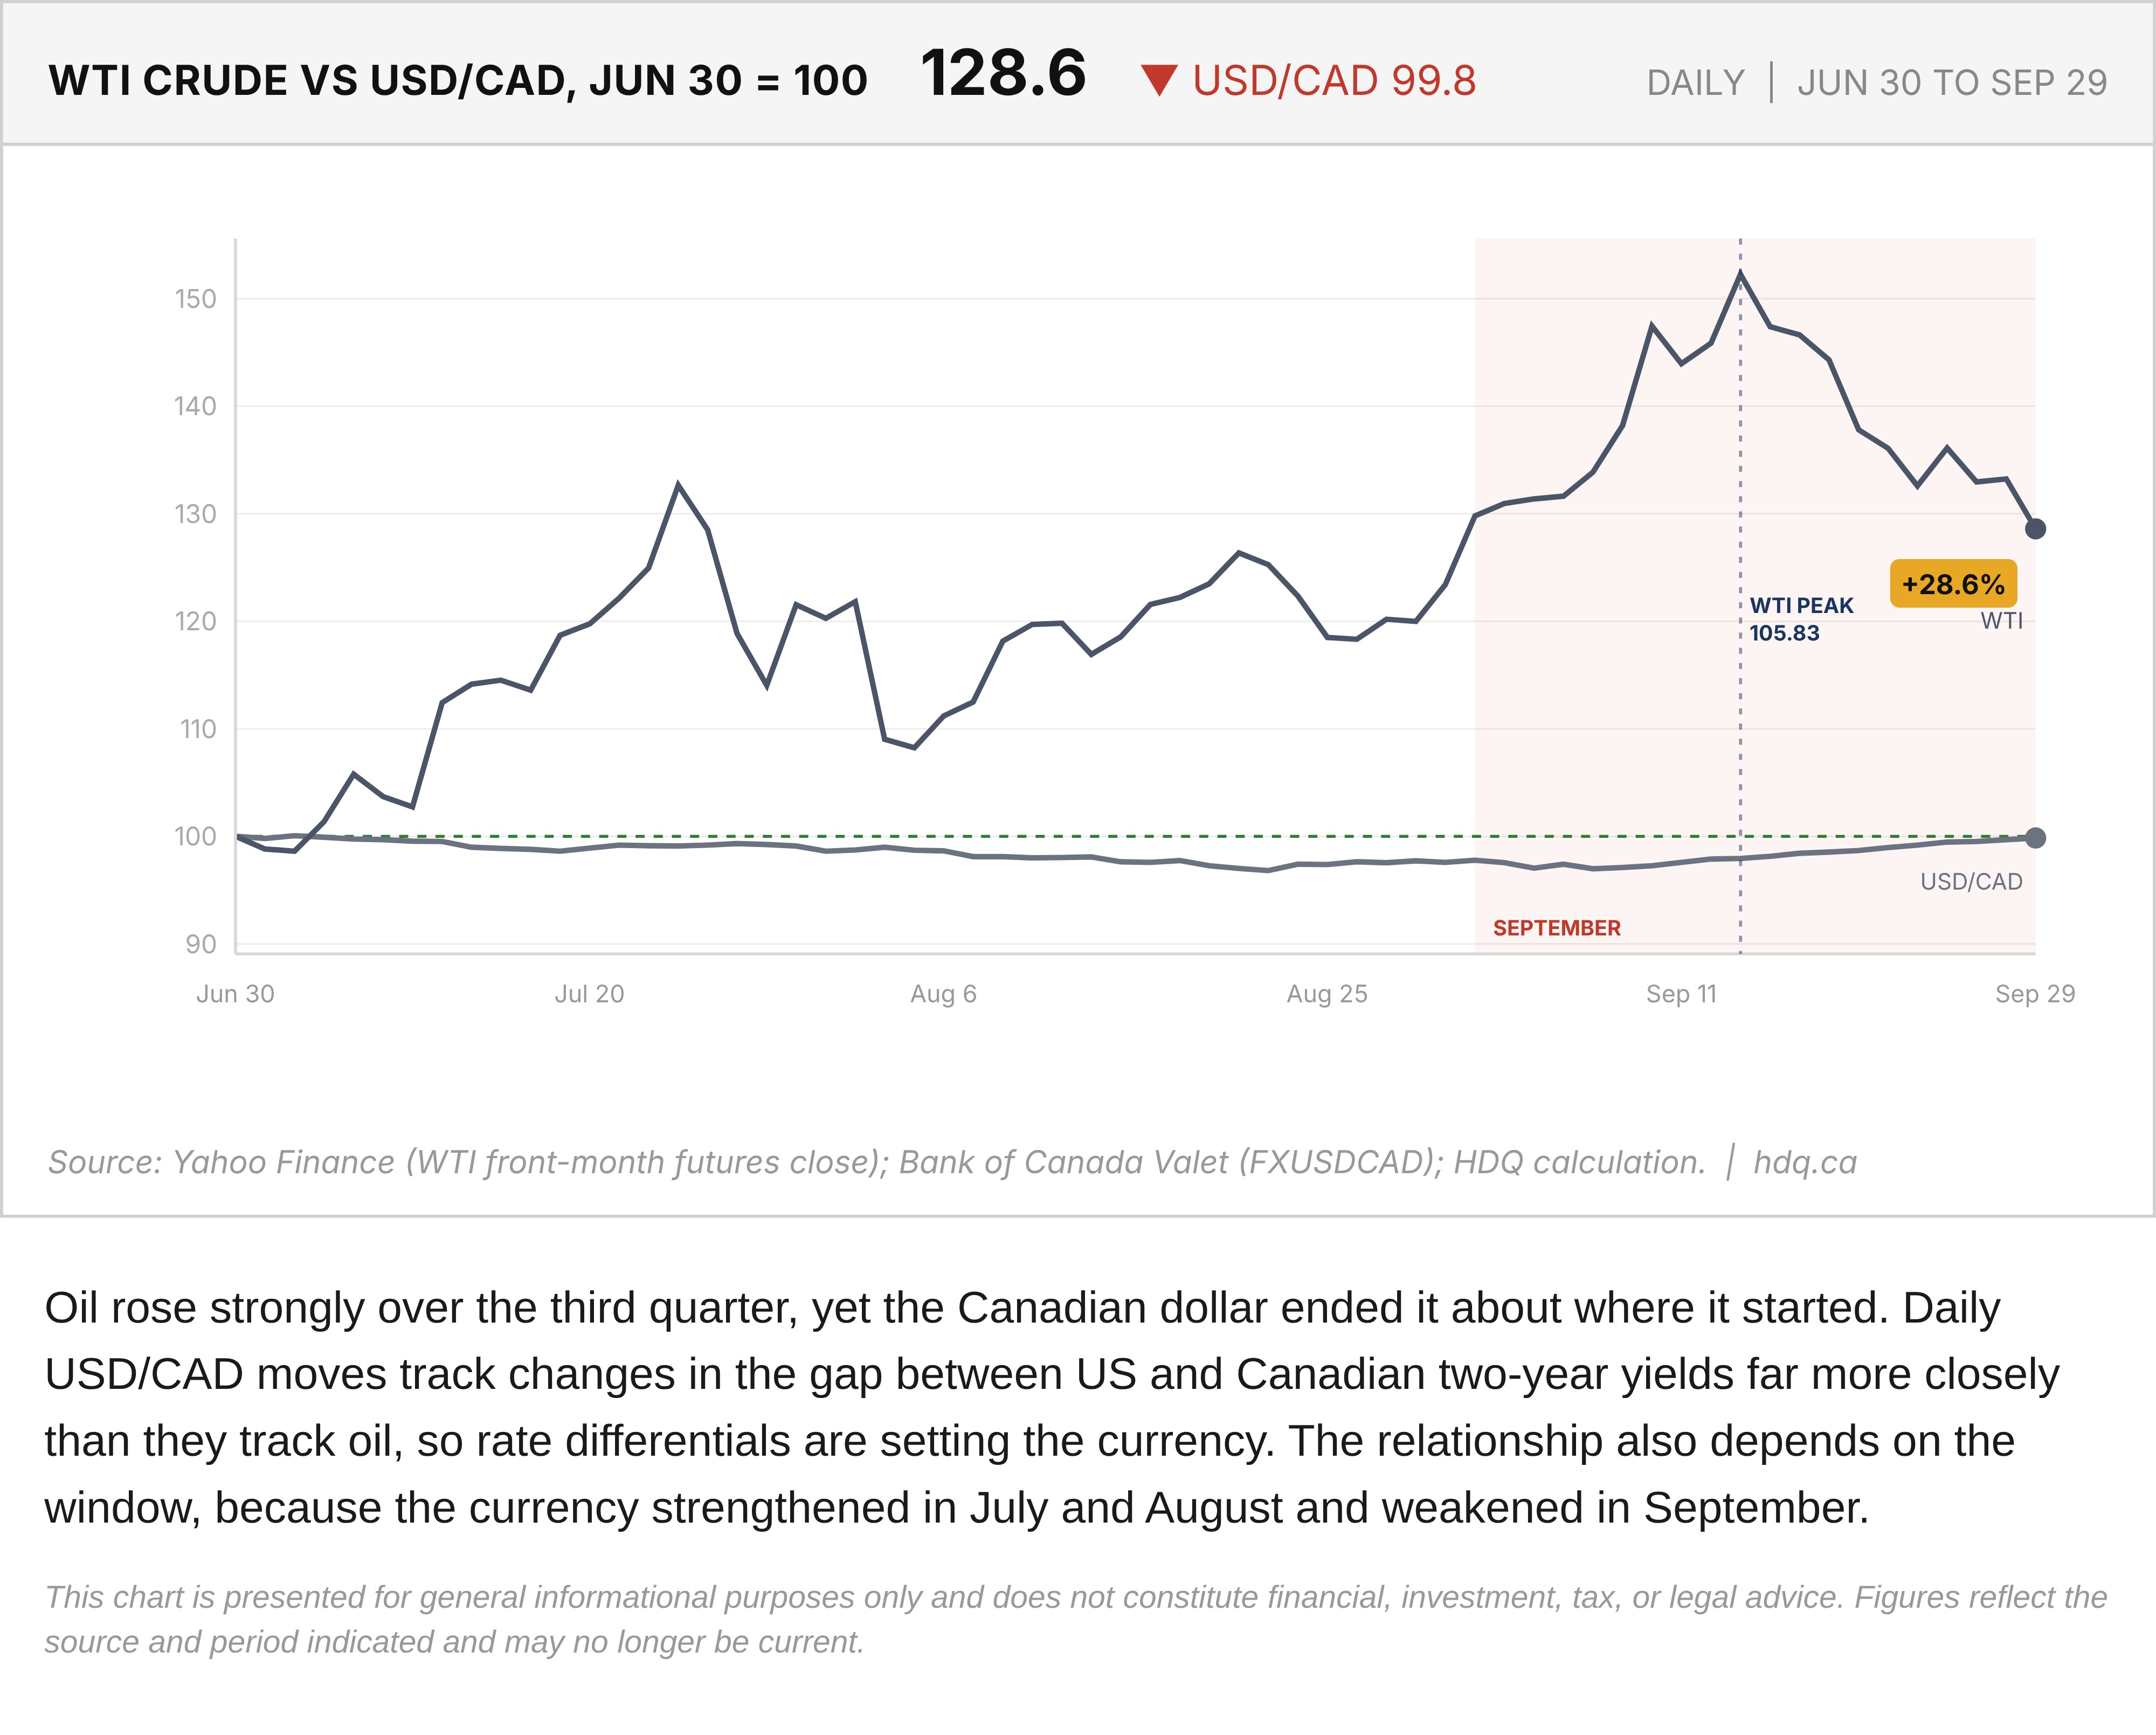
Oil rose strongly over the third quarter, yet the Canadian dollar ended it about where it started. Daily USD/CAD moves track changes in the gap between US and Canadian two-year yields far more closely than they track oil, so rate differentials are setting the currency. The relationship also depends on the window, because the currency strengthened in July and August and weakened in September.
This chart is presented for general informational purposes only and does not constitute financial, investment, tax, or legal advice. Figures reflect the source and period indicated and may no longer be current.
Related charts
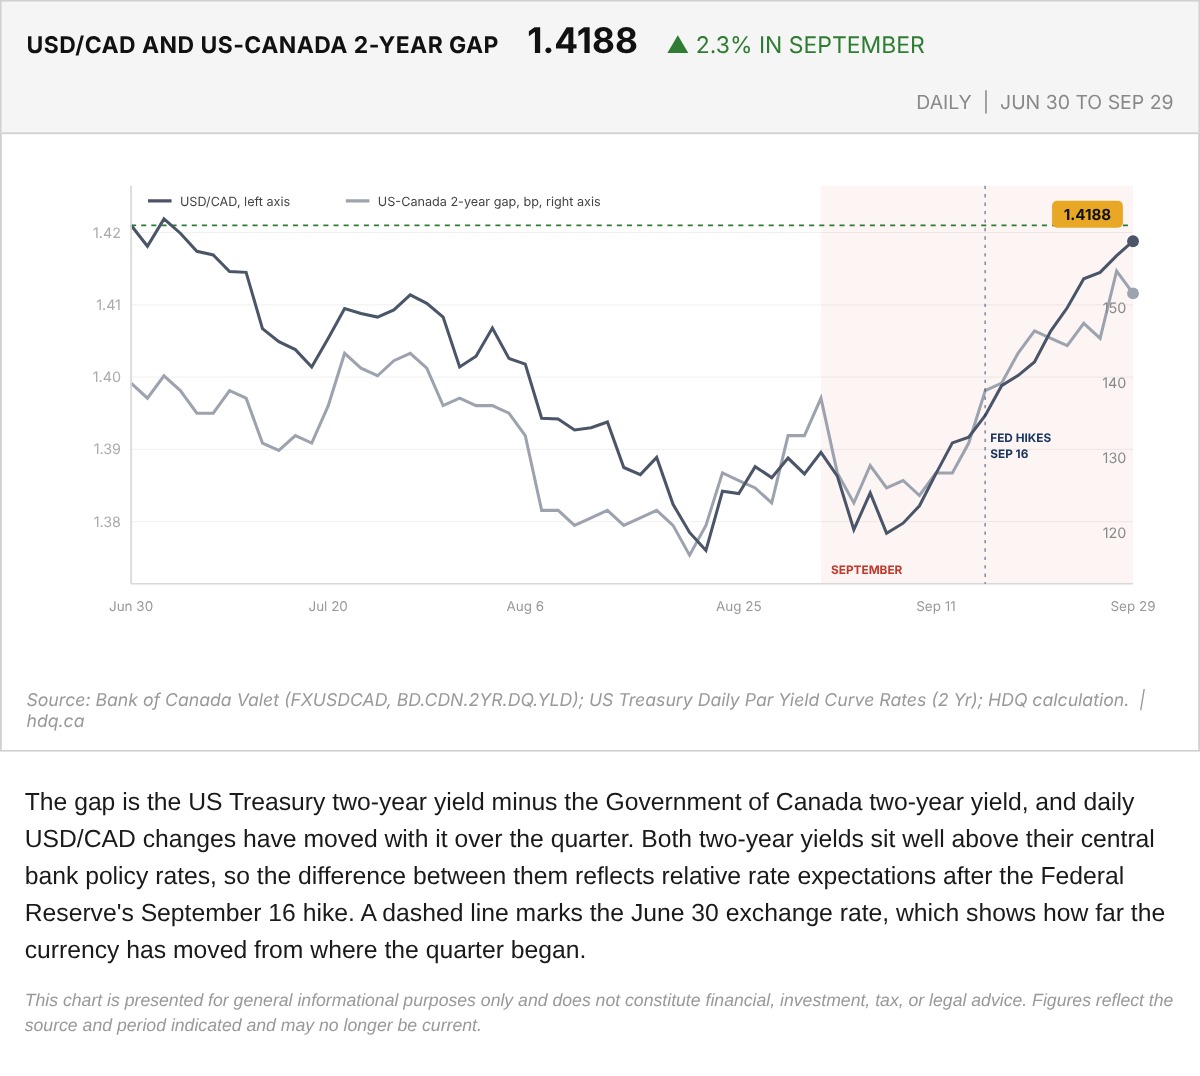
The gap is the US Treasury two-year yield minus the Government of Canada two-year yield, and daily USD/CAD changes have moved with it over the quarter.
USD/CAD and the US-Canada Two-Year Yield Gap, June 30 to September 29, 2026
October 1, 2026
View chart & download
Brent was the only one of the three to finish above its starting level, while the index and gold both fell.
Brent, TSX and Gold Rebased to the August 31 Close
September 30, 2026
View chart & download
The Bank of Canada held its policy rate at 2.25% for a seventh straight time, yet Canadian yields rose as United States yields surged.
Government of Canada Benchmark Yields, September 2026
September 30, 2026
View chart & download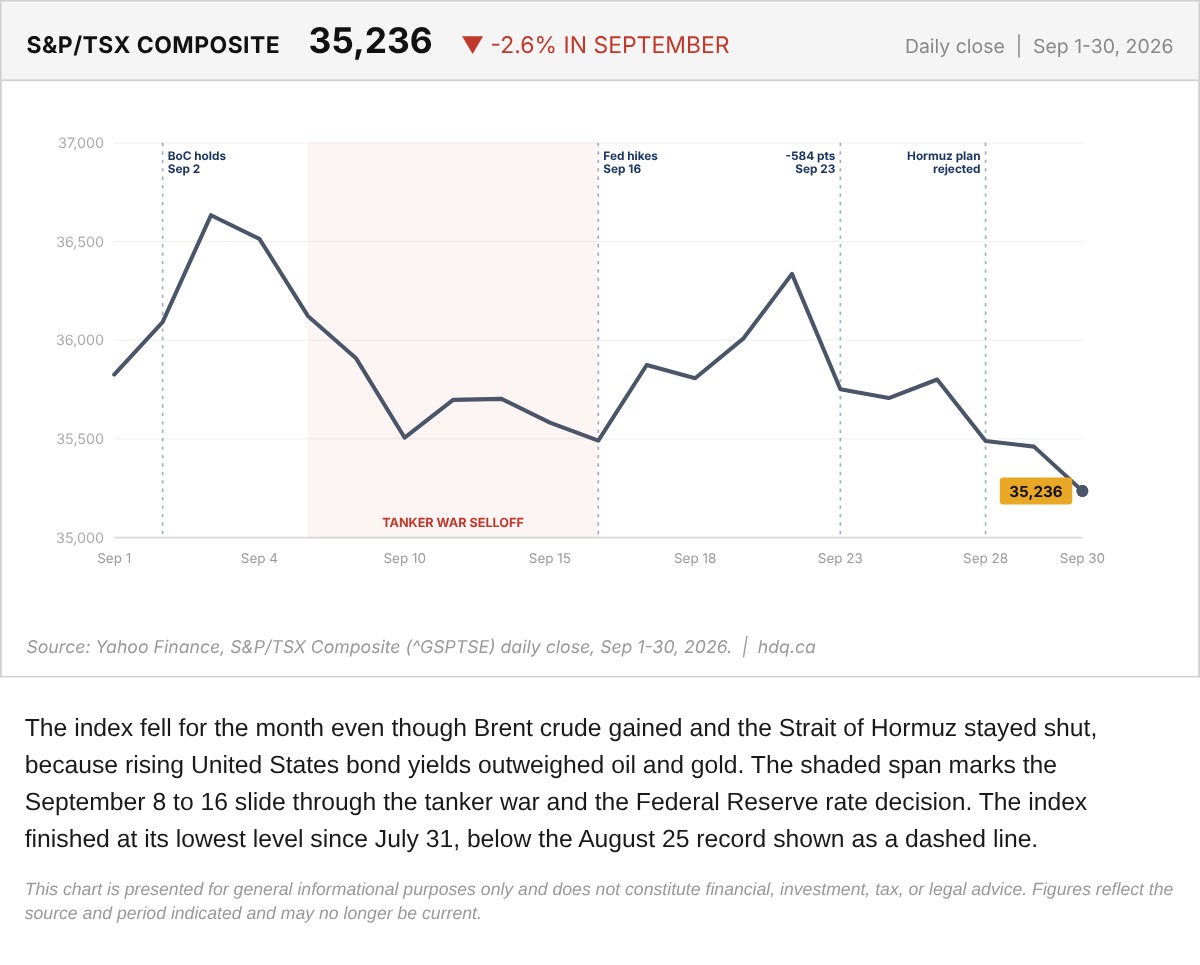
The index fell for the month even though Brent crude gained and the Strait of Hormuz stayed shut, because rising United States bond yields outweighed oil and gold.
S&P/TSX Composite Daily Close Through September 2026
September 30, 2026
View chart & download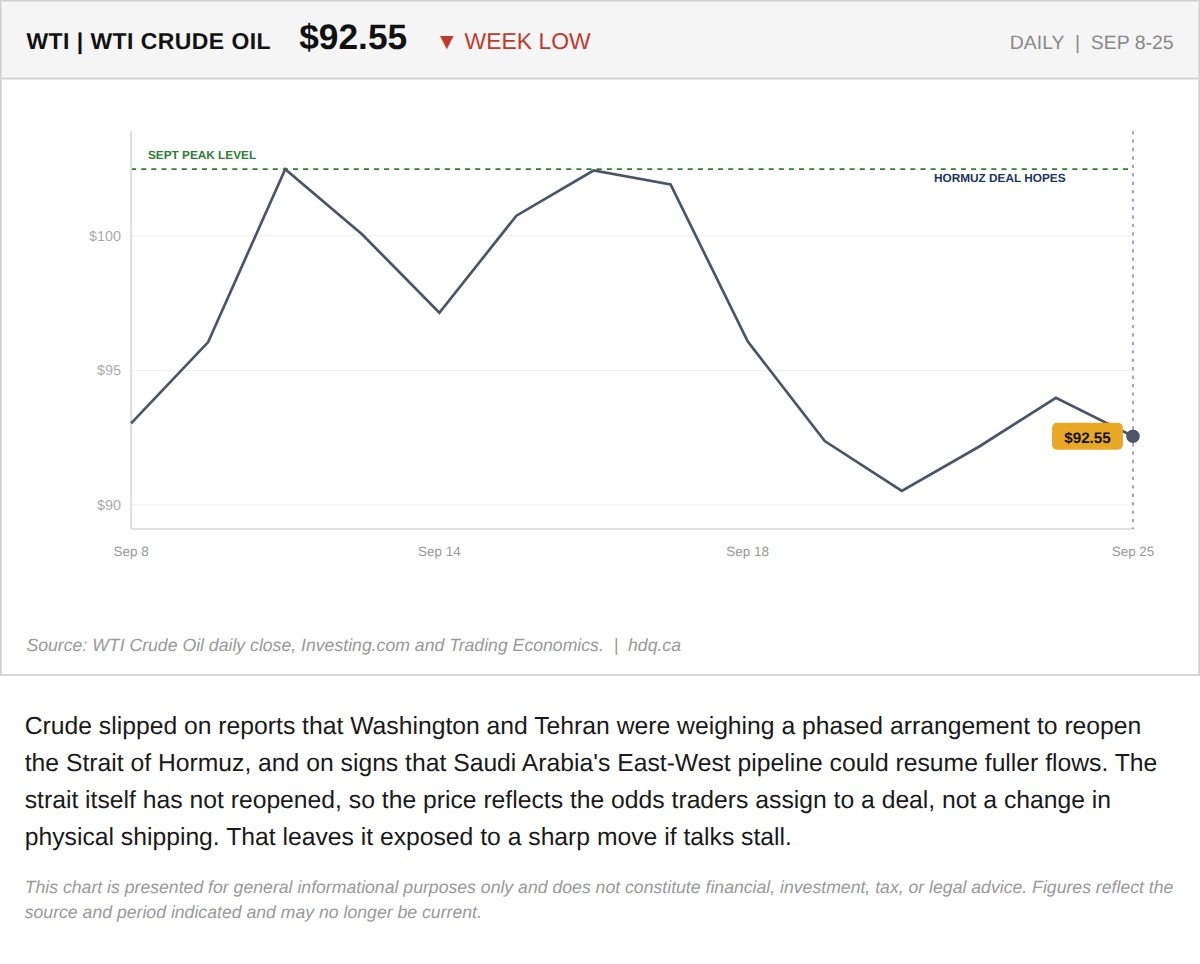
Crude slipped on reports that Washington and Tehran were weighing a phased arrangement to reopen the Strait of Hormuz, and on signs that…
WTI Crude Slips to a Weekly Low on Hormuz Deal Reports
September 25, 2026
View chart & download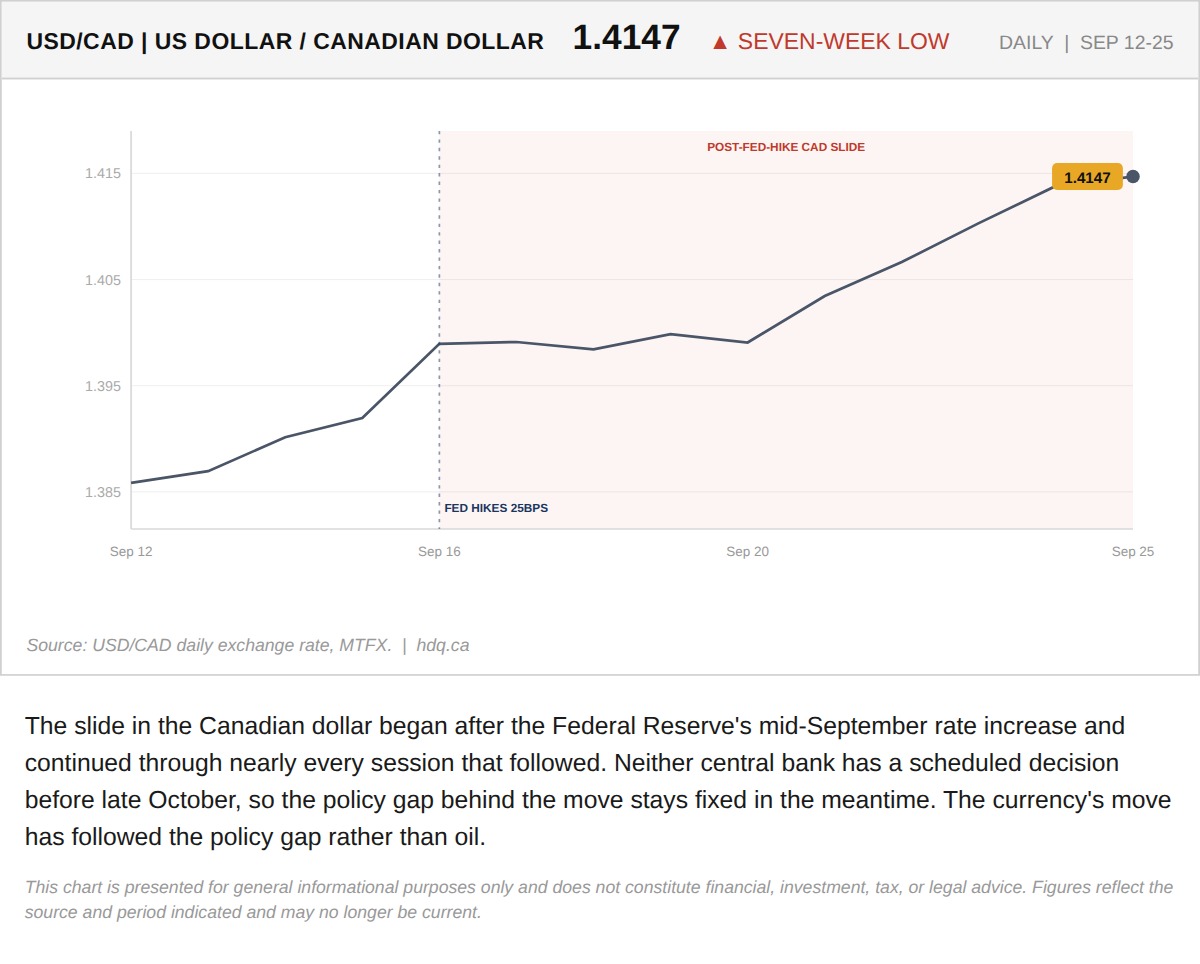
The slide in the Canadian dollar began after the Federal Reserve's mid-September rate increase and continued through nearly every session that followed.
USD/CAD Climbs to a Seven-Week High Since the Fed Hike
September 25, 2026
View chart & download