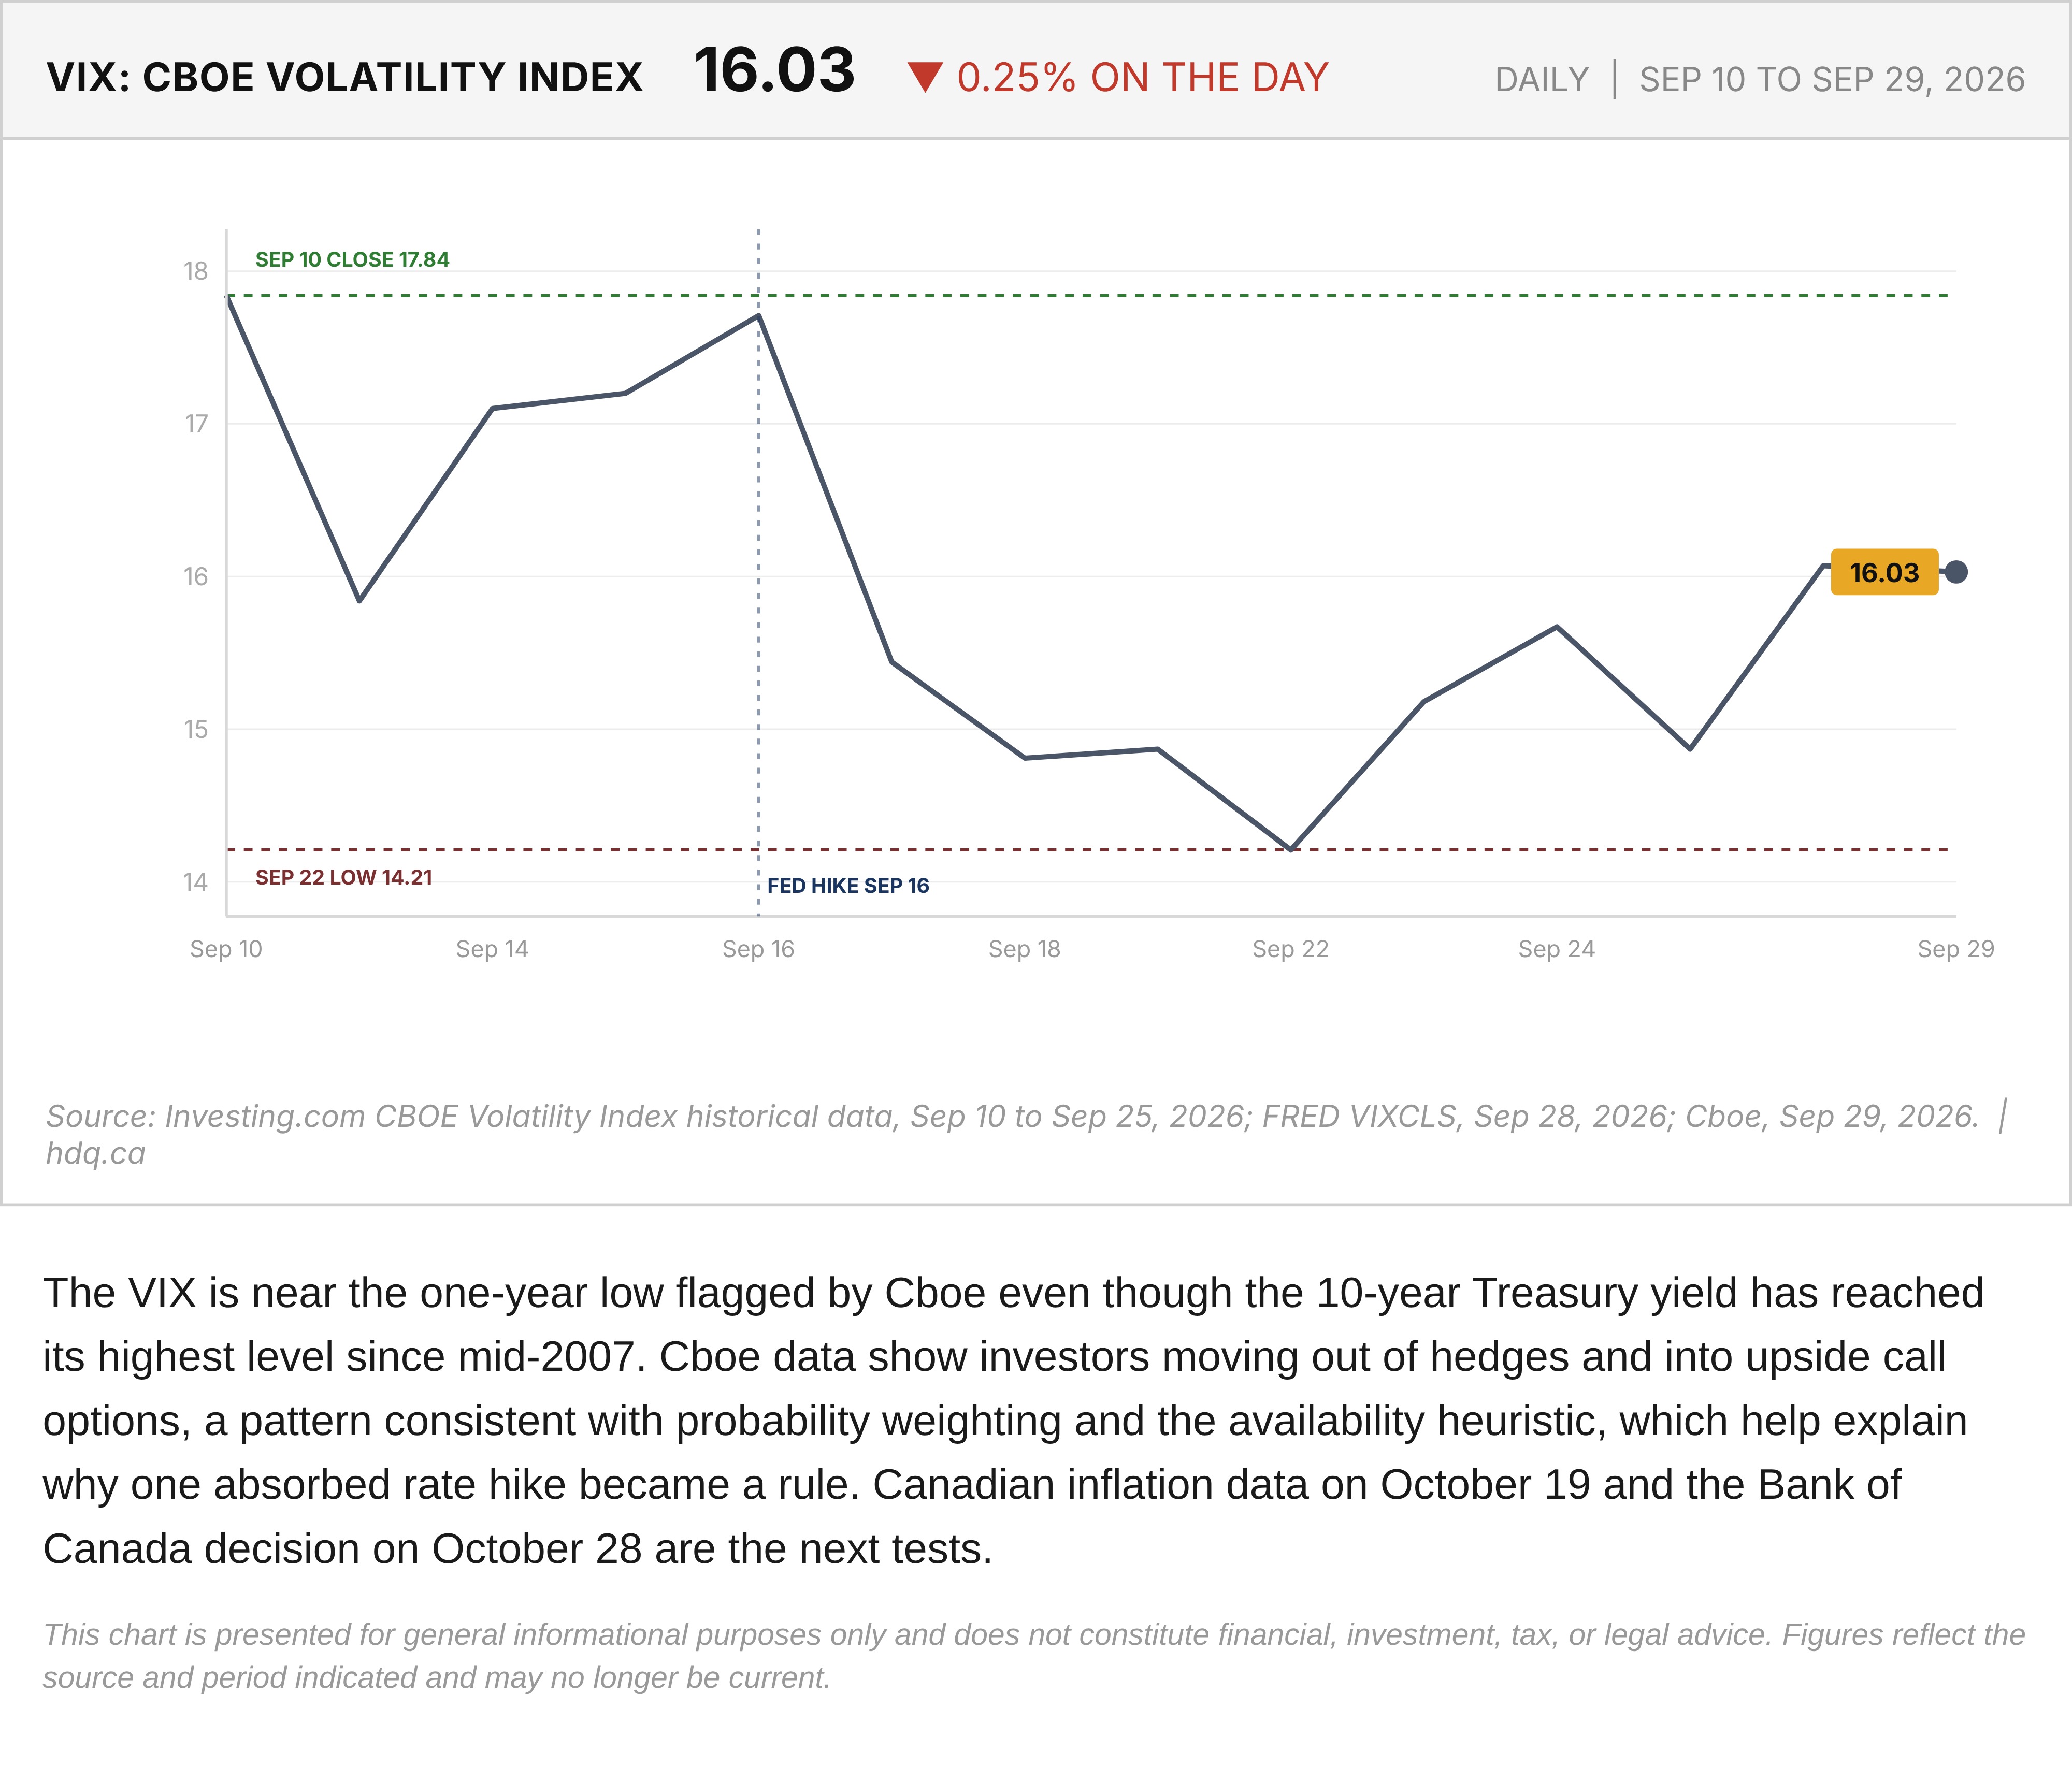
The VIX is near the one-year low flagged by Cboe even though the 10-year Treasury yield has reached its highest level since mid-2007. Cboe data show investors moving out of hedges and into upside call options, a pattern consistent with probability weighting and the availability heuristic, which help explain why one absorbed rate hike became a rule. Canadian inflation data on October 19 and the Bank of Canada decision on October 28 are the next tests.
This chart is presented for general informational purposes only and does not constitute financial, investment, tax, or legal advice. Figures reflect the source and period indicated and may no longer be current.
Related charts
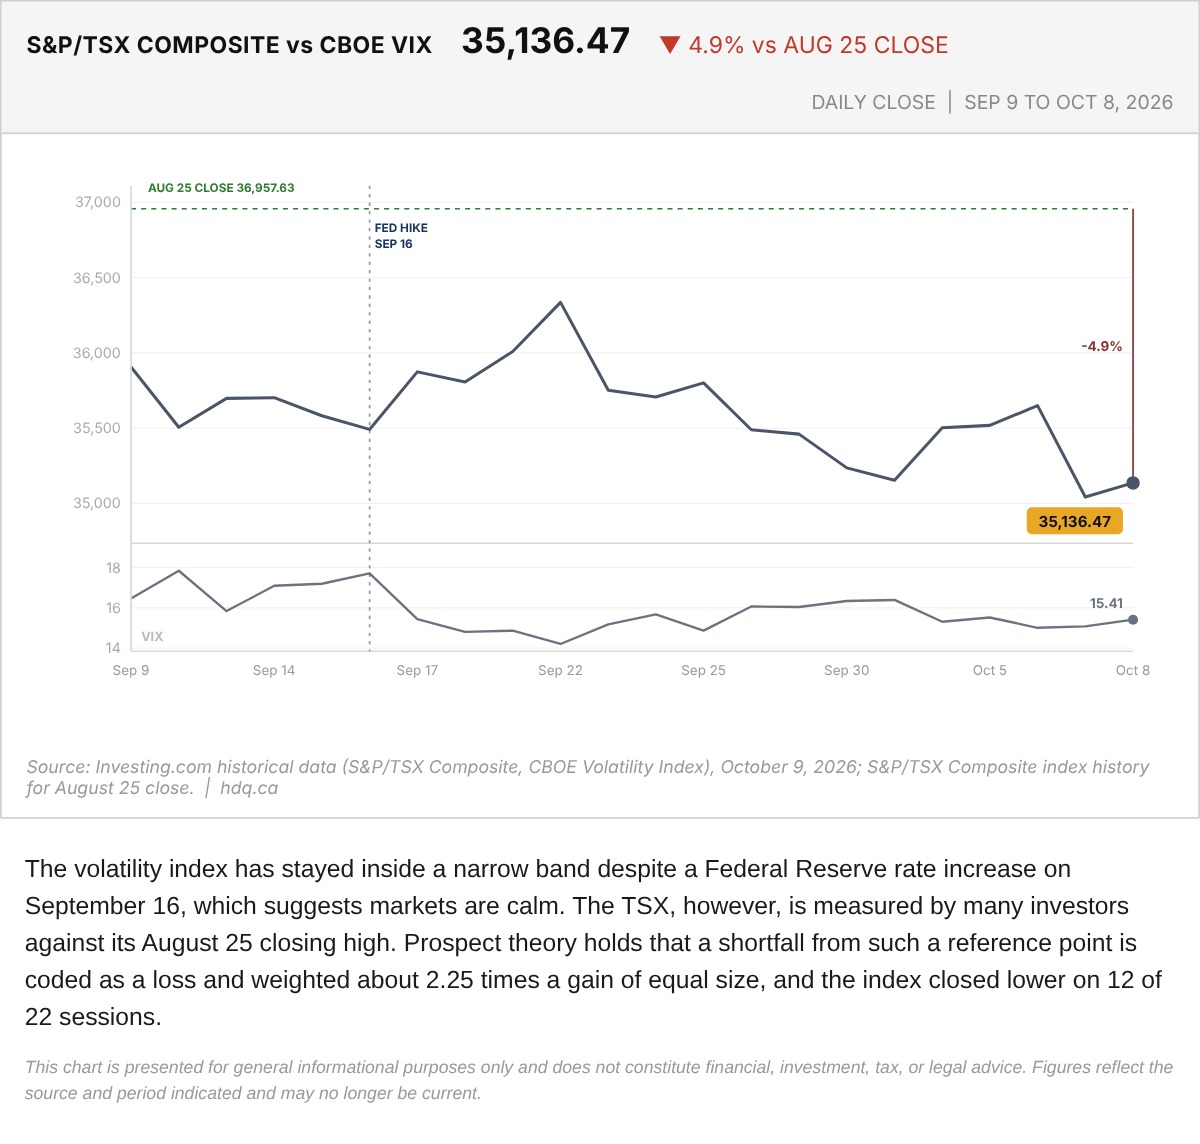
The volatility index has stayed inside a narrow band despite a Federal Reserve rate increase on September 16, which suggests markets are calm.
S&P/TSX Composite Against the Cboe VIX, September 9 to October 8
October 9, 2026
View chart & download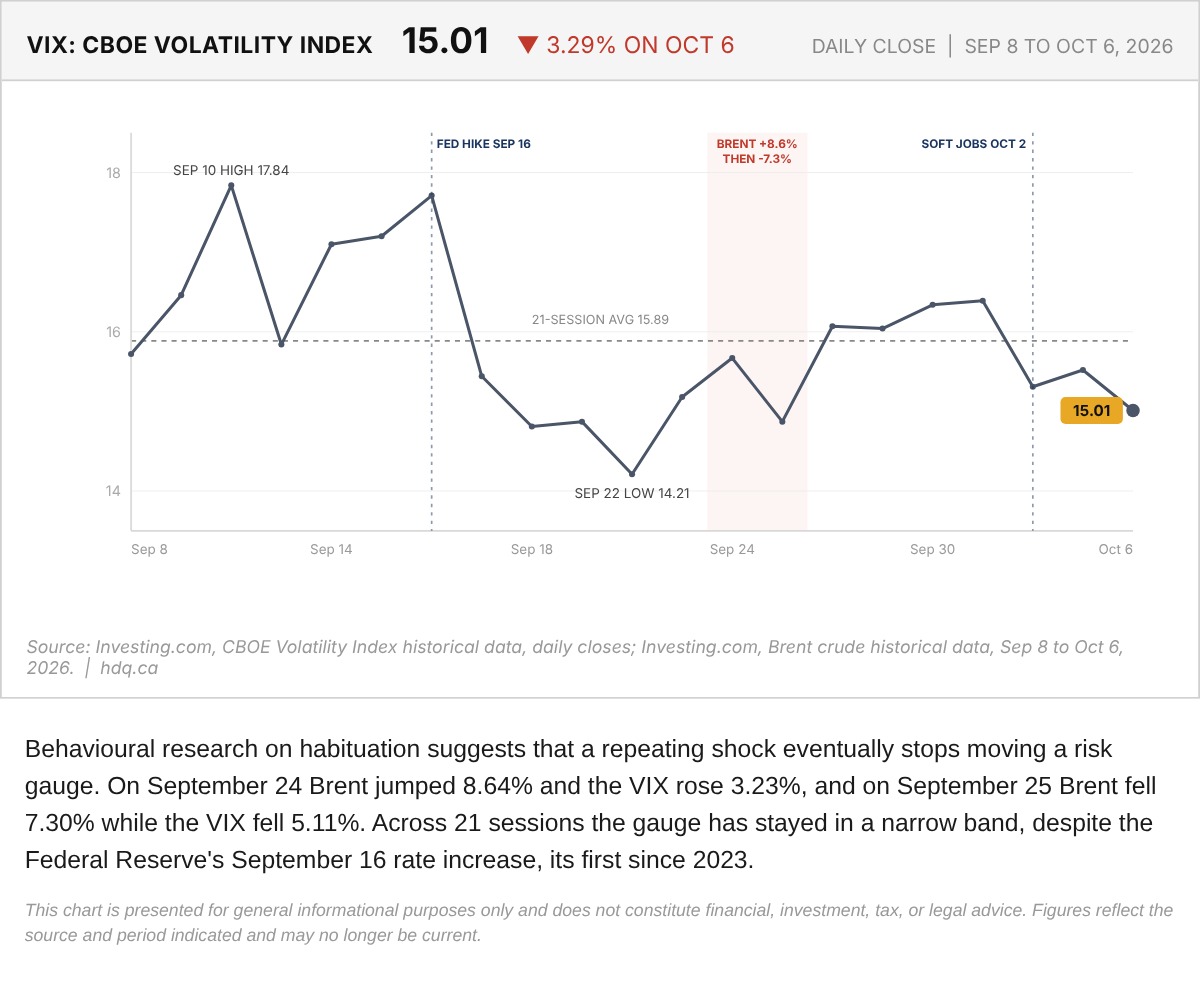
Behavioural research on habituation suggests that a repeating shock eventually stops moving a risk gauge.
VIX Daily Close and Habituation to Oil Shocks, September 8 to October 6
October 7, 2026
View chart & download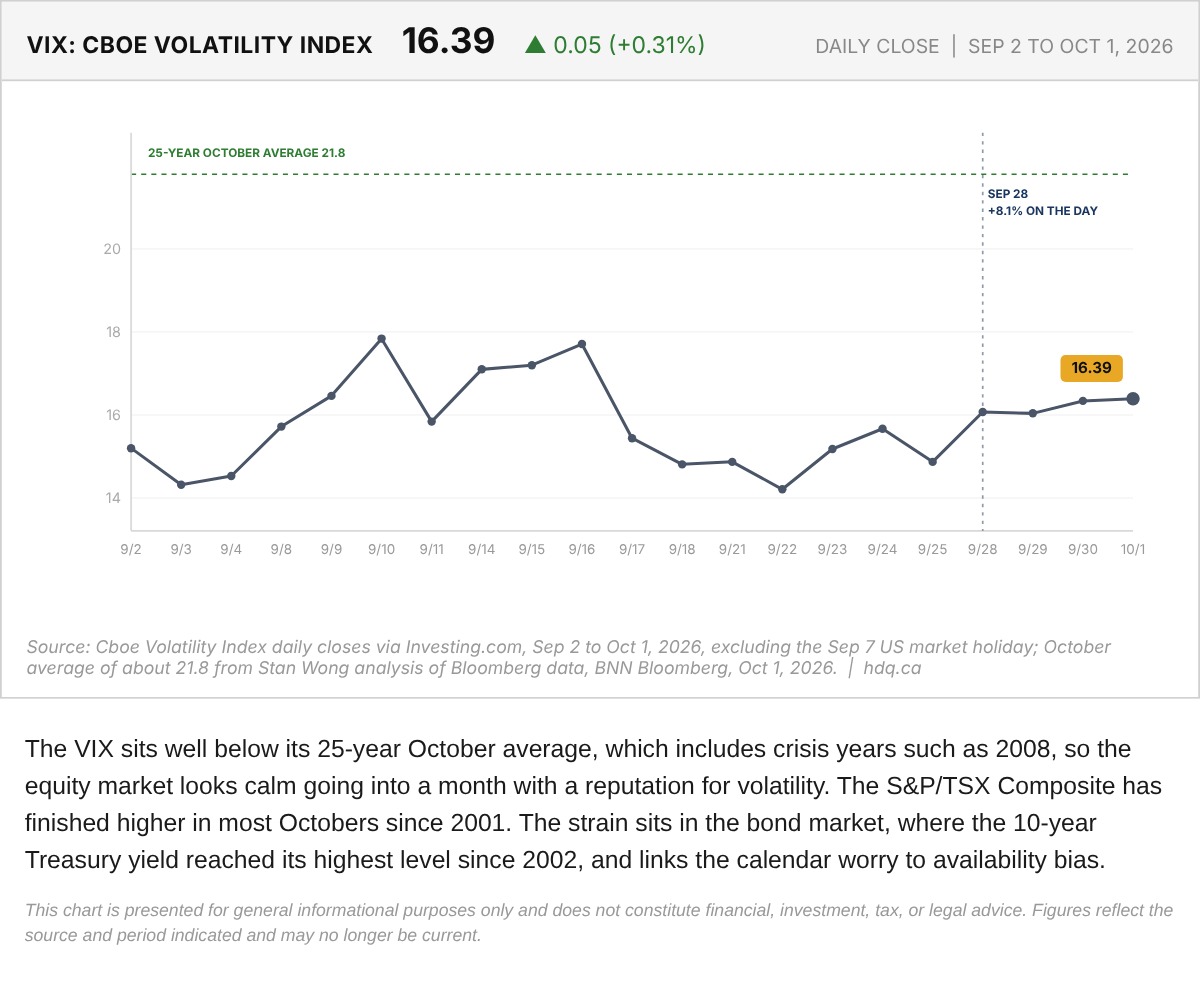
The VIX sits well below its 25-year October average, which includes crisis years such as 2008, so the equity market looks calm going into a month with a reputation for volatility.
Cboe Volatility Index (VIX) and the October Average, September 2 to October 1, 2026
October 2, 2026
View chart & download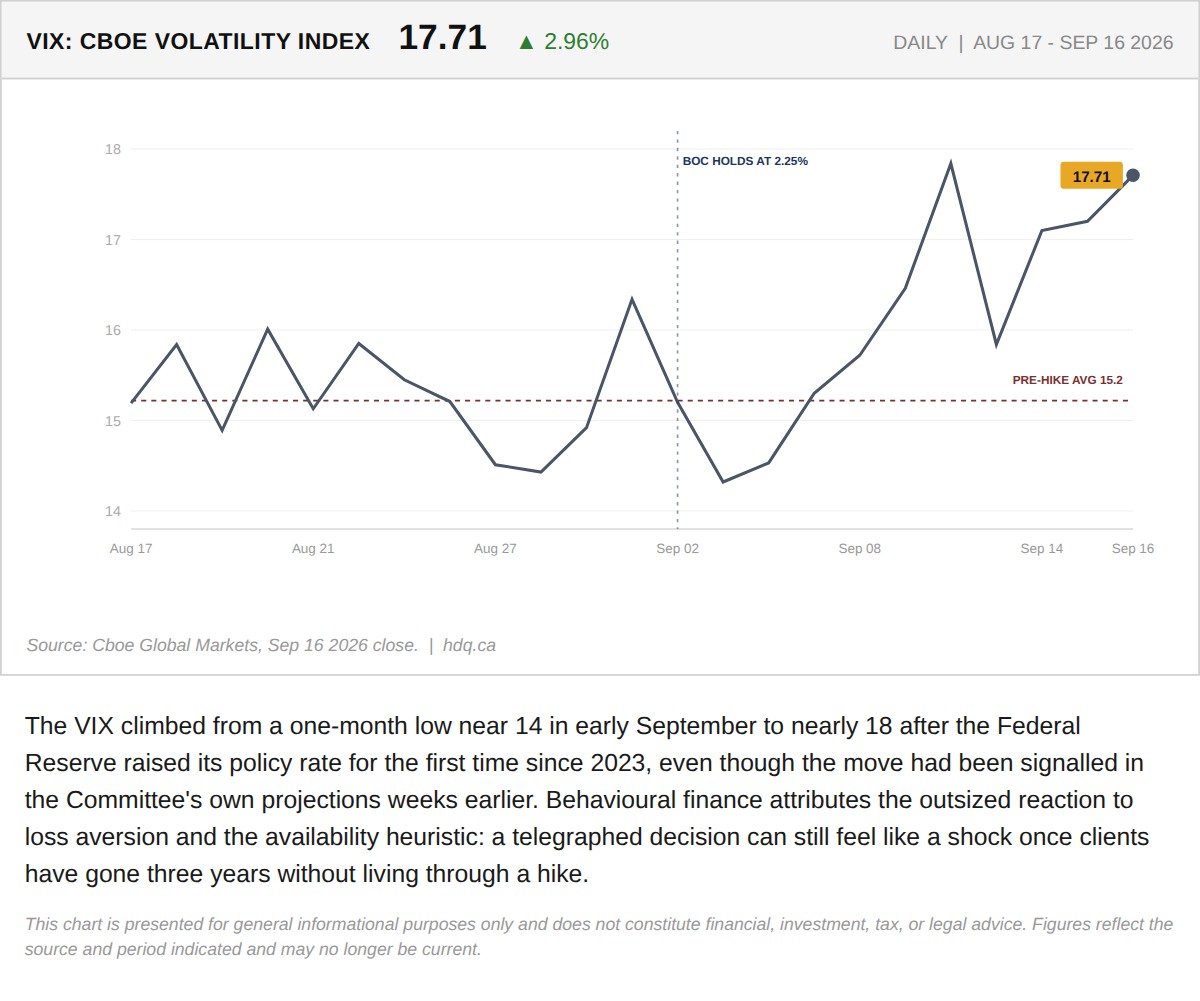
The VIX climbed from a one-month low near 14 in early September to nearly 18 after the Federal Reserve raised its policy rate for the first…
Why an Expected Rate Hike Still Triggered a 631-Point Selloff
September 17, 2026
View chart & download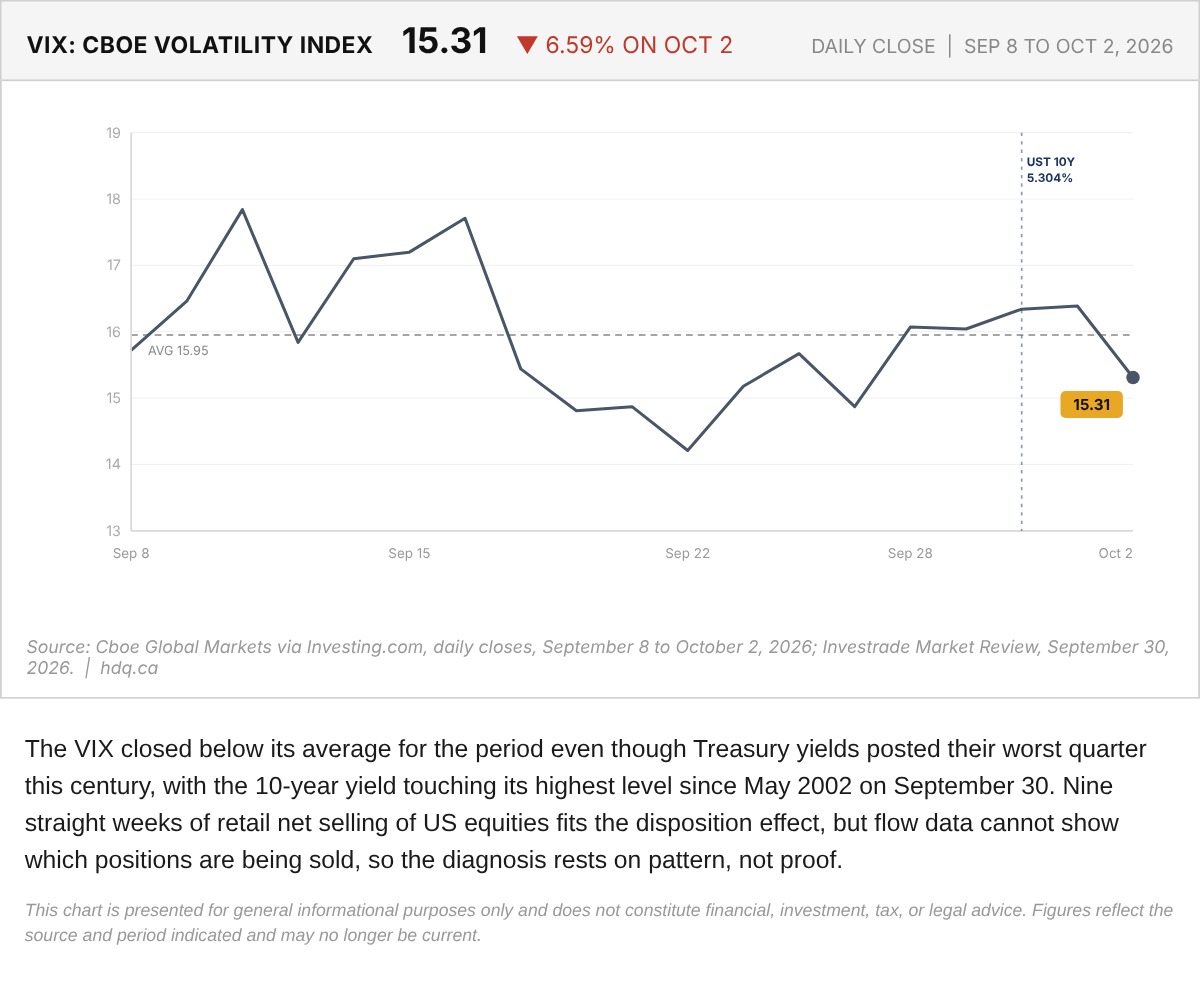
The VIX closed below its average for the period even though Treasury yields posted their worst quarter this century, with the 10-year yield…
Cboe Volatility Index (VIX), September 8 to October 2, 2026
October 5, 2026
View chart & download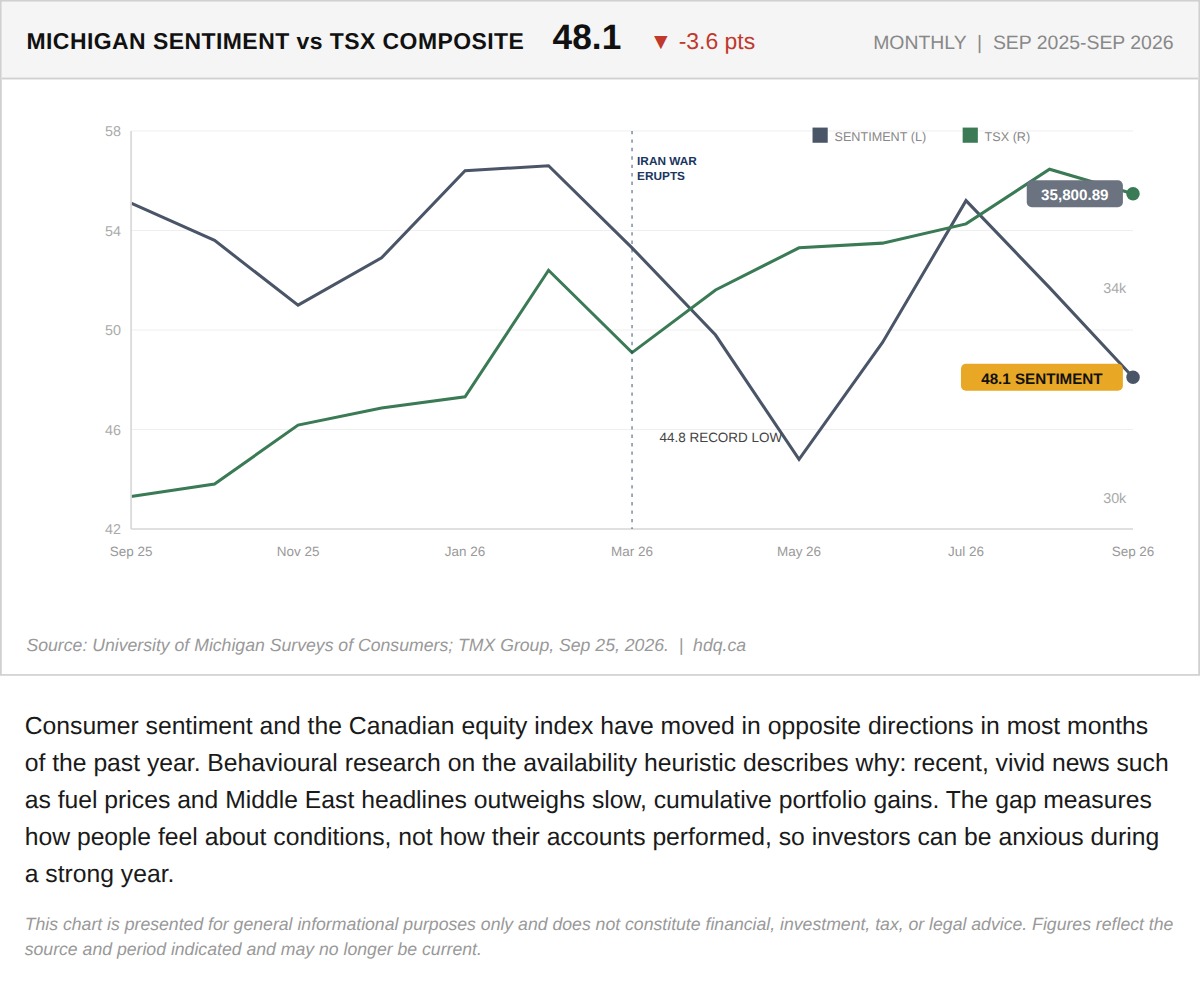
Consumer sentiment and the Canadian equity index have moved in opposite directions in most months of the past year.
Consumer Sentiment Falls While the TSX Rises
September 28, 2026
View chart & download