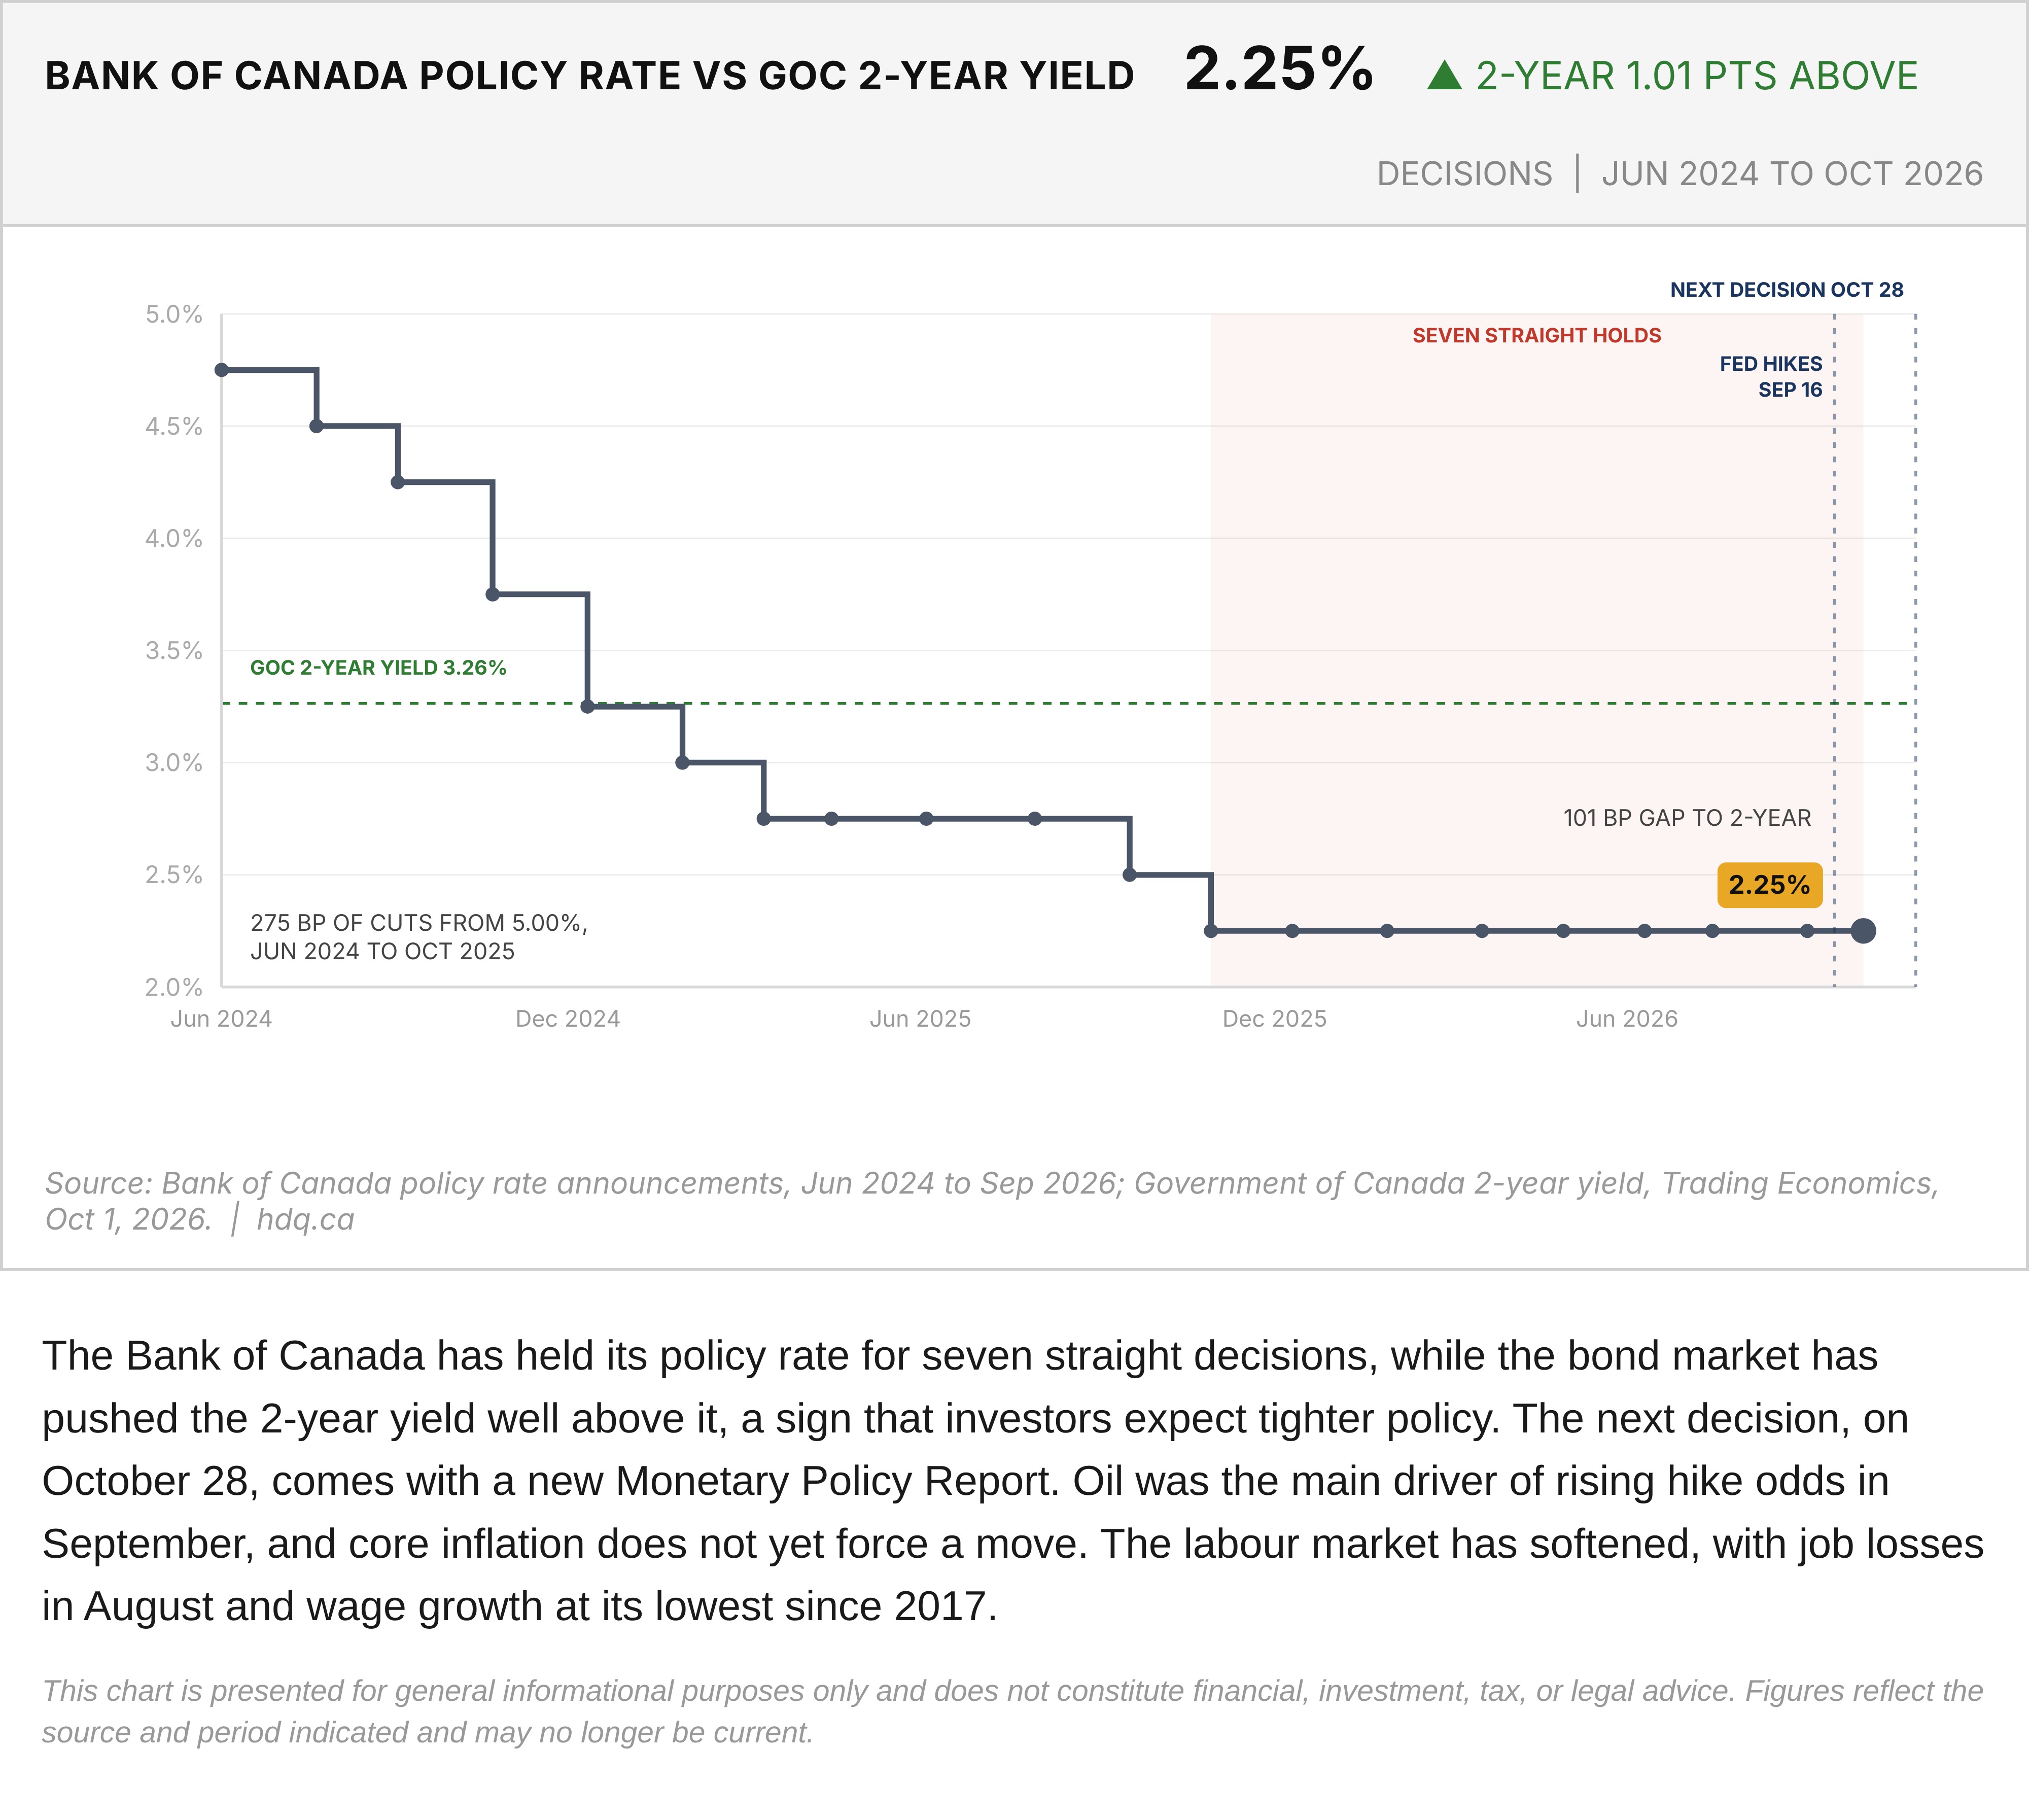
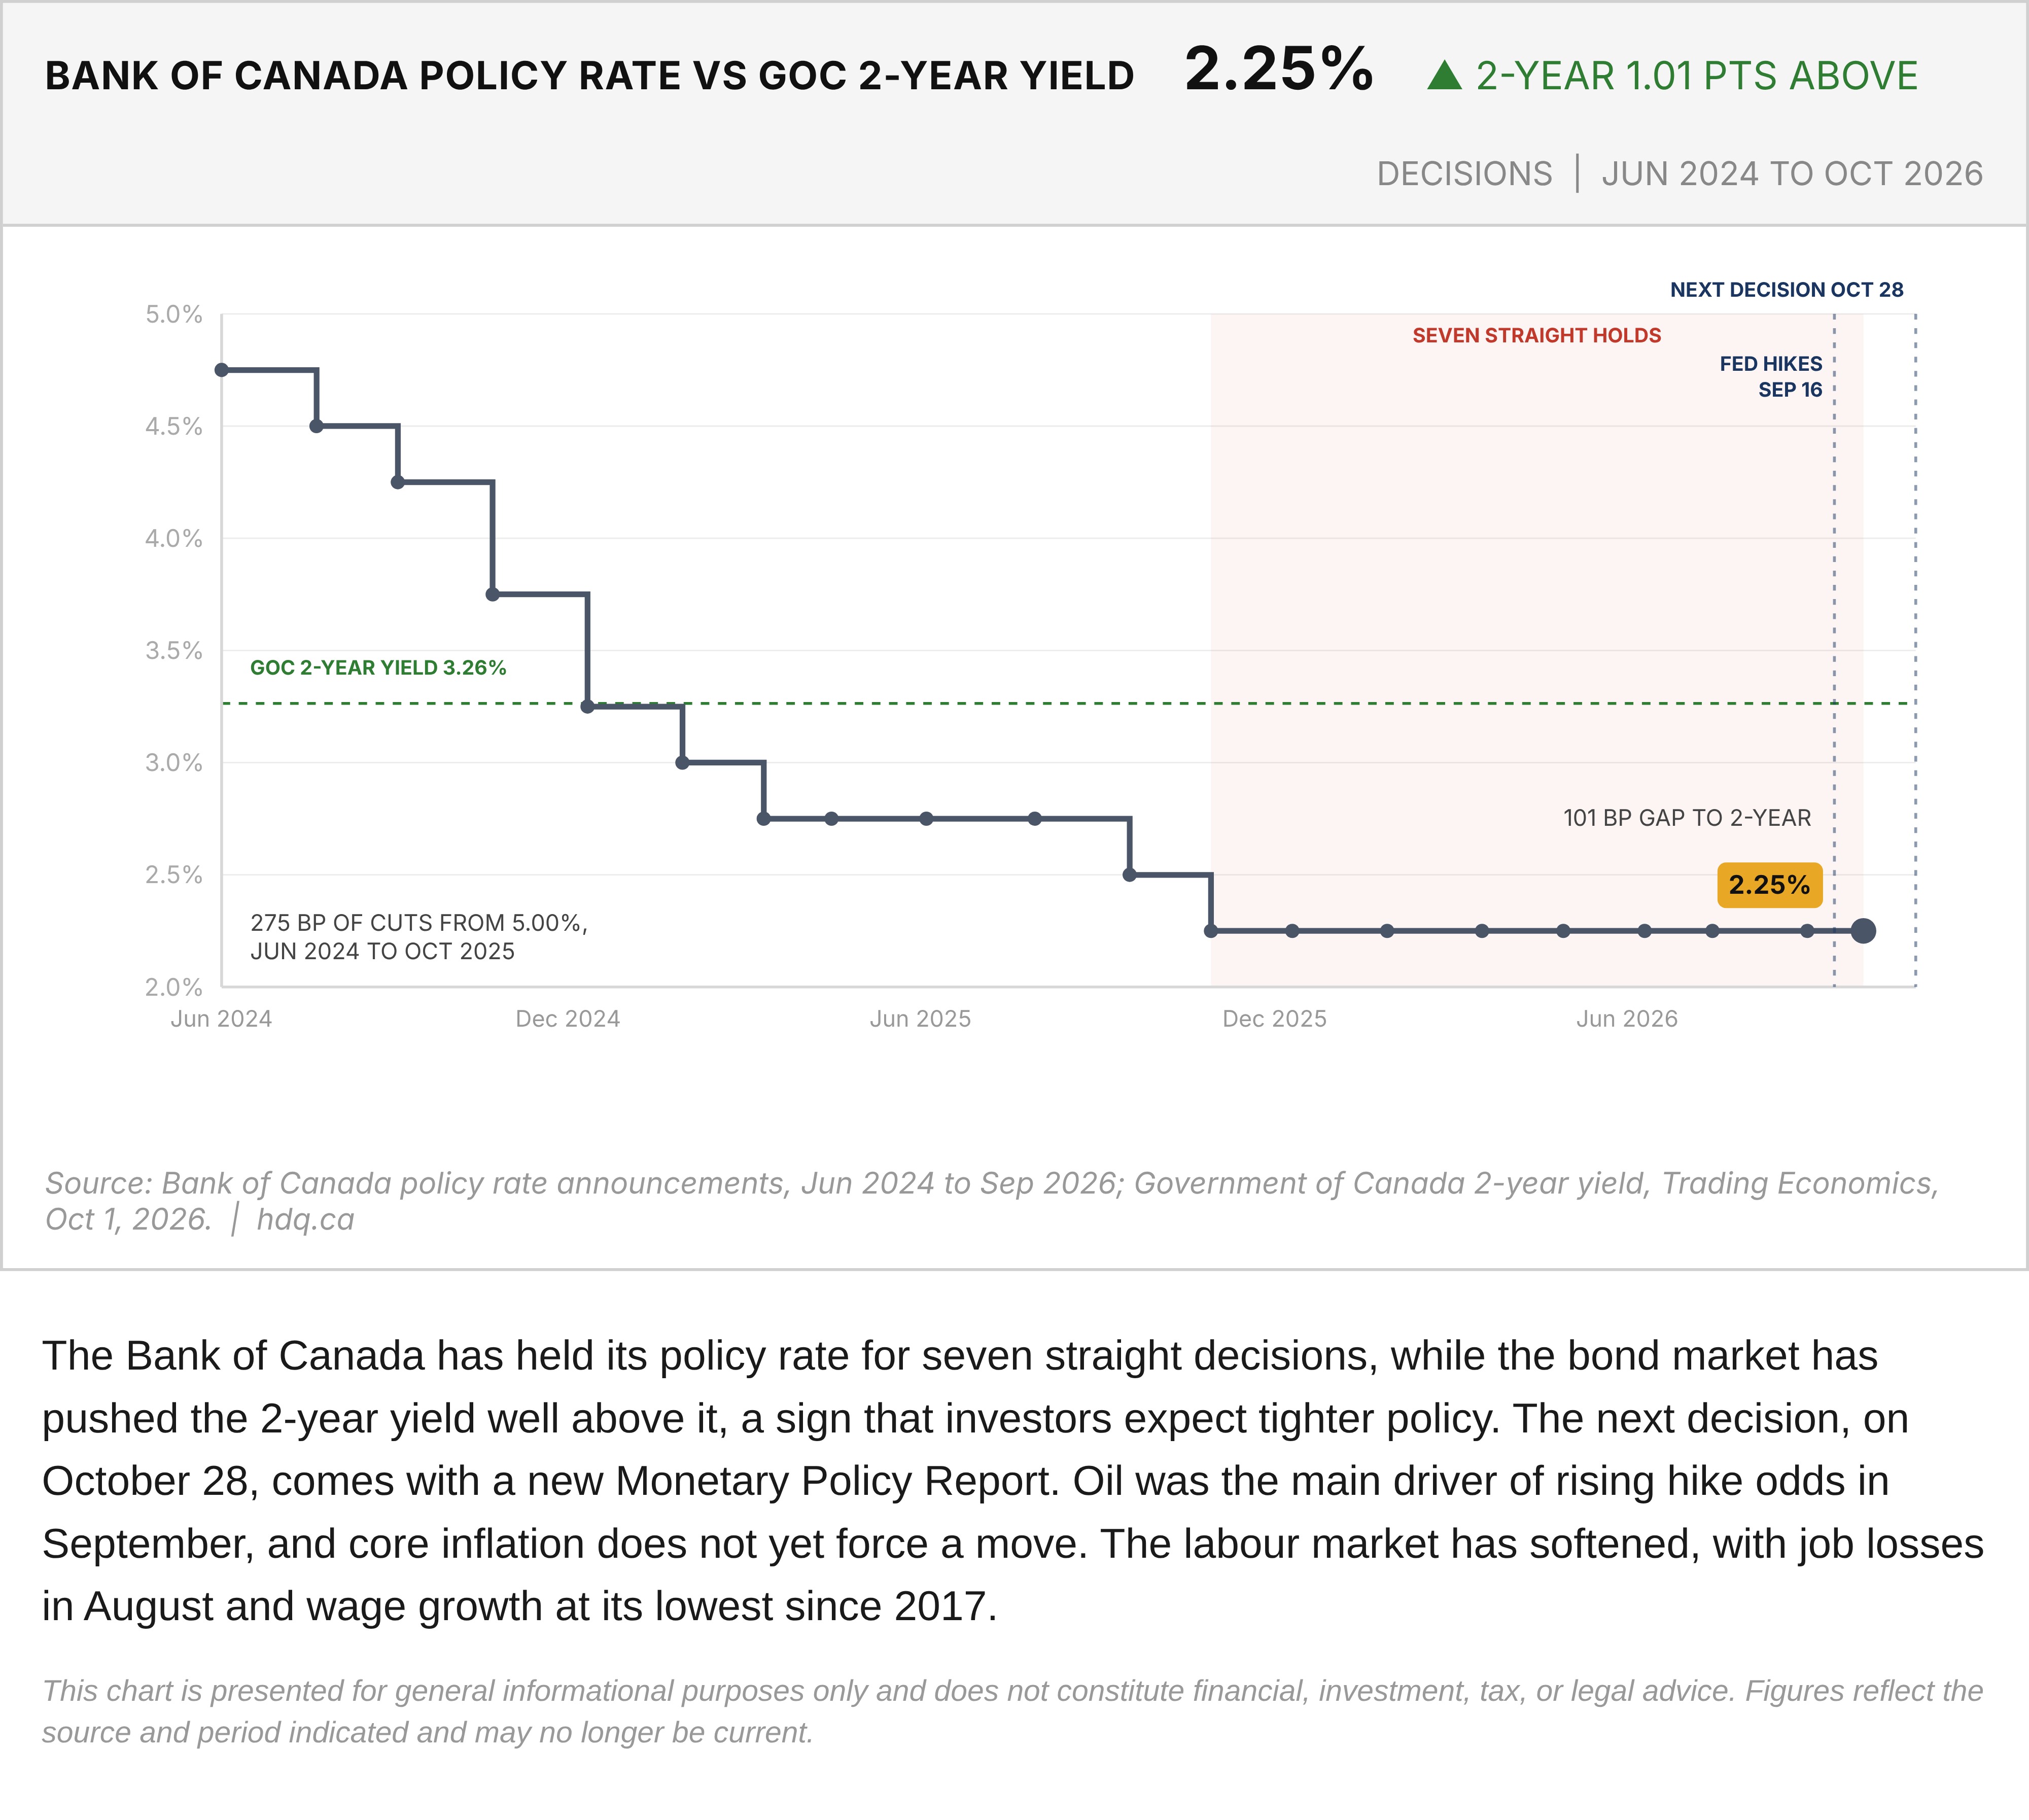
The Bank of Canada has held its policy rate for seven straight decisions, while the bond market has pushed the 2-year yield well above it, a sign that investors expect tighter policy. The next decision, on October 28, comes with a new Monetary Policy Report. Oil was the main driver of rising hike odds in September, and core inflation does not yet force a move. The labour market has softened, with job losses in August and wage growth at its lowest since 2017.
This chart is presented for general informational purposes only and does not constitute financial, investment, tax, or legal advice. Figures reflect the source and period indicated and may no longer be current.
Related charts
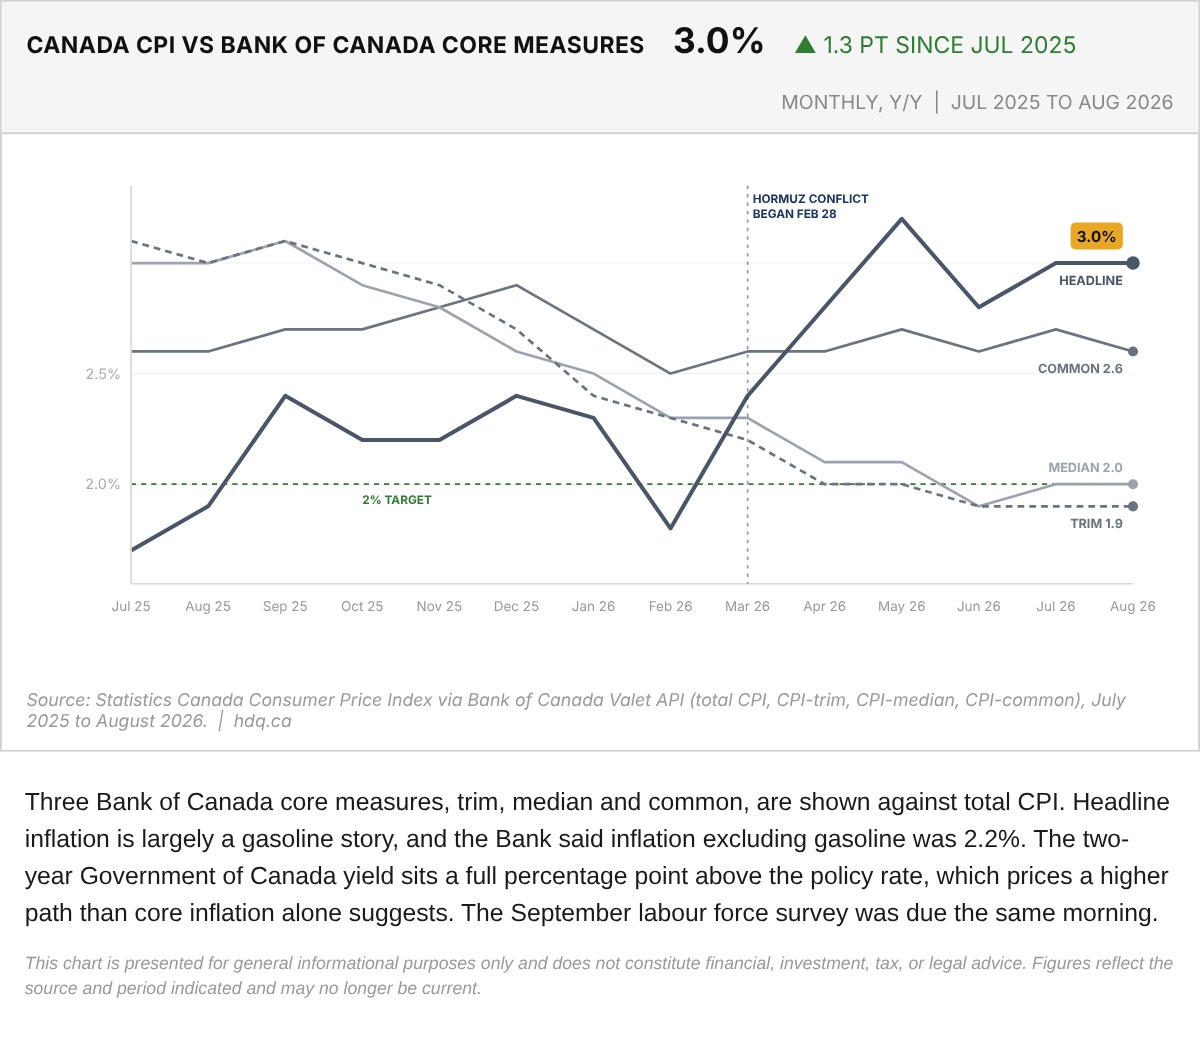
Three Bank of Canada core measures, trim, median and common, are shown against total CPI.
Canada CPI Against Bank of Canada Core Measures, July 2025 to August 2026
October 9, 2026
View chart & download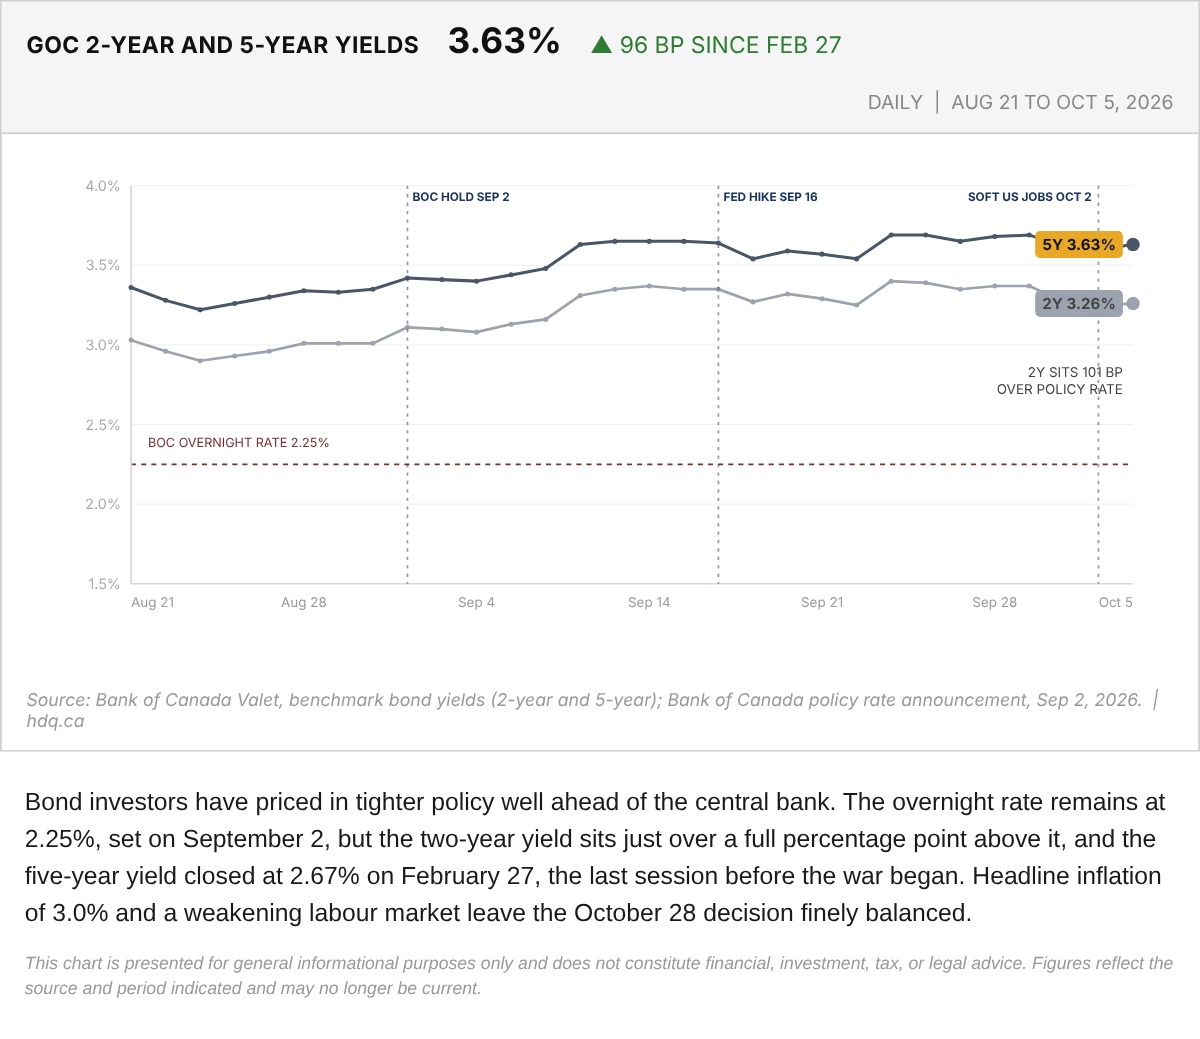
Bond investors have priced in tighter policy well ahead of the central bank.
Government of Canada 2-Year and 5-Year Yields Since the Pre-War Close
October 7, 2026
View chart & download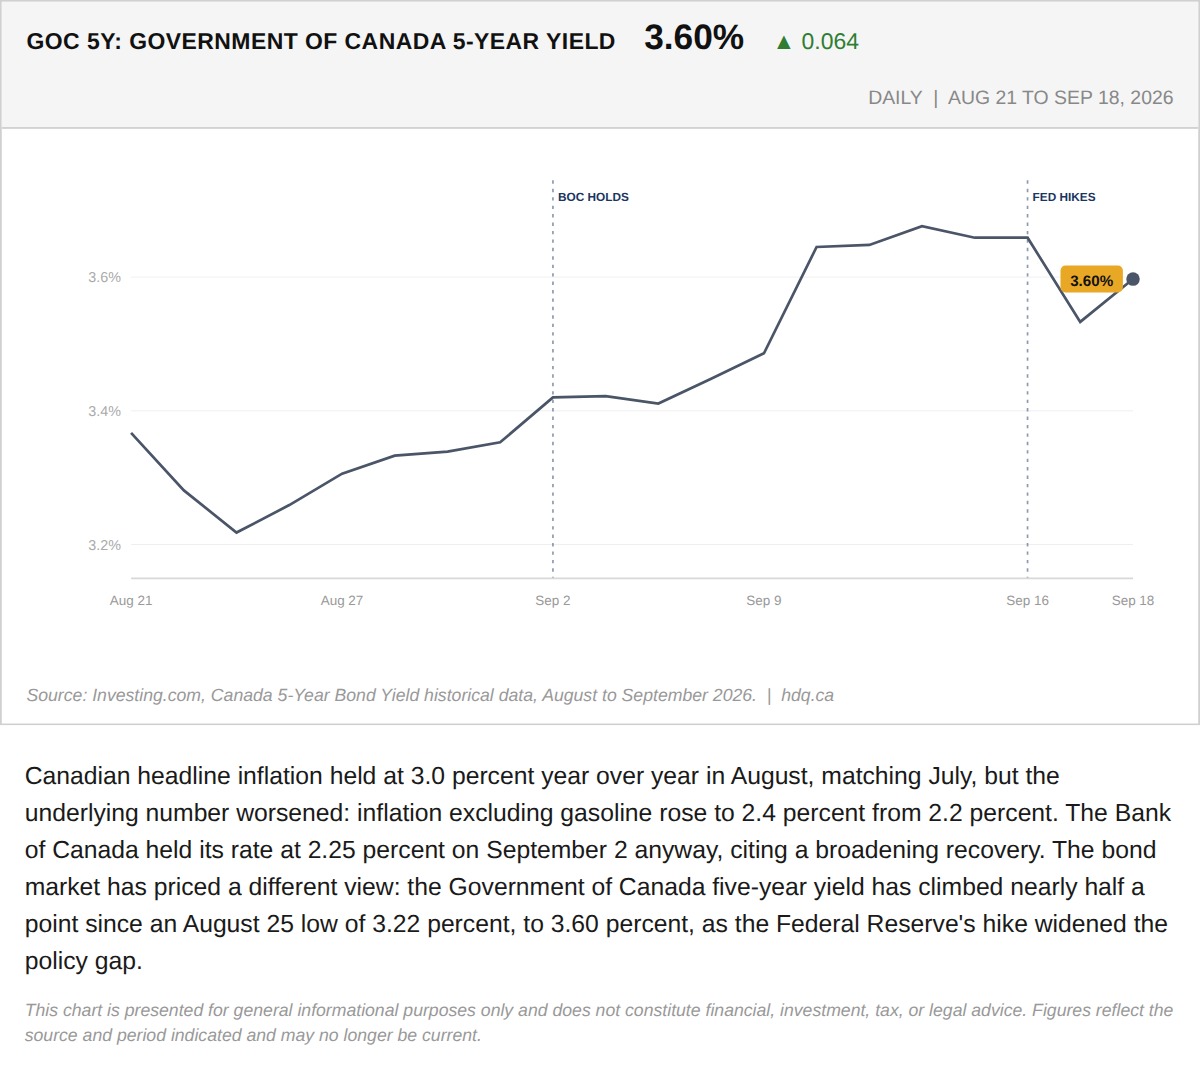
Canadian headline inflation held at 3.0 percent year over year in August, matching July, but the underlying number worsened: inflation…
The Bond Market Already Moved Before the Bank of Canada Has To
September 21, 2026
View chart & download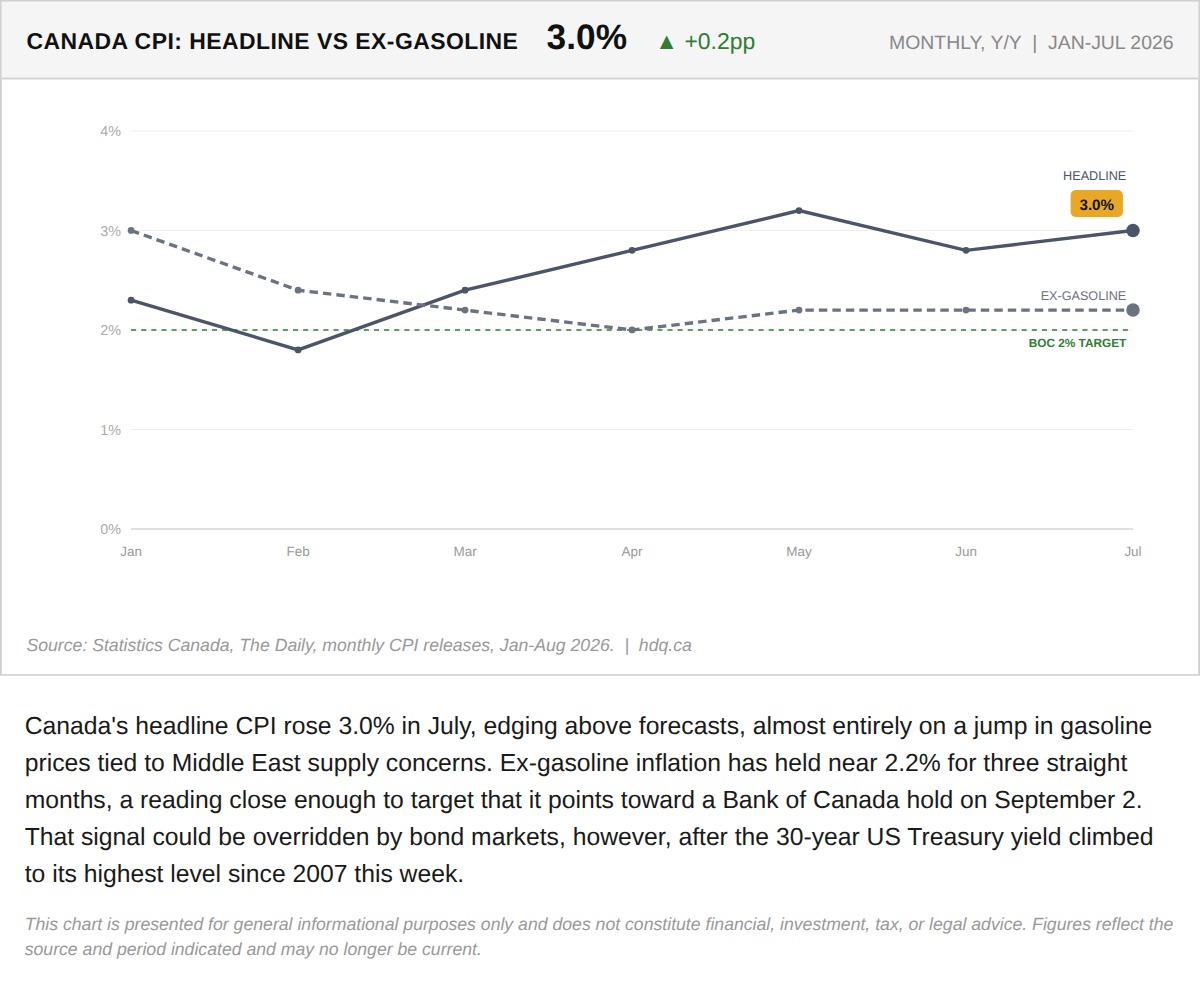
Canada's headline CPI rose 3.0% in July, edging above forecasts, almost entirely on a jump in gasoline prices tied to Middle East supply concerns.
Canada CPI Points to a BoC Hold as Bond Yields Climb
August 18, 2026
View chart & download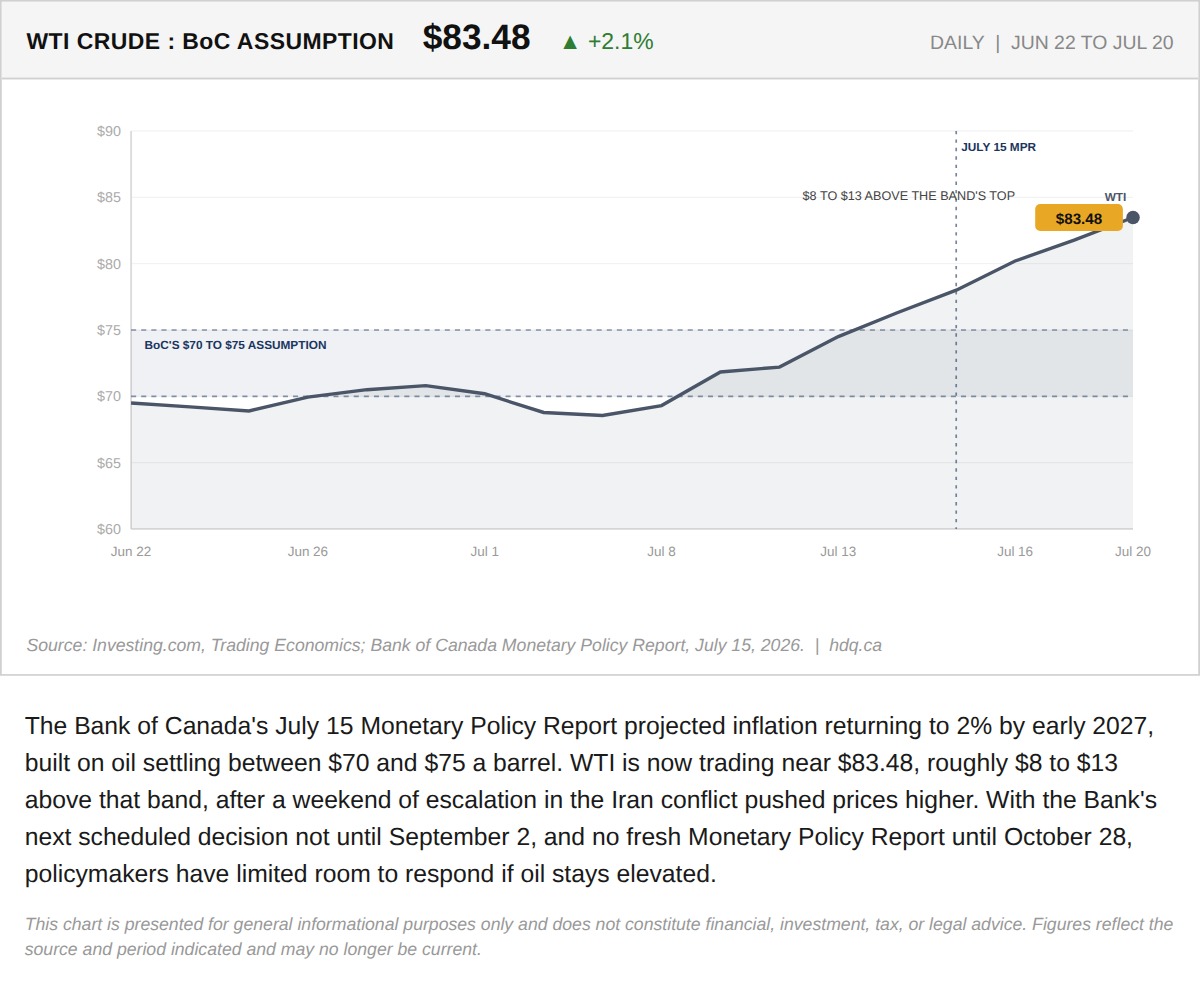
The Bank of Canada's July 15 Monetary Policy Report projected inflation returning to 2% by early 2027, built on oil settling between $70 and $75 a barrel.
The Bank of Canada's Path Back to 2% Assumed Oil at $70 to $75. It's Trading Near $84.
July 20, 2026
View chart & download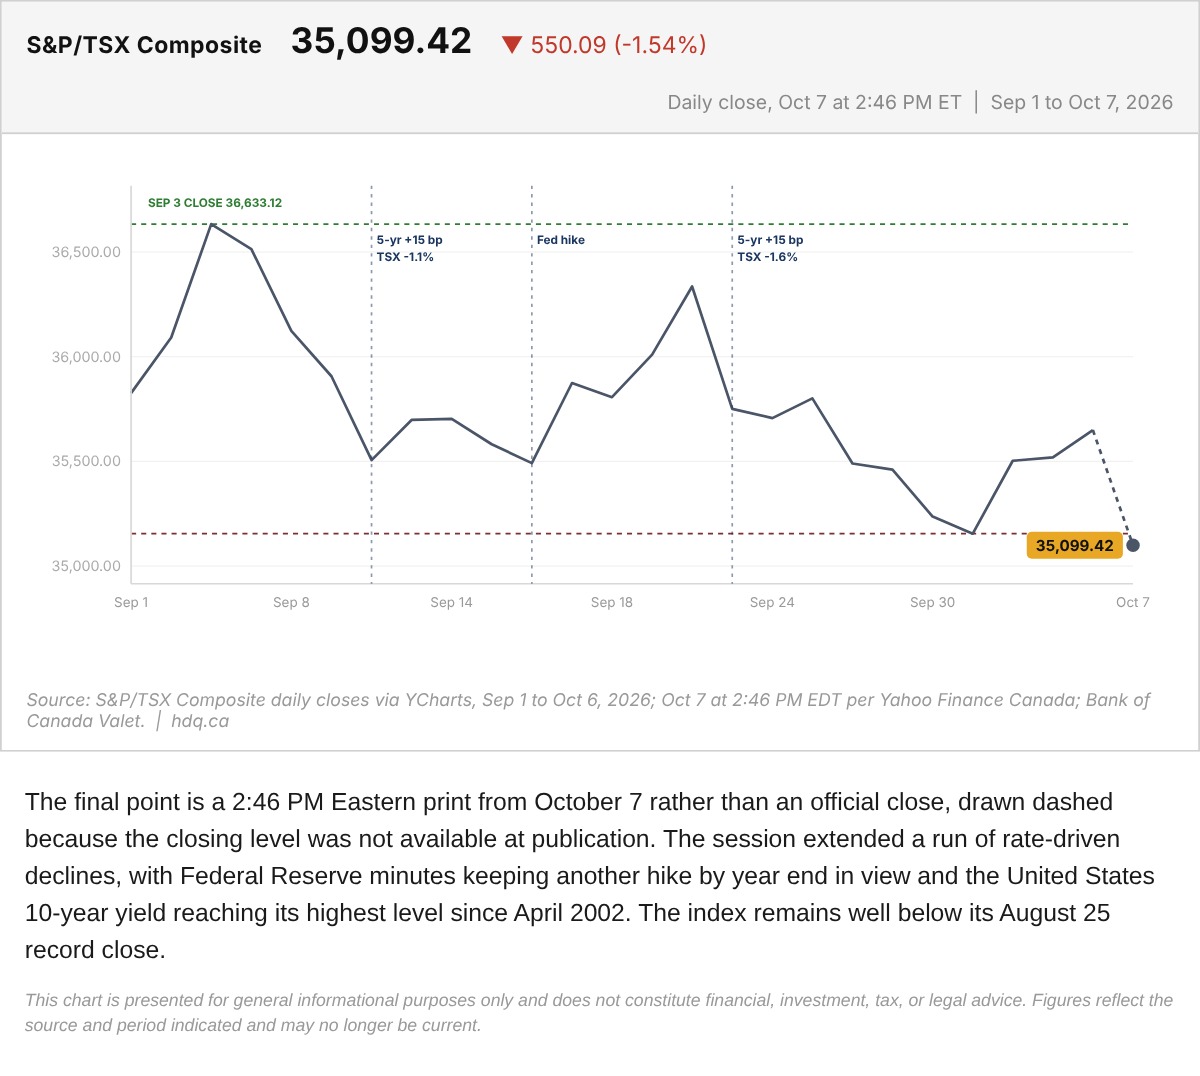
The final point is a 2:46 PM Eastern print from October 7 rather than an official close, drawn dashed because the closing level was not available at publication.
S&P/TSX Composite With the October 7 Midday Print
October 7, 2026
View chart & download