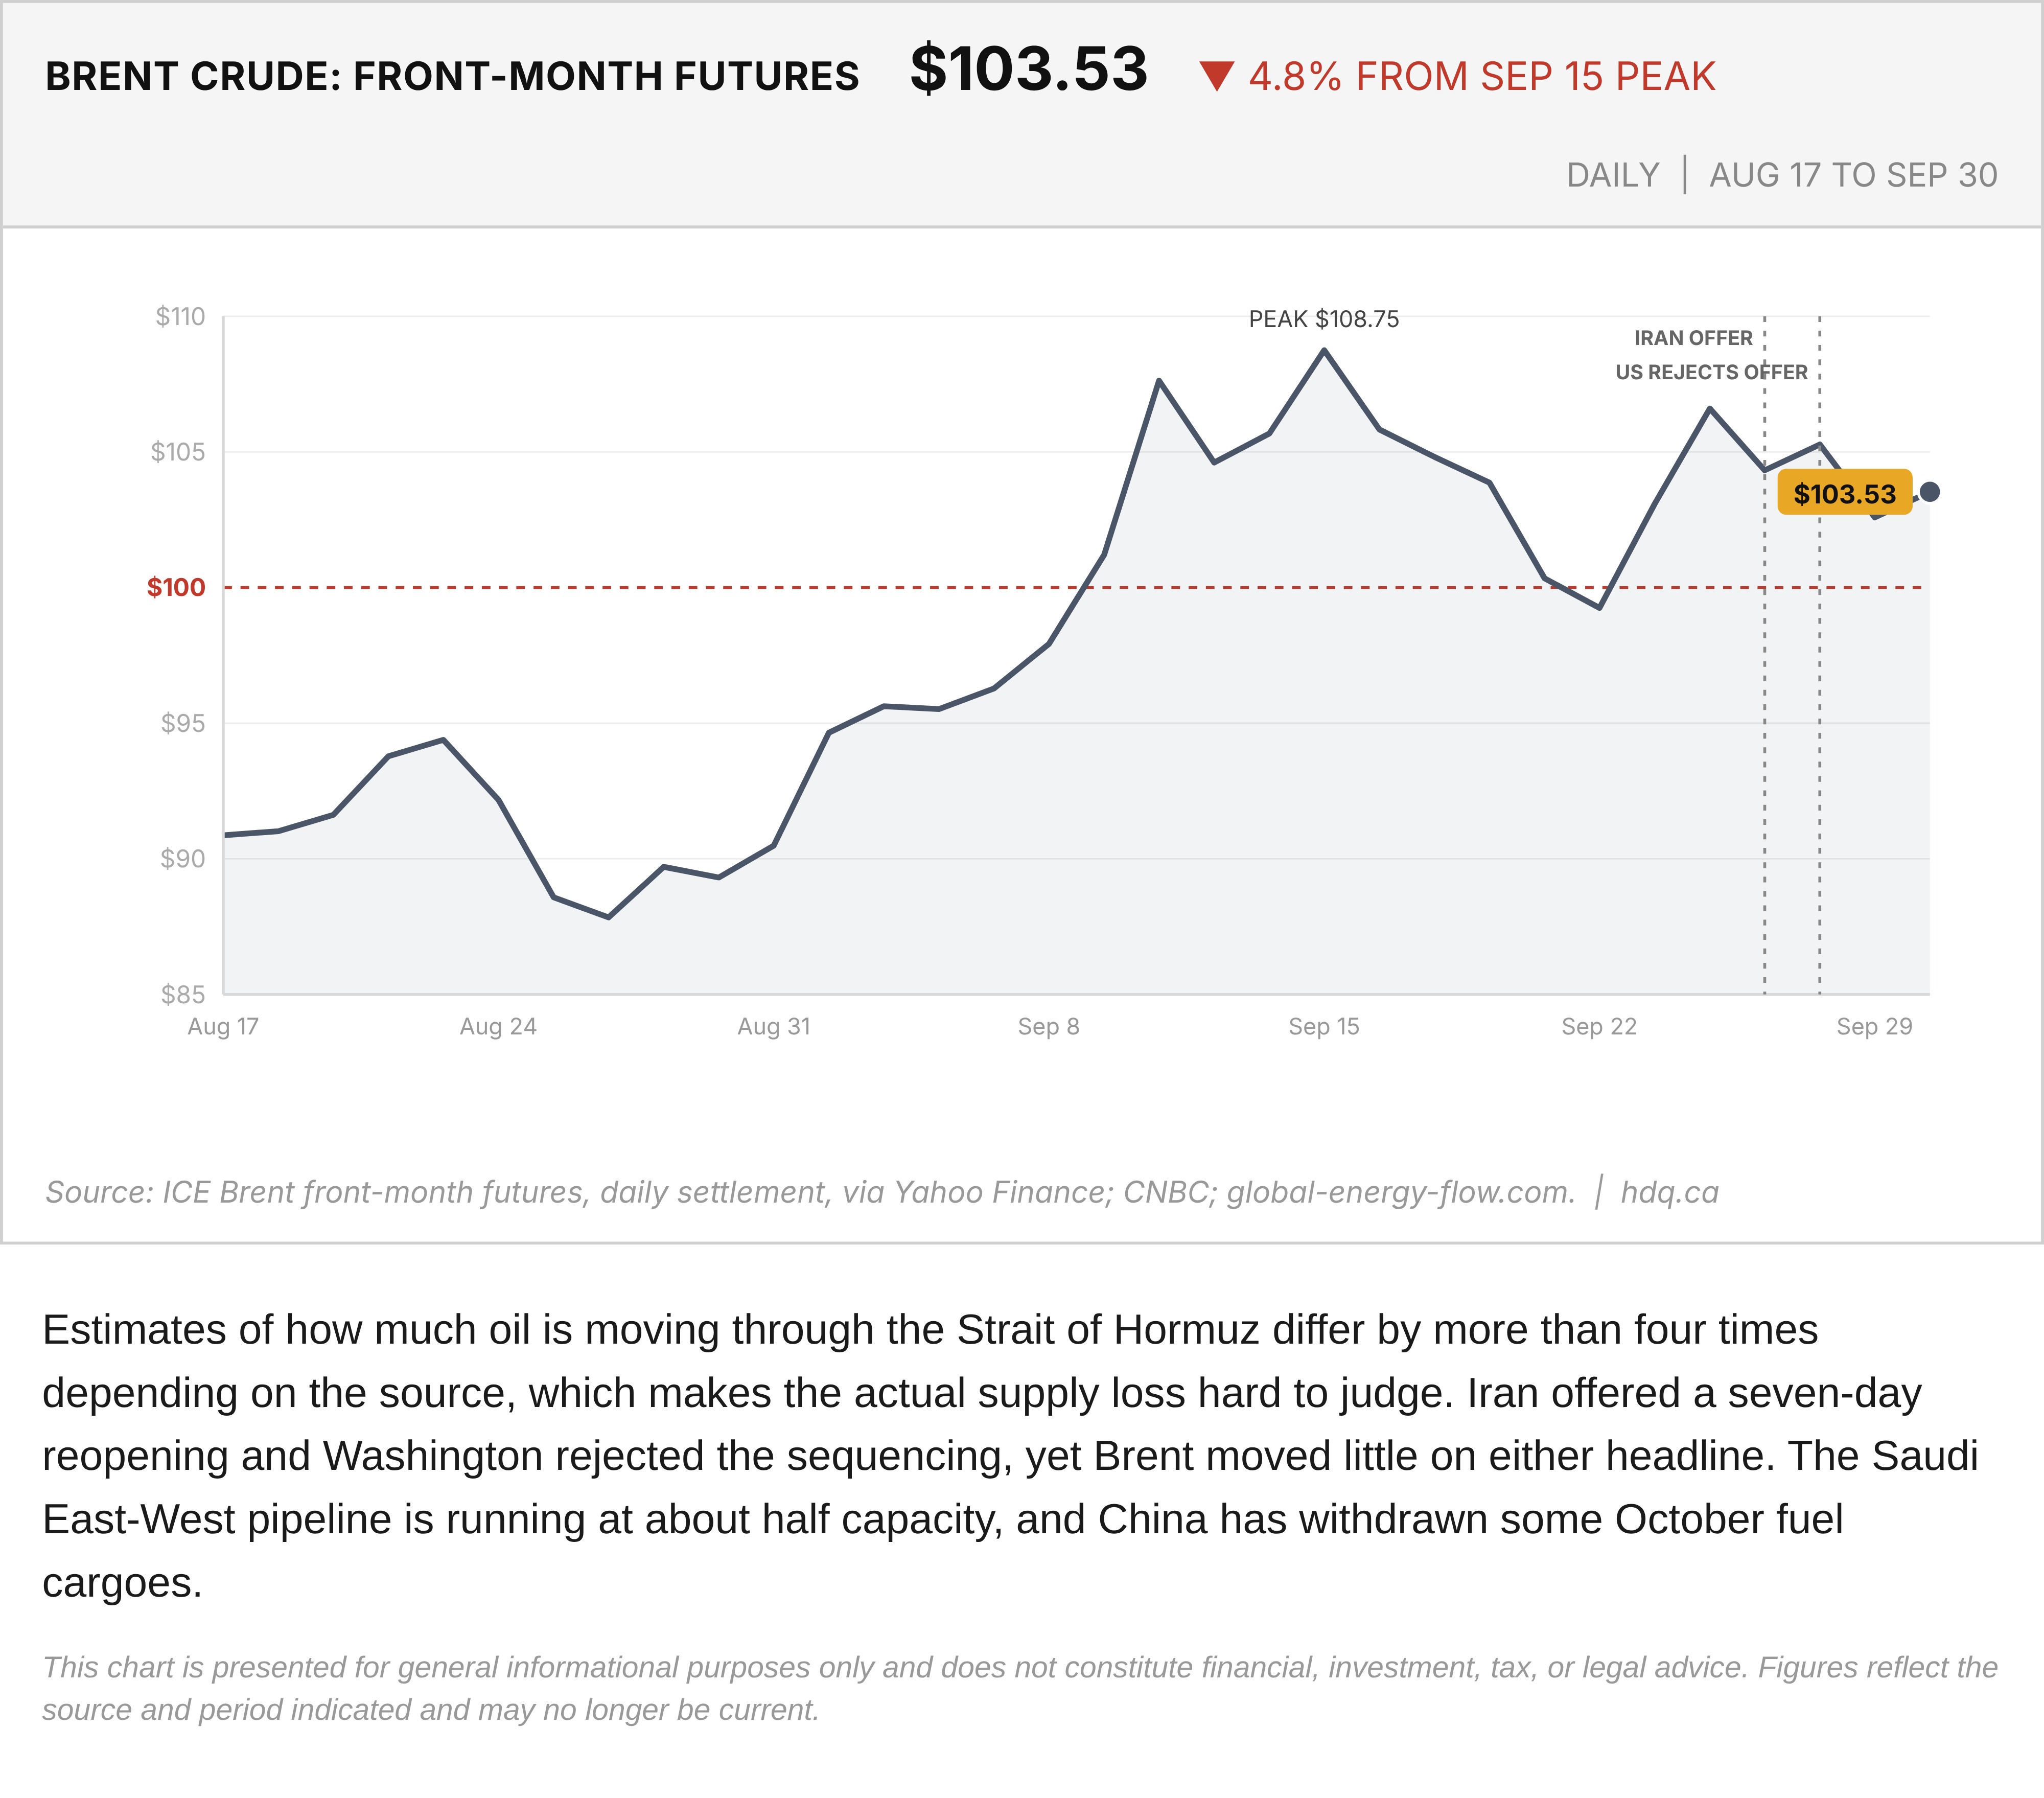
Estimates of how much oil is moving through the Strait of Hormuz differ by more than four times depending on the source, which makes the actual supply loss hard to judge. Iran offered a seven-day reopening and Washington rejected the sequencing, yet Brent moved little on either headline. The Saudi East-West pipeline is running at about half capacity, and China has withdrawn some October fuel cargoes.
This chart is presented for general informational purposes only and does not constitute financial, investment, tax, or legal advice. Figures reflect the source and period indicated and may no longer be current.
Related charts
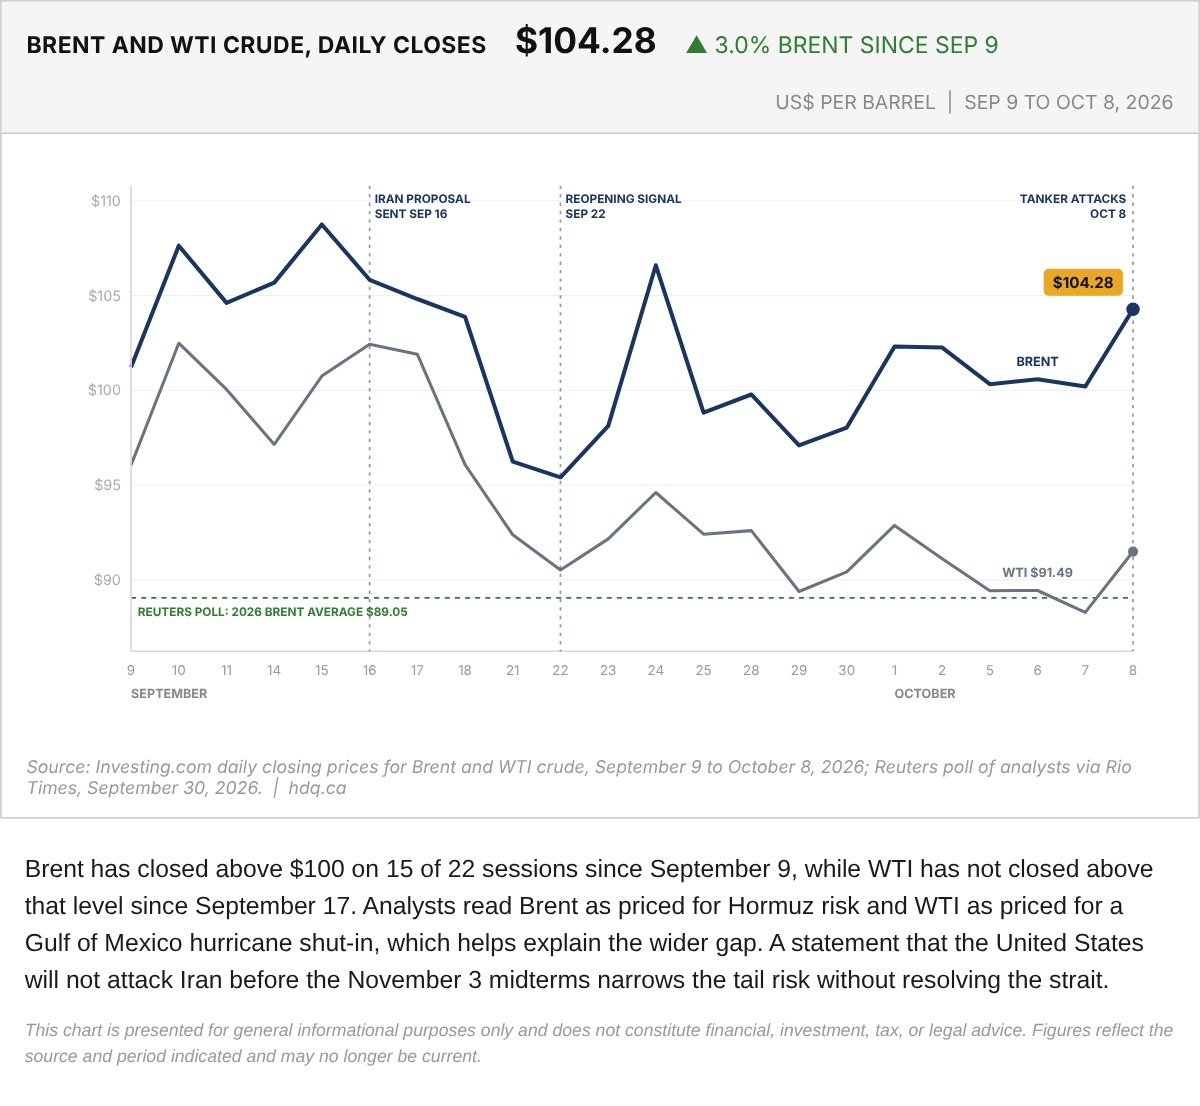
Brent has closed above $100 on 15 of 22 sessions since September 9, while WTI has not closed above that level since September 17.
Brent and WTI Crude Daily Closes, September 9 to October 8
October 9, 2026
View chart & download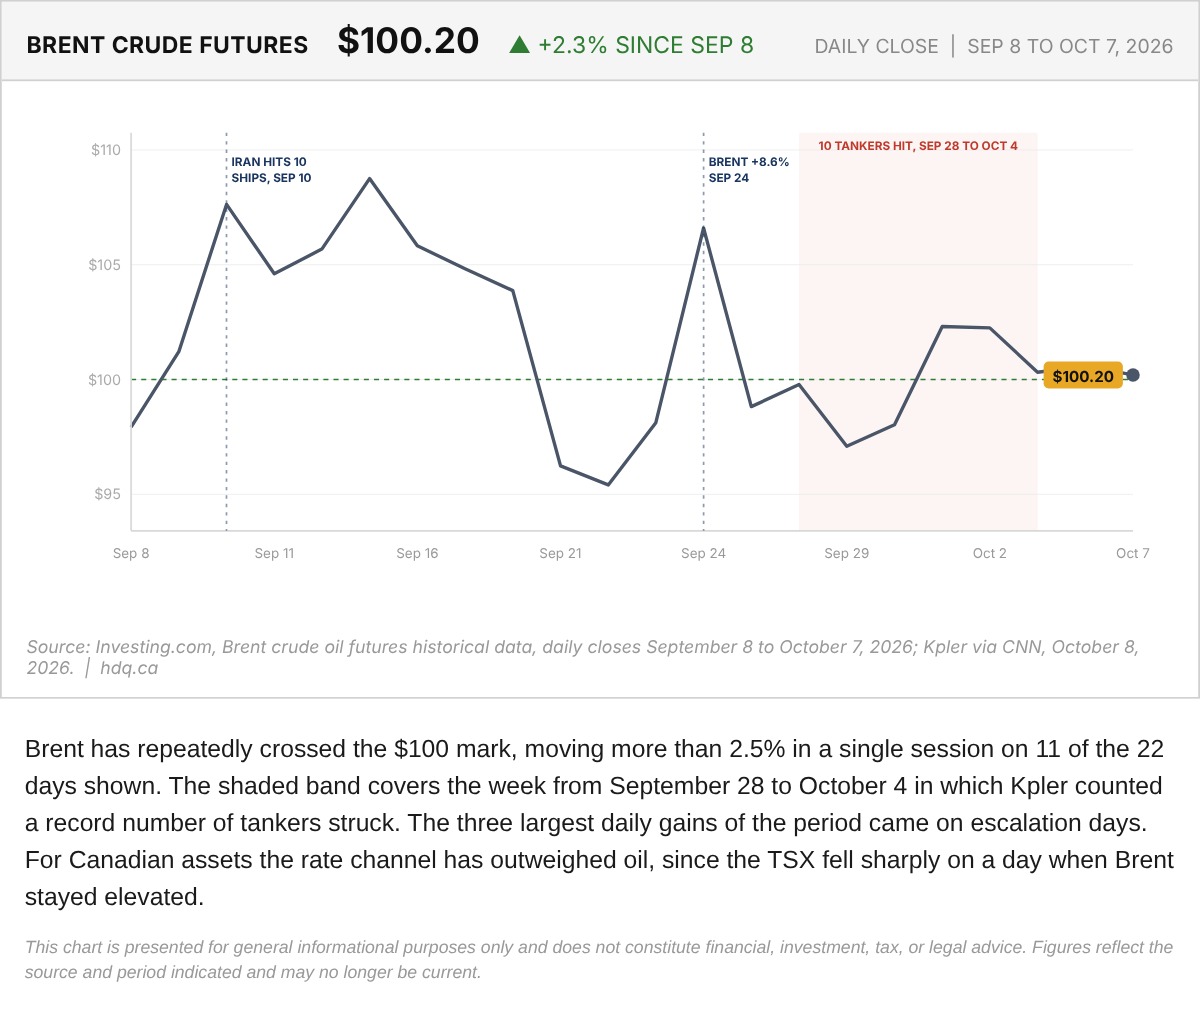
Brent has repeatedly crossed the $100 mark, moving more than 2.5% in a single session on 11 of the 22 days shown.
Brent Crude Futures Daily Close, September 8 to October 7
October 8, 2026
View chart & download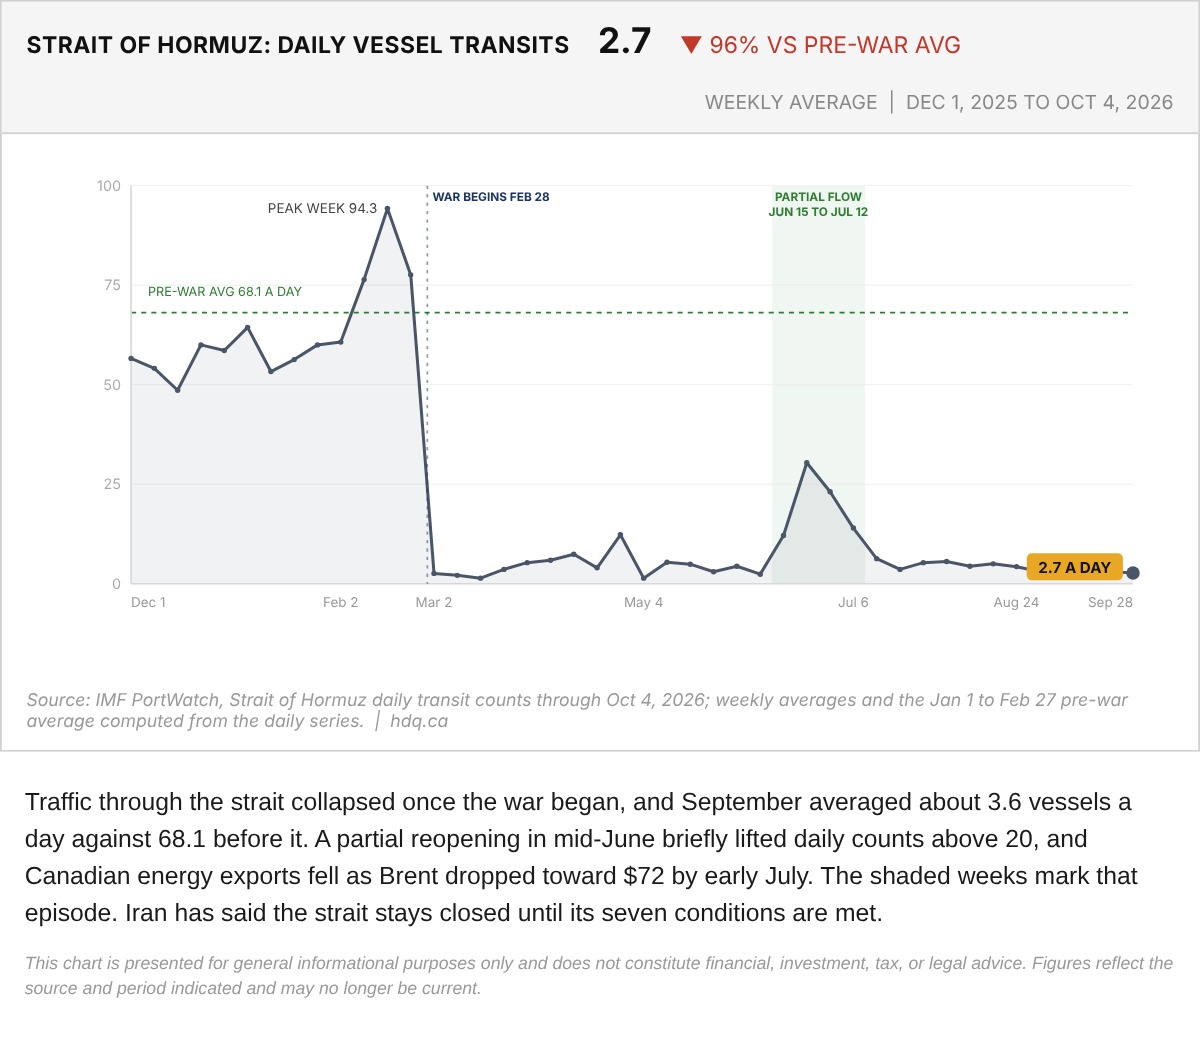
Traffic through the strait collapsed once the war began, and September averaged about 3.6 vessels a day against 68.1 before it.
Strait of Hormuz Weekly Average Vessel Transits, December 2025 to October 2026
October 7, 2026
View chart & download
Brent was the only one of the three to finish above its starting level, while the index and gold both fell.
Brent, TSX and Gold Rebased to the August 31 Close
September 30, 2026
View chart & download
The Bank of Canada held its policy rate at 2.25% for a seventh straight time, yet Canadian yields rose as United States yields surged.
Government of Canada Benchmark Yields, September 2026
September 30, 2026
View chart & download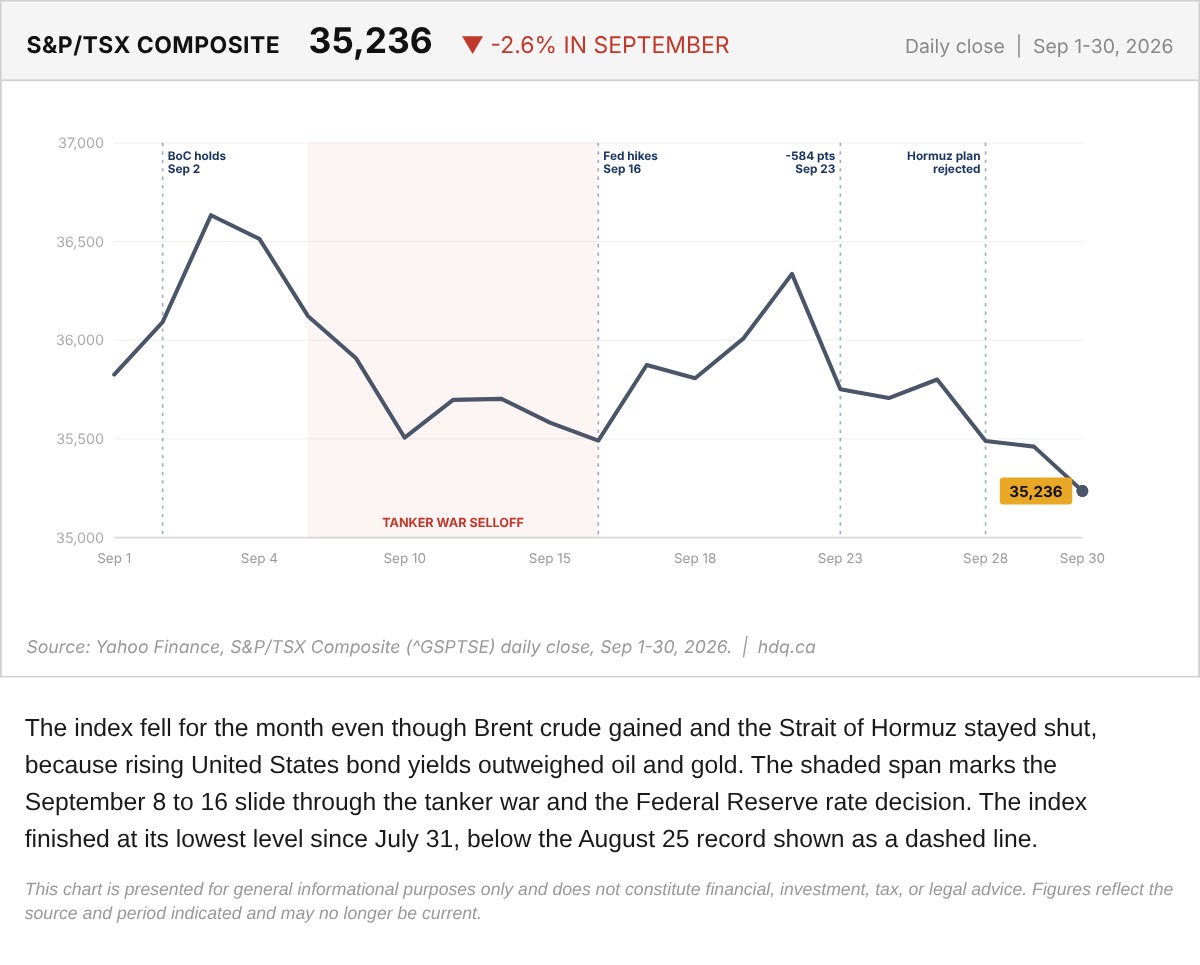
The index fell for the month even though Brent crude gained and the Strait of Hormuz stayed shut, because rising United States bond yields outweighed oil and gold.
S&P/TSX Composite Daily Close Through September 2026
September 30, 2026
View chart & download