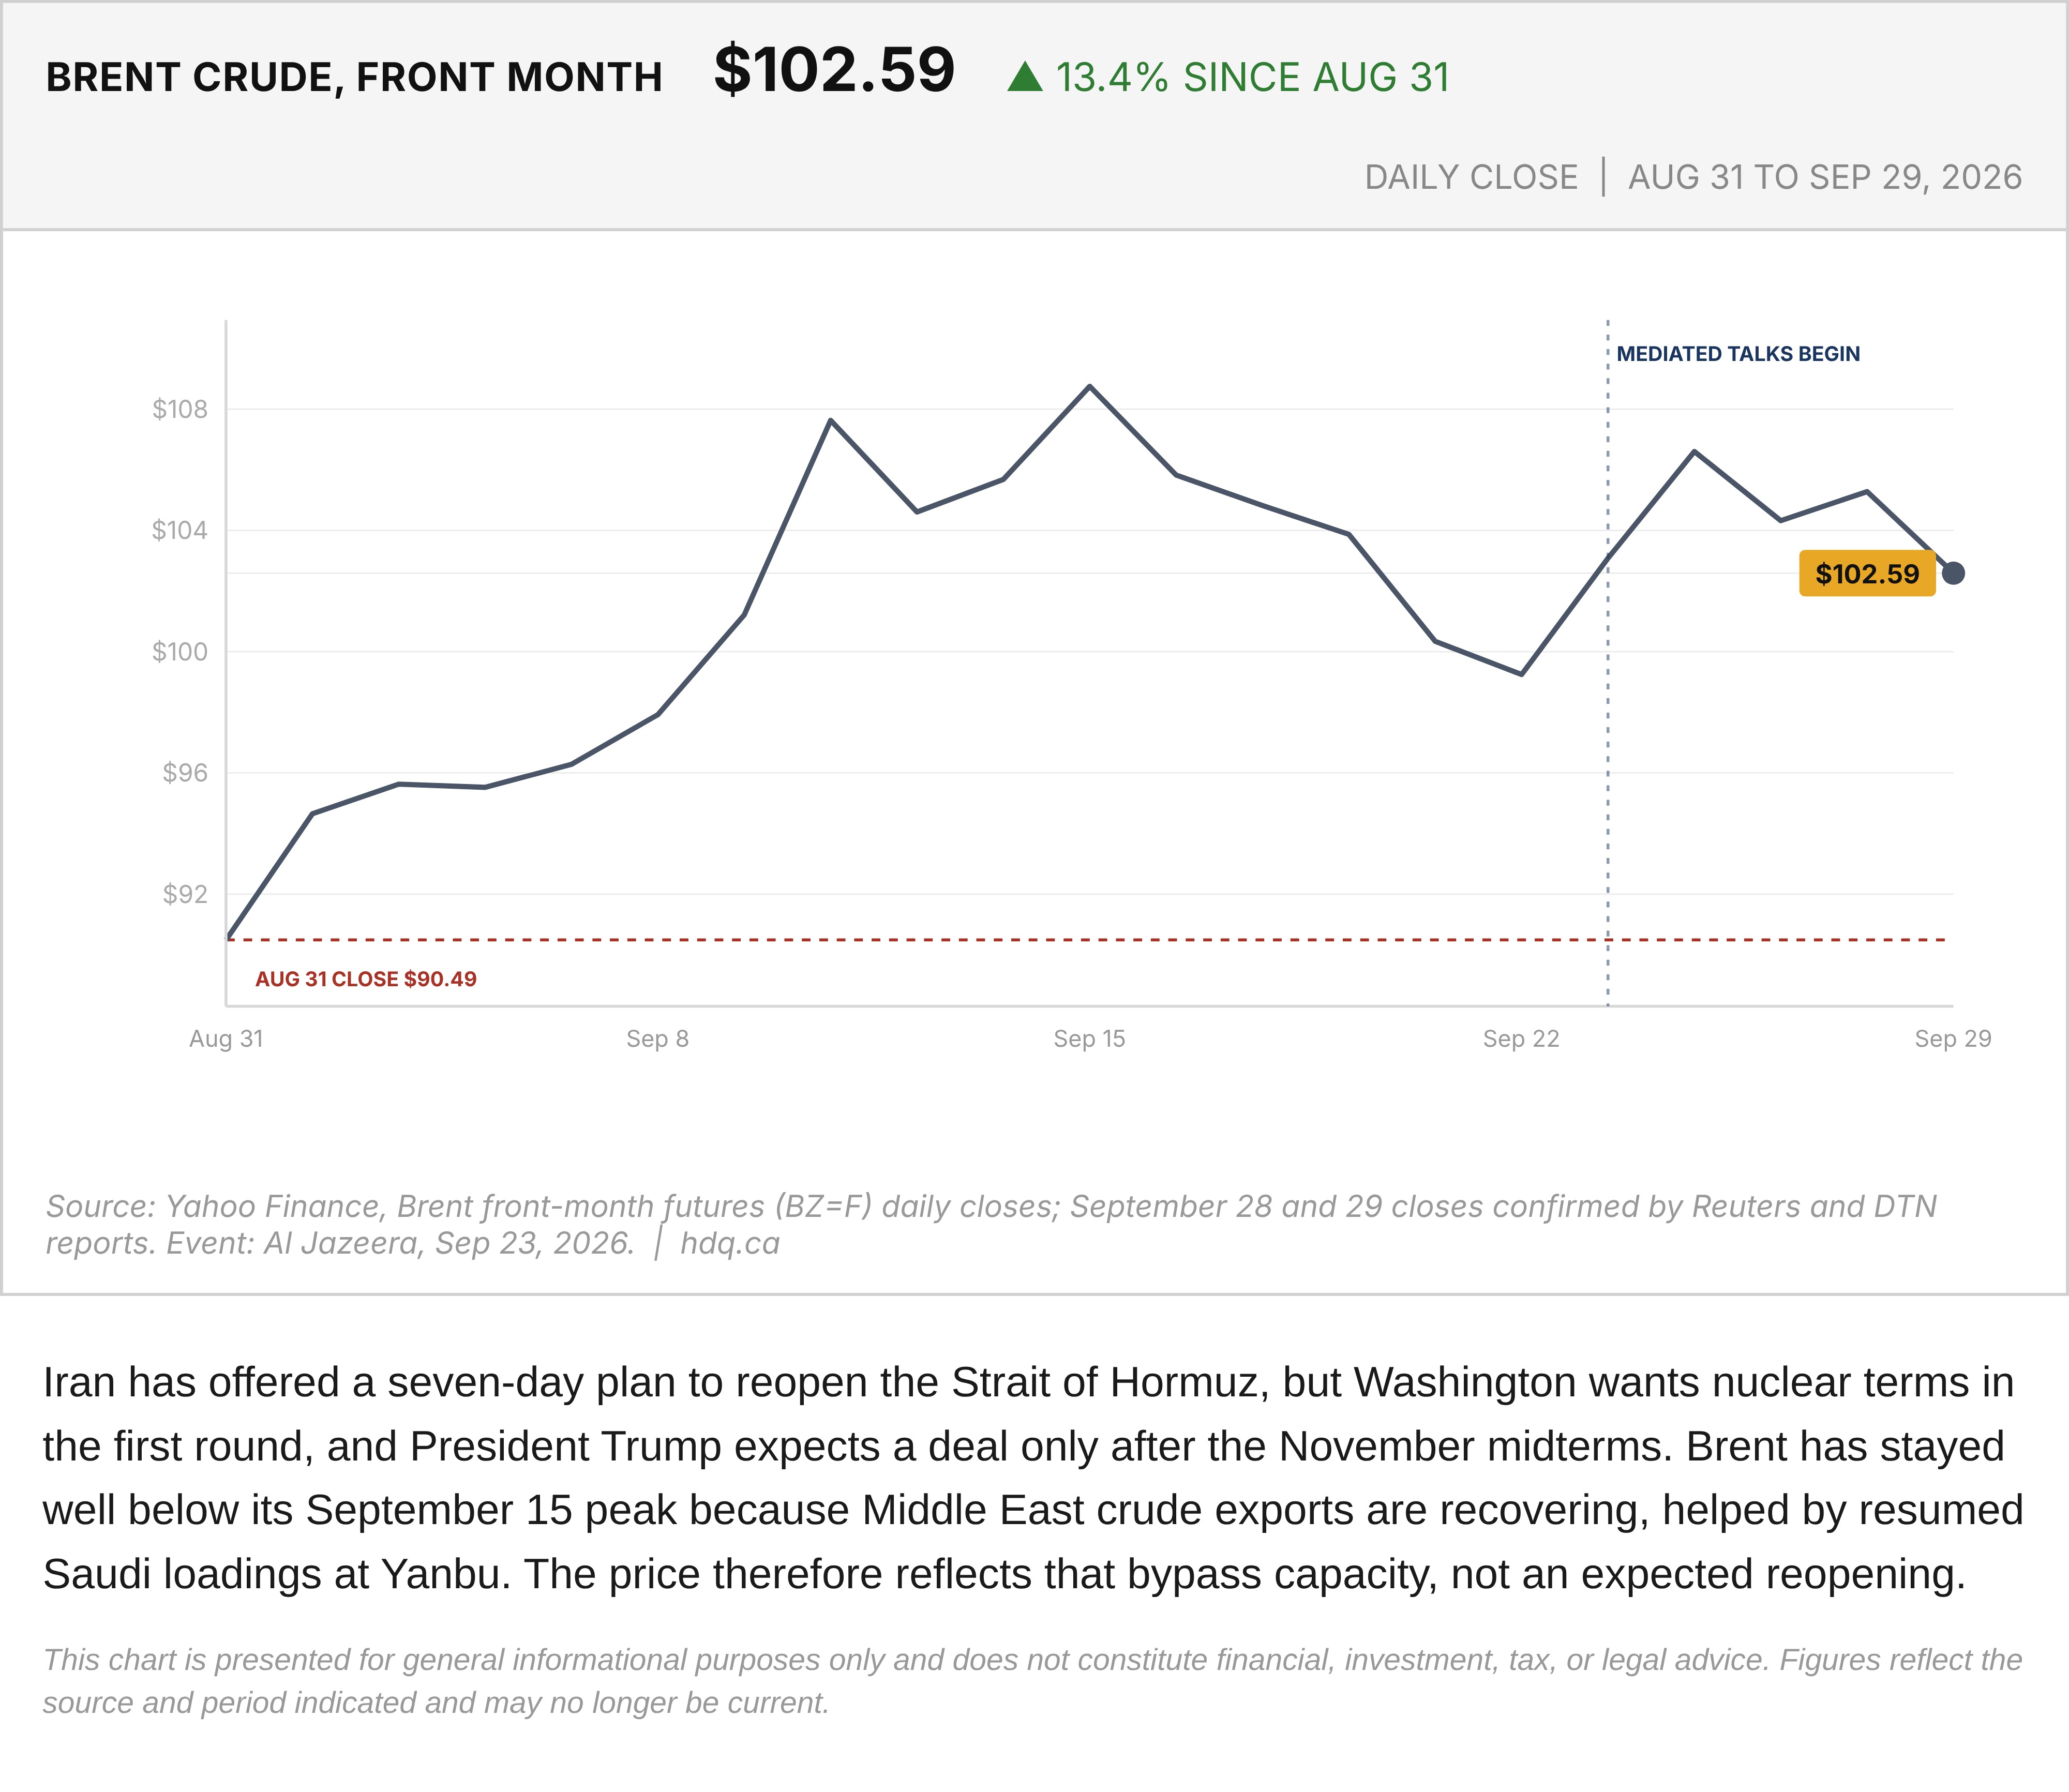
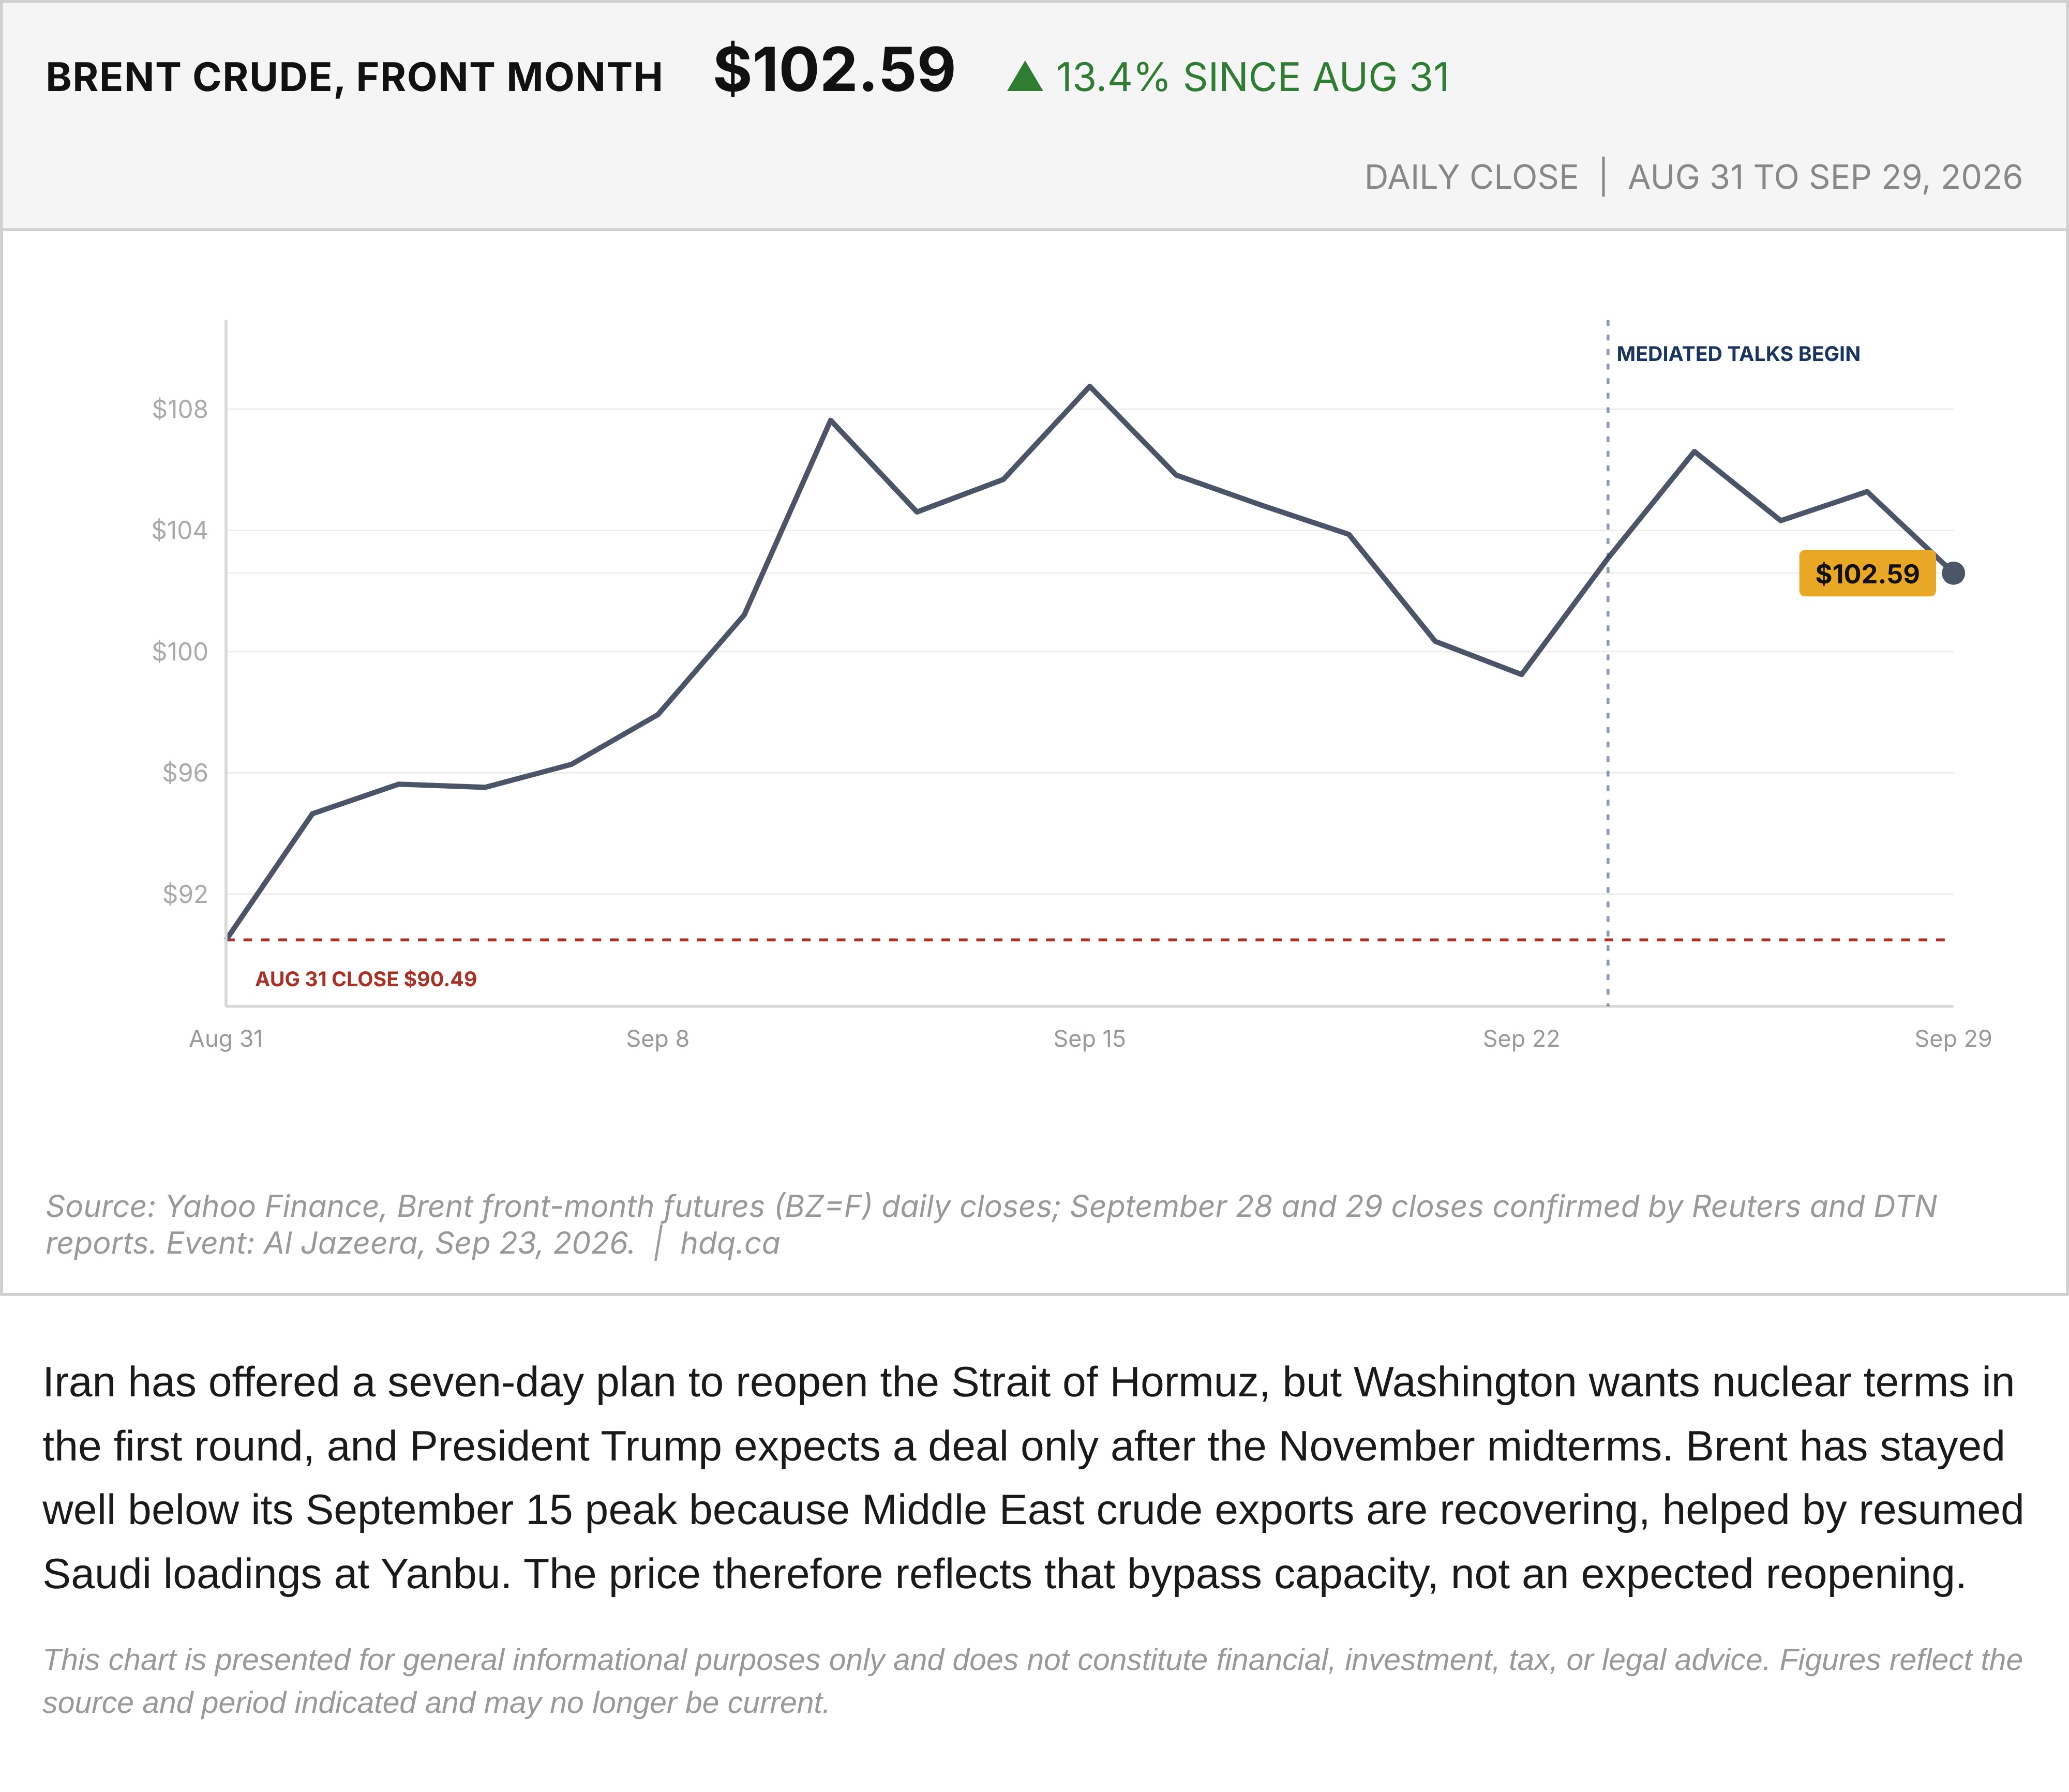
Iran has offered a seven-day plan to reopen the Strait of Hormuz, but Washington wants nuclear terms in the first round, and President Trump expects a deal only after the November midterms. Brent has stayed well below its September 15 peak because Middle East crude exports are recovering, helped by resumed Saudi loadings at Yanbu. The price therefore reflects that bypass capacity, not an expected reopening.
This chart is presented for general informational purposes only and does not constitute financial, investment, tax, or legal advice. Figures reflect the source and period indicated and may no longer be current.
Related charts
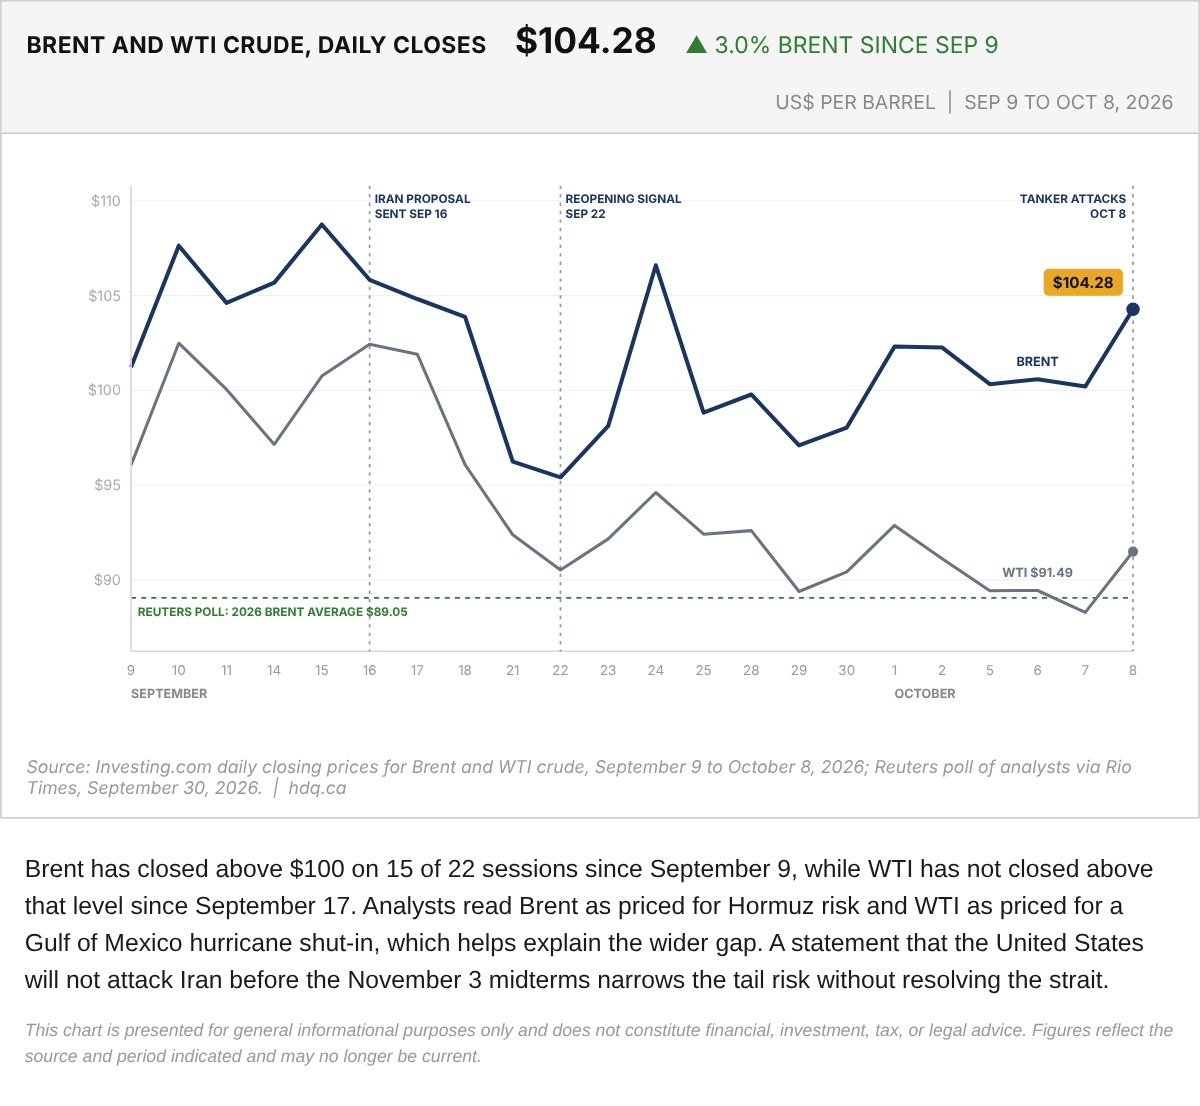
Brent has closed above $100 on 15 of 22 sessions since September 9, while WTI has not closed above that level since September 17.
Brent and WTI Crude Daily Closes, September 9 to October 8
October 9, 2026
View chart & download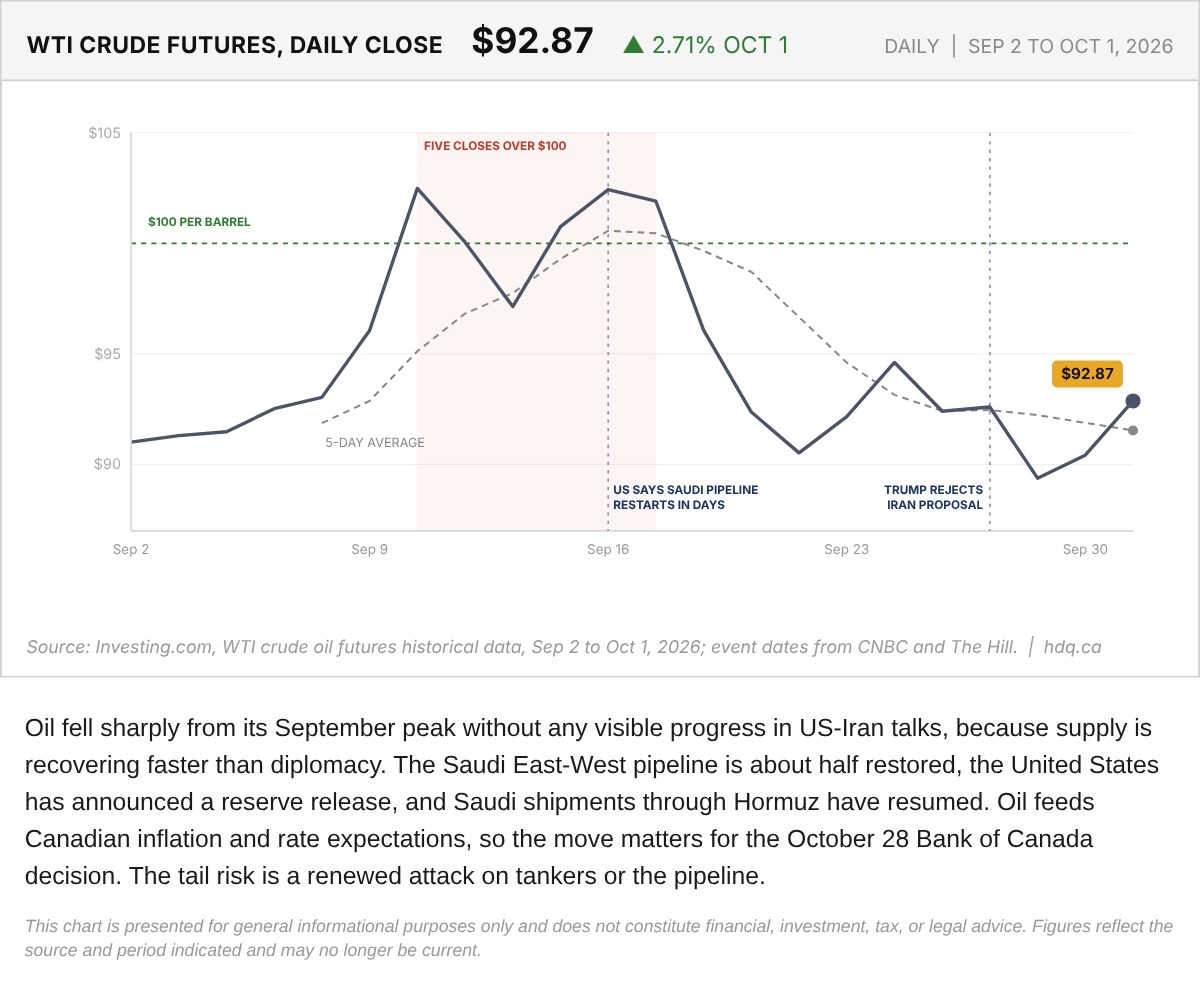
Oil fell sharply from its September peak without any visible progress in US-Iran talks, because supply is recovering faster than diplomacy.
WTI Crude Oil Futures Daily Close, September 2 to October 1, 2026
October 2, 2026
View chart & download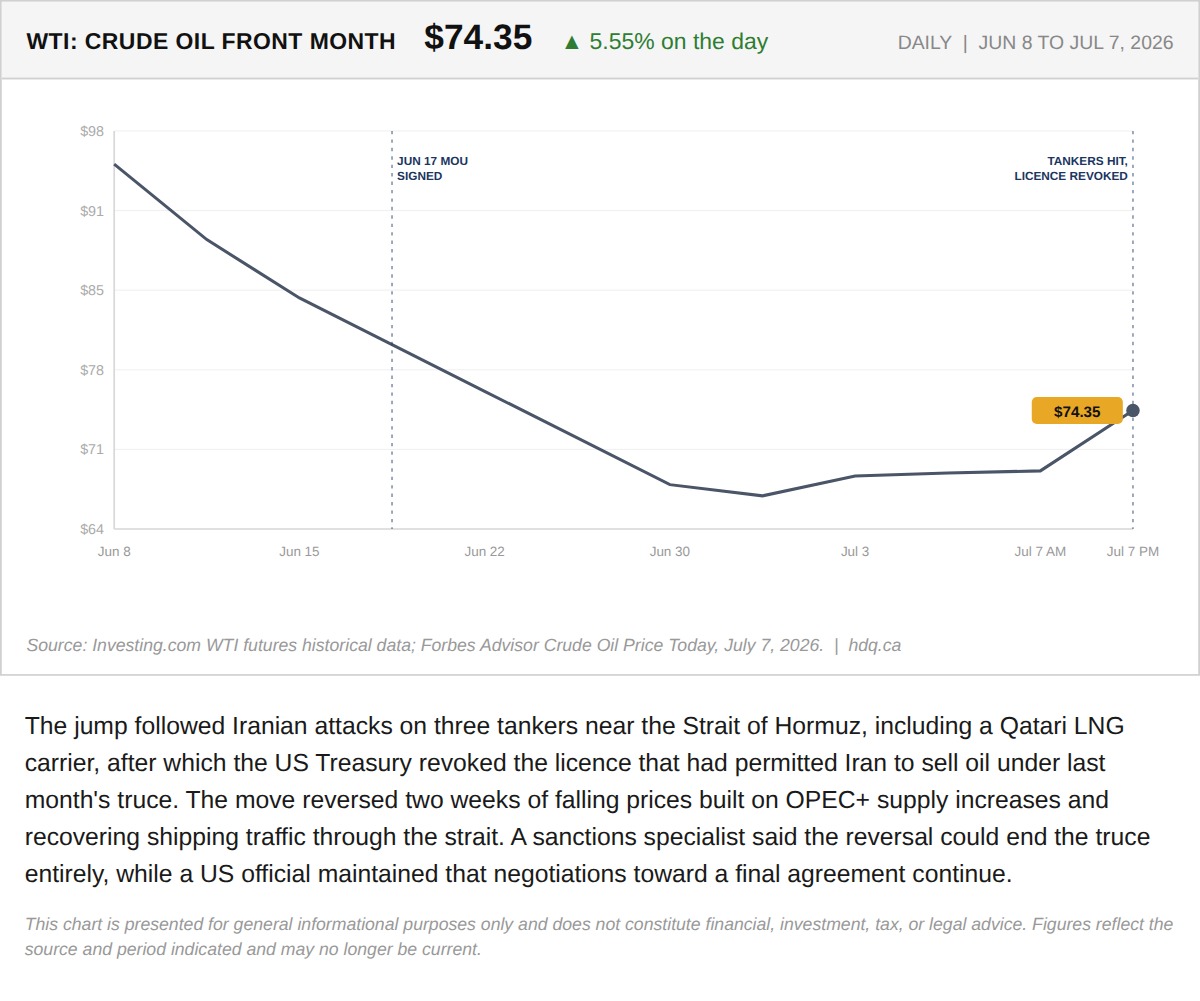
The jump followed Iranian attacks on three tankers near the Strait of Hormuz, including a Qatari LNG carrier, after which the US Treasury…
July 8, 2026
View chart & download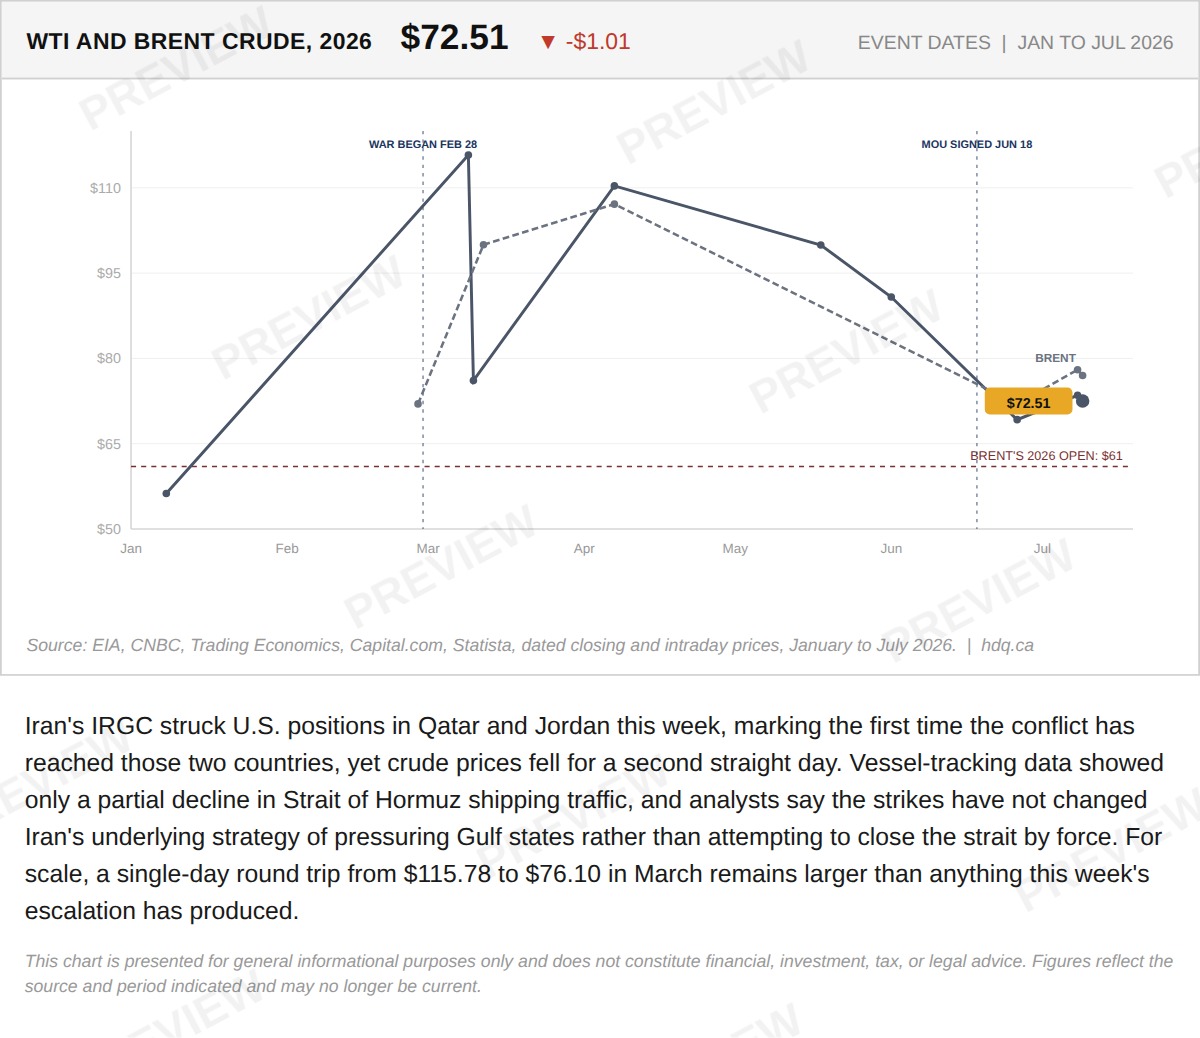
Iran's IRGC struck U.S.
The War Widened to Two New Countries. Oil Fell Anyway.
July 10, 2026
View chart & download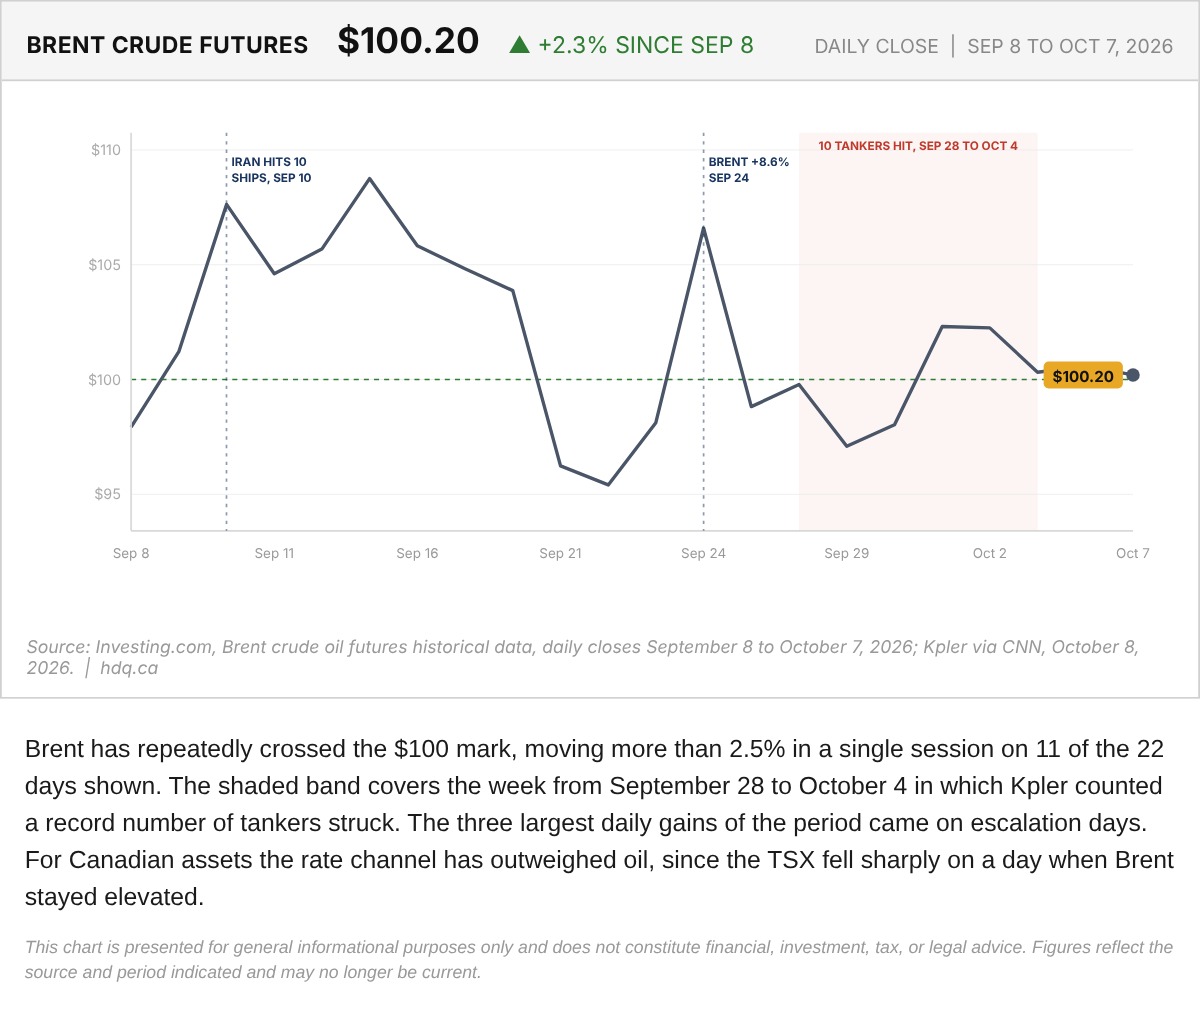
Brent has repeatedly crossed the $100 mark, moving more than 2.5% in a single session on 11 of the 22 days shown.
Brent Crude Futures Daily Close, September 8 to October 7
October 8, 2026
View chart & download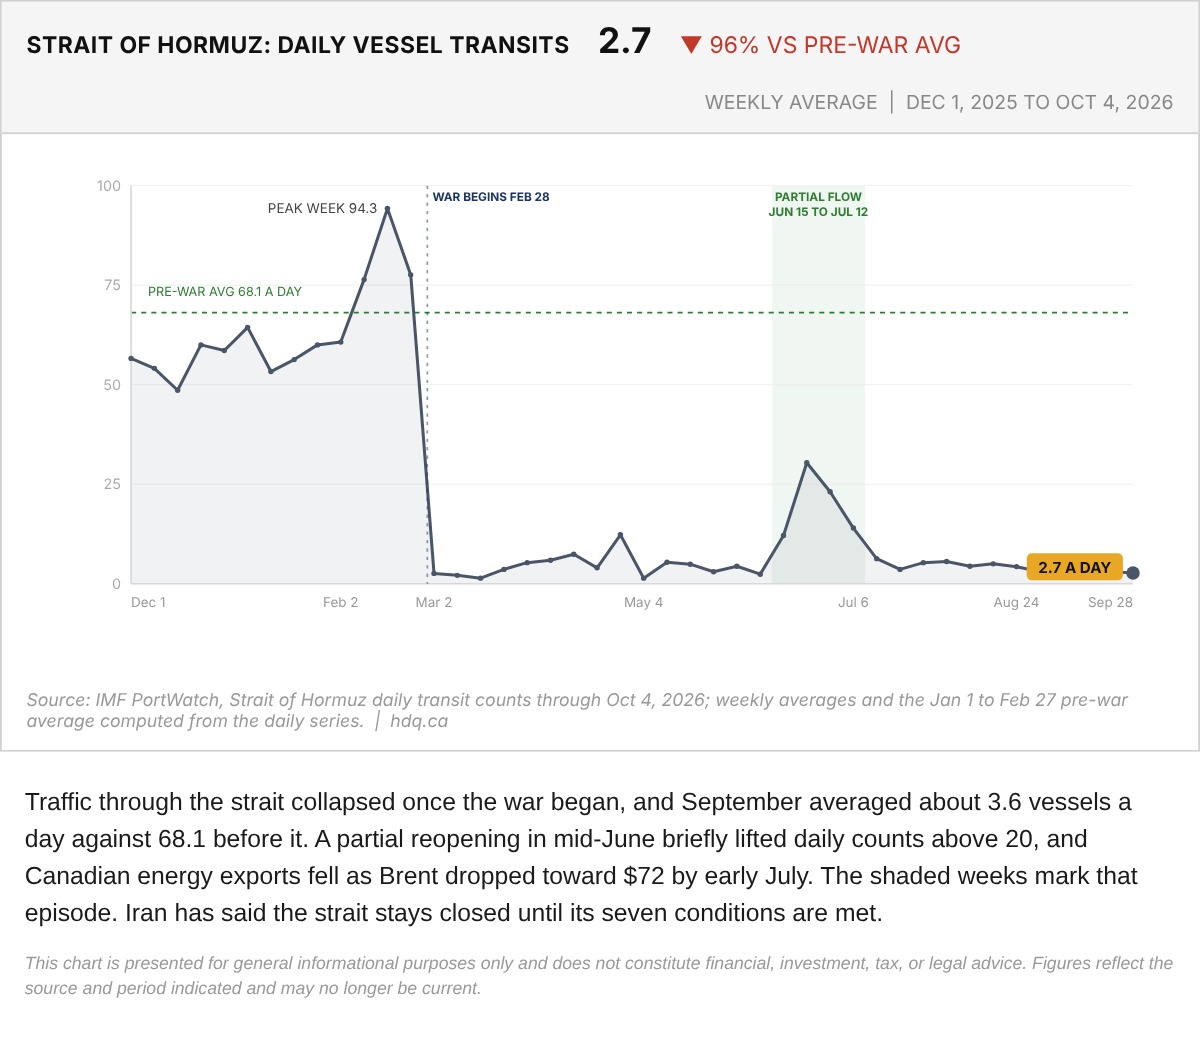
Traffic through the strait collapsed once the war began, and September averaged about 3.6 vessels a day against 68.1 before it.
Strait of Hormuz Weekly Average Vessel Transits, December 2025 to October 2026
October 7, 2026
View chart & download