October 2026
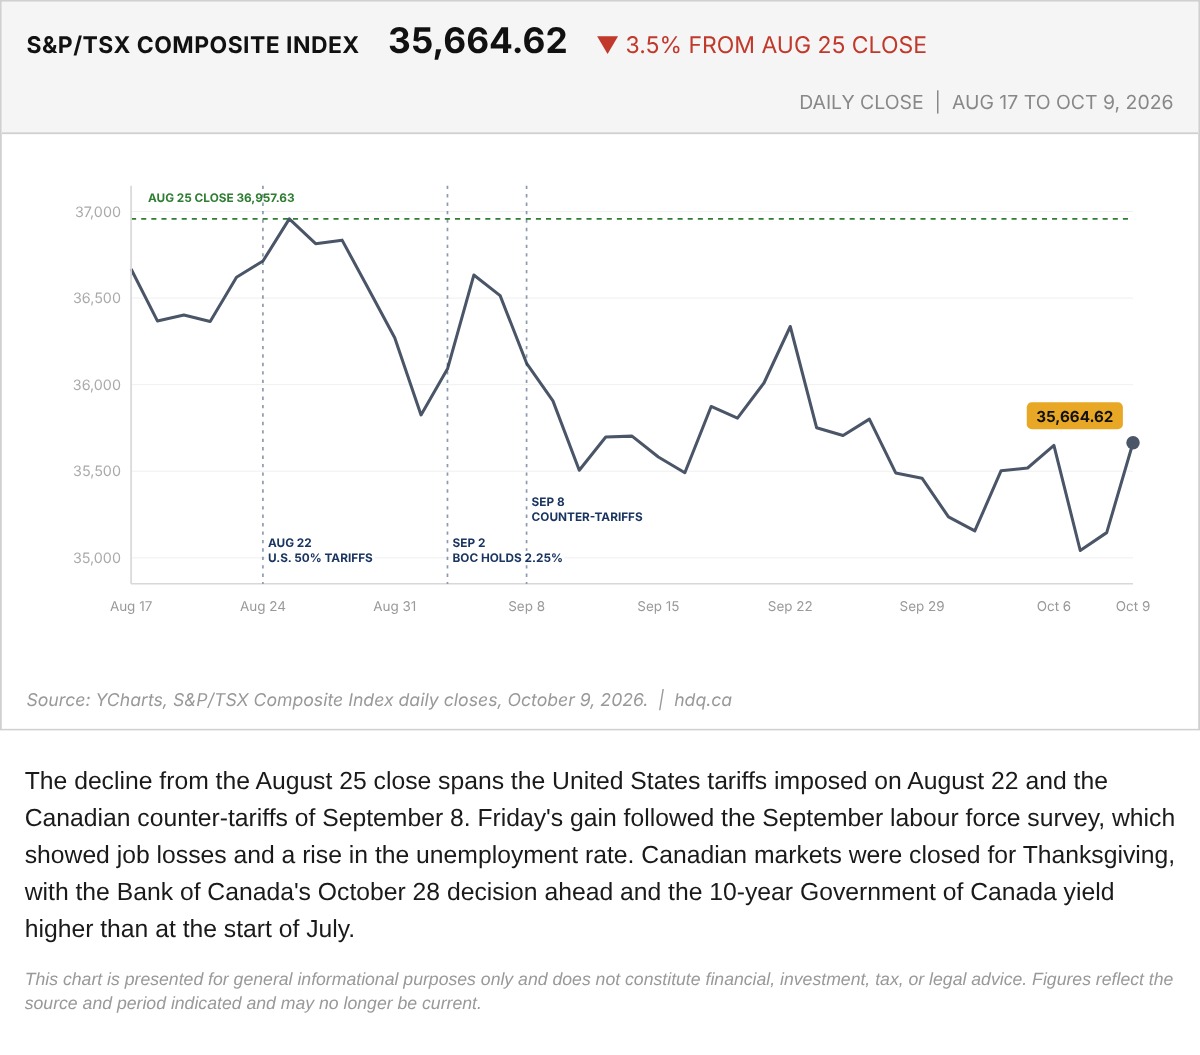
The decline from the August 25 close spans the United States tariffs imposed on August 22 and the Canadian counter-tariffs of September 8.
S&P/TSX Composite From August 17 to October 9, Before Thanksgiving
October 12, 2026
View chart & download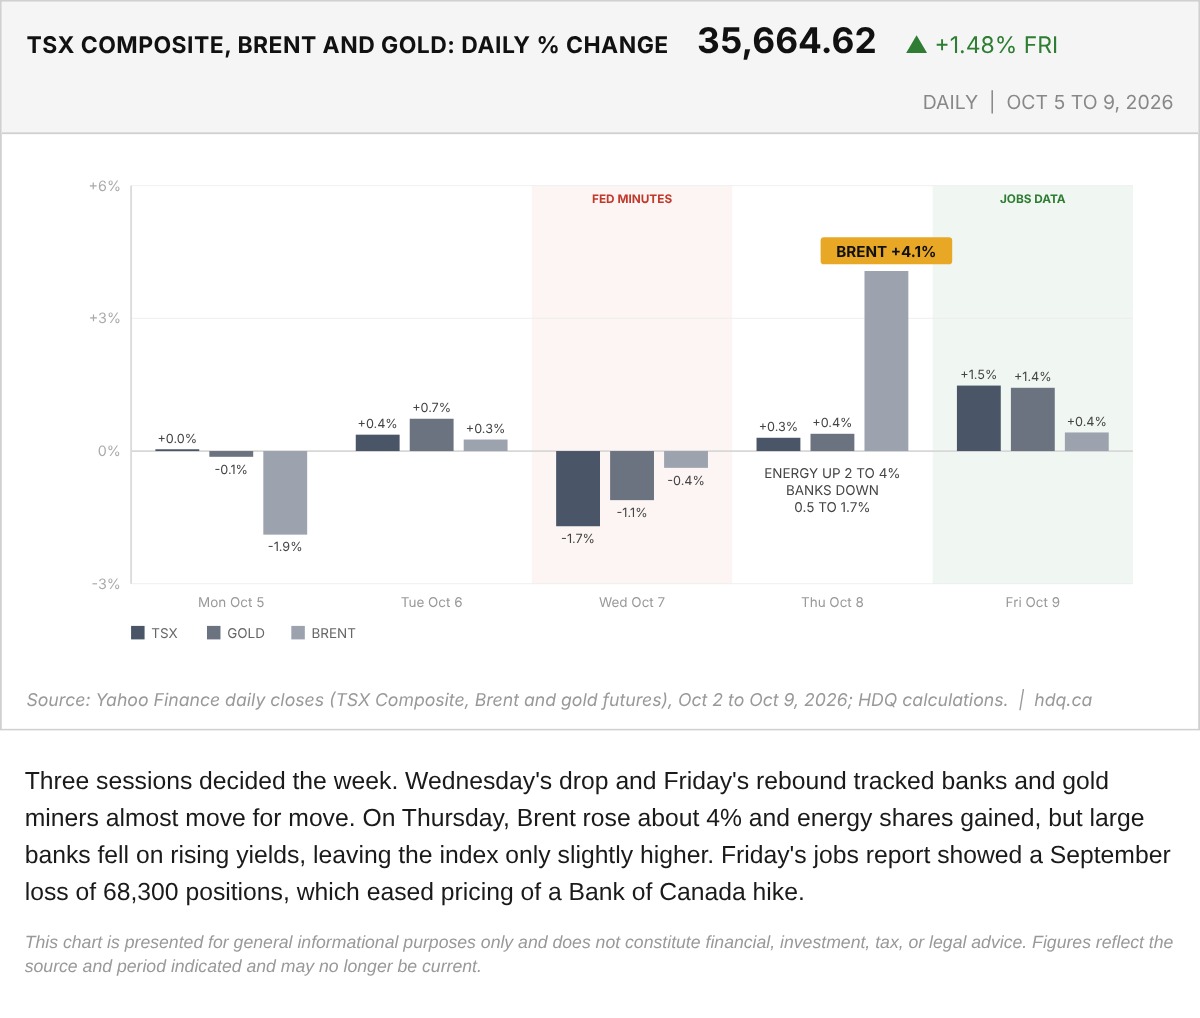
Three sessions decided the week.
TSX, Brent and Gold Daily Percentage Changes, October 5 to 9
October 10, 2026
View chart & download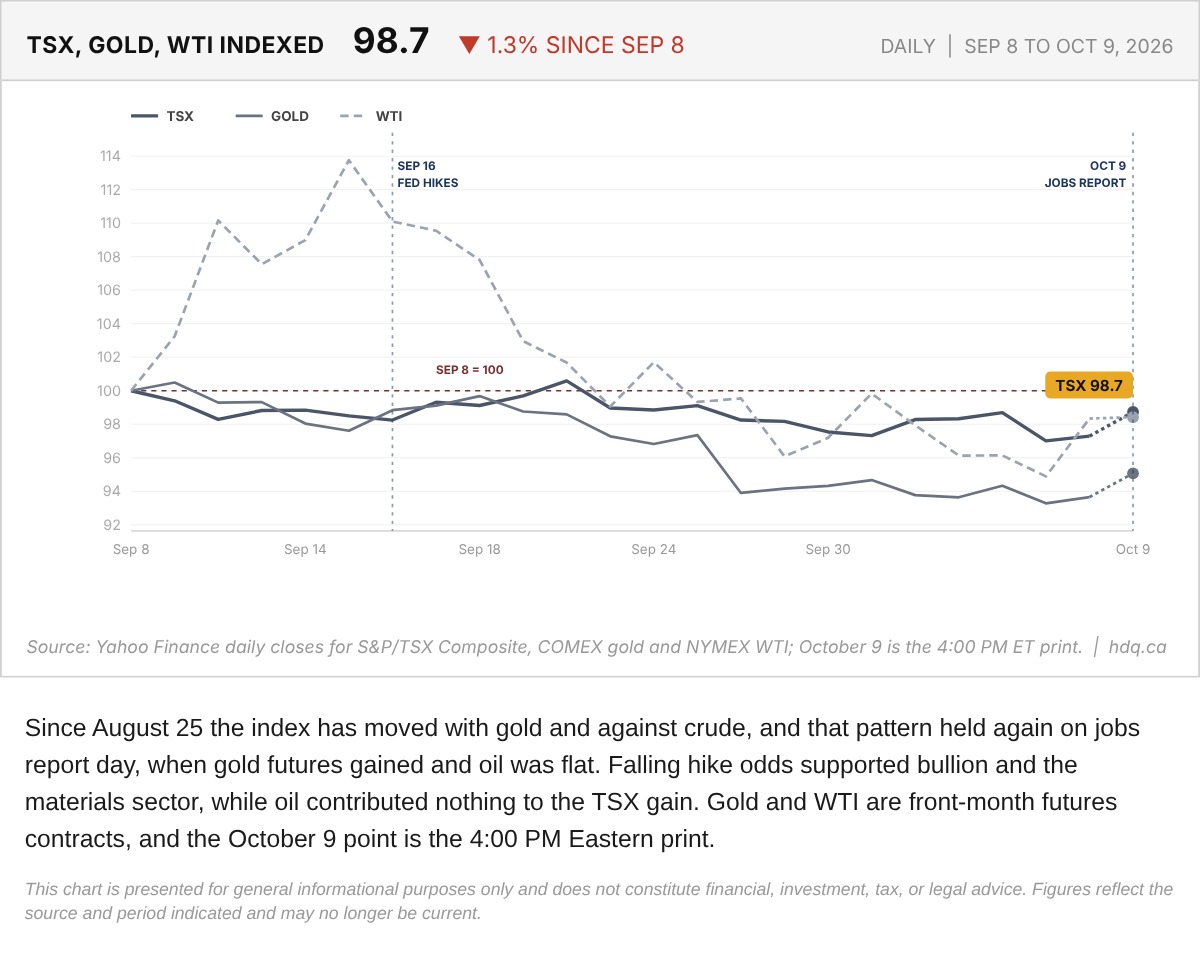
Since August 25 the index has moved with gold and against crude, and that pattern held again on jobs report day, when gold futures gained and oil was flat.
TSX, Gold and WTI Indexed to the September 8 Close
October 9, 2026
View chart & download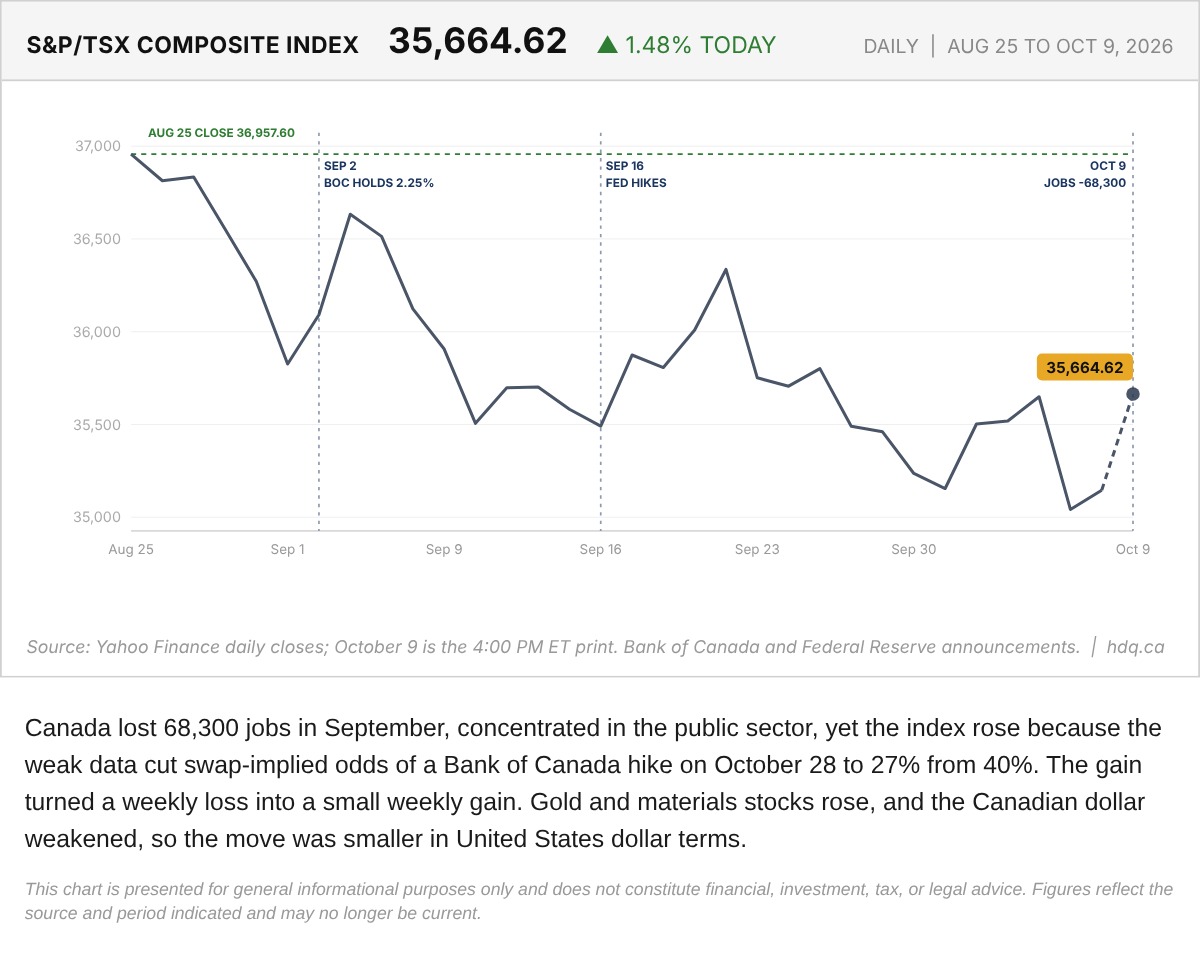
Canada lost 68,300 jobs in September, concentrated in the public sector, yet the index rose because the weak data cut swap-implied odds of…
S&P/TSX Composite Since August 25 With the October 9 Jobs Report Reaction
October 9, 2026
View chart & download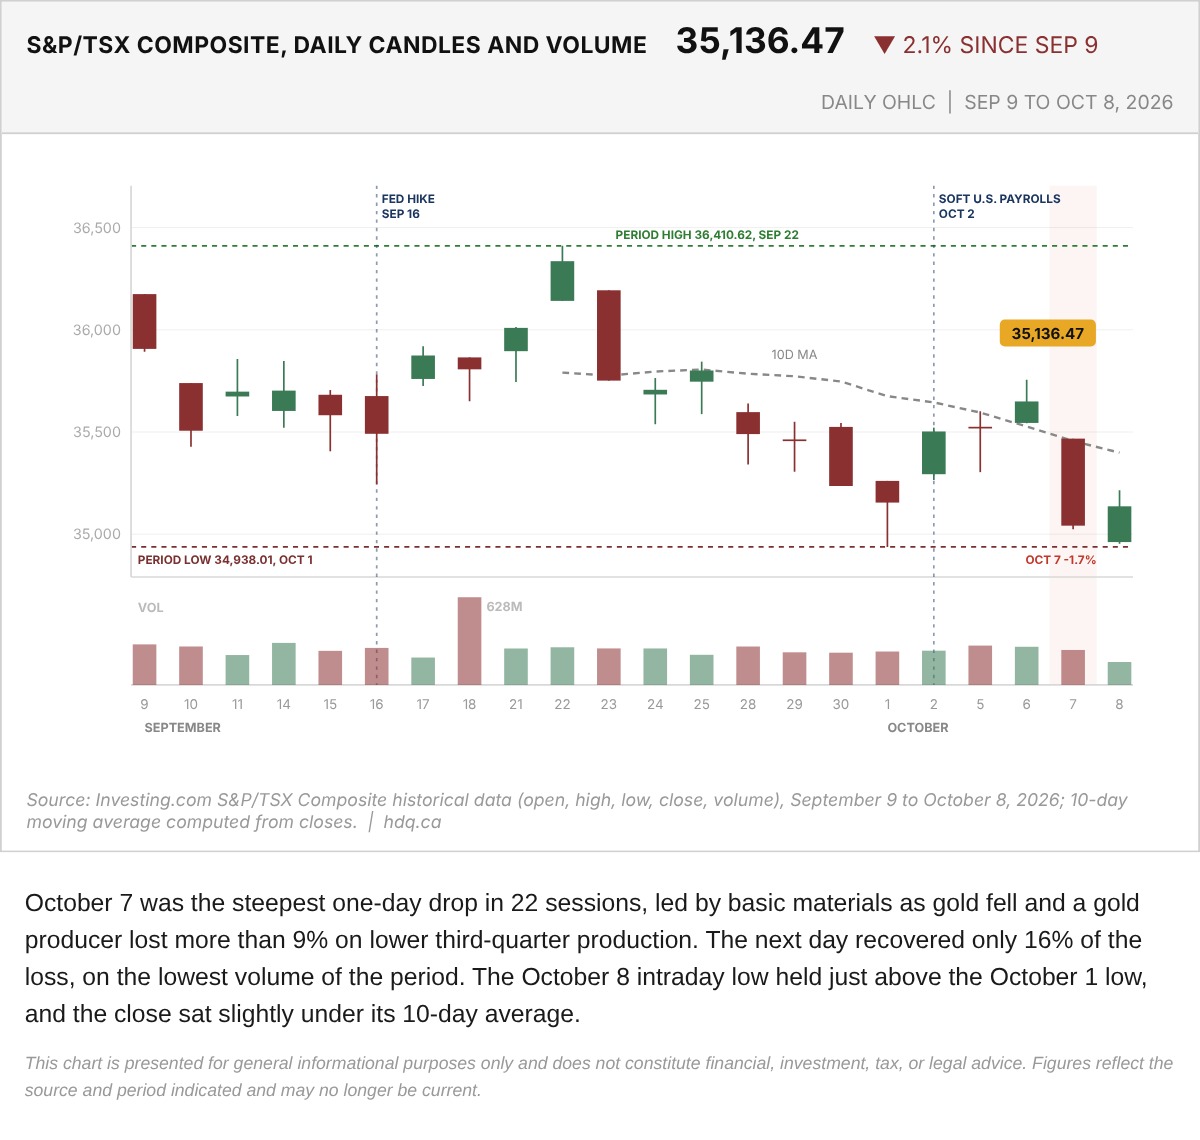
October 7 was the steepest one-day drop in 22 sessions, led by basic materials as gold fell and a gold producer lost more than 9% on lower third-quarter production.
S&P/TSX Composite Daily Candles and Volume, September 9 to October 8
October 9, 2026
View chart & download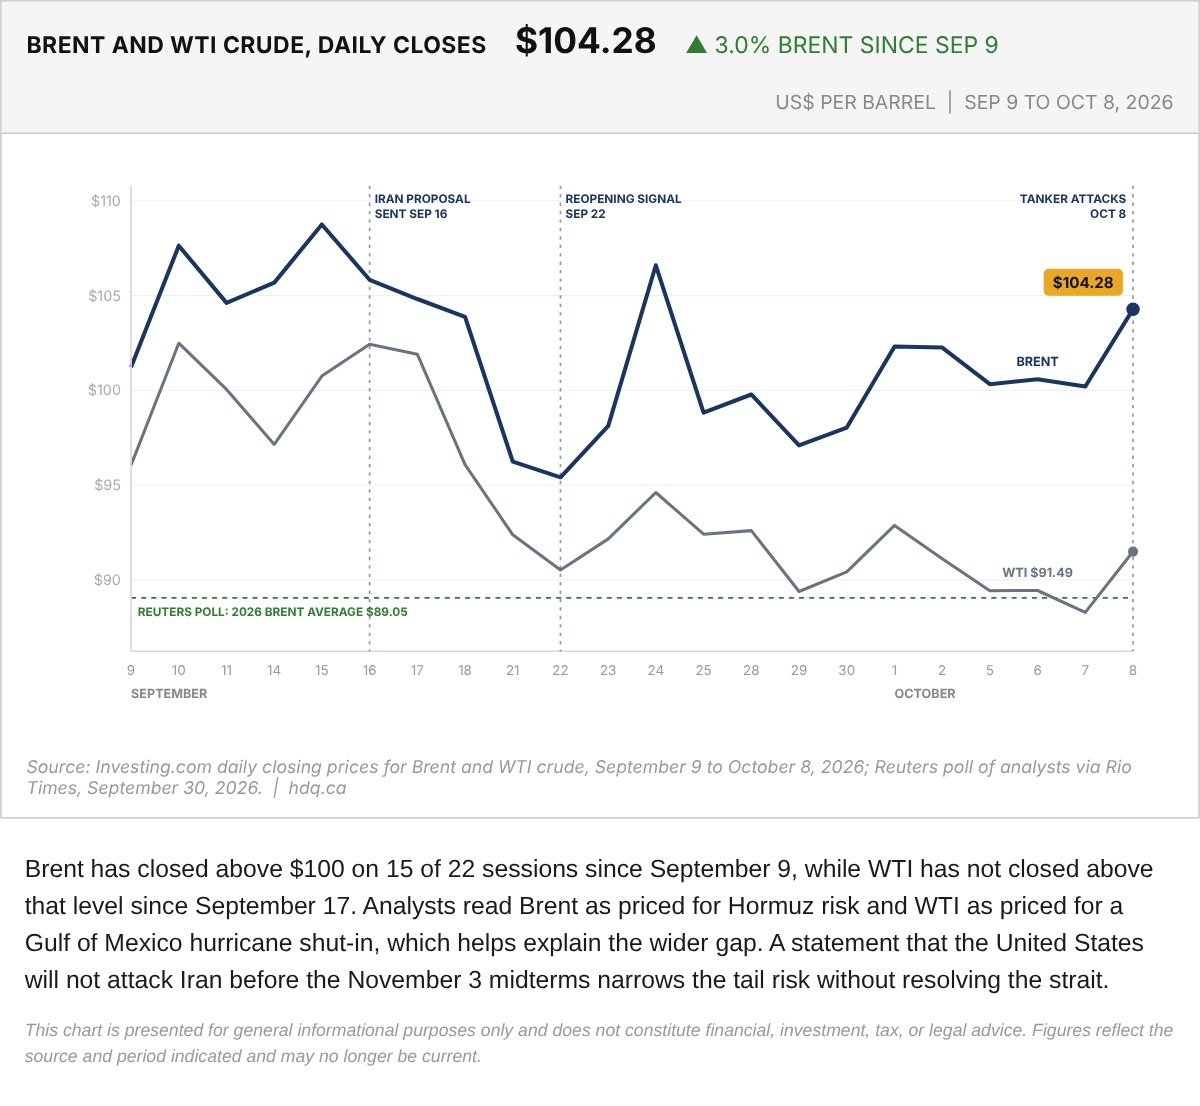
Brent has closed above $100 on 15 of 22 sessions since September 9, while WTI has not closed above that level since September 17.
Brent and WTI Crude Daily Closes, September 9 to October 8
October 9, 2026
View chart & download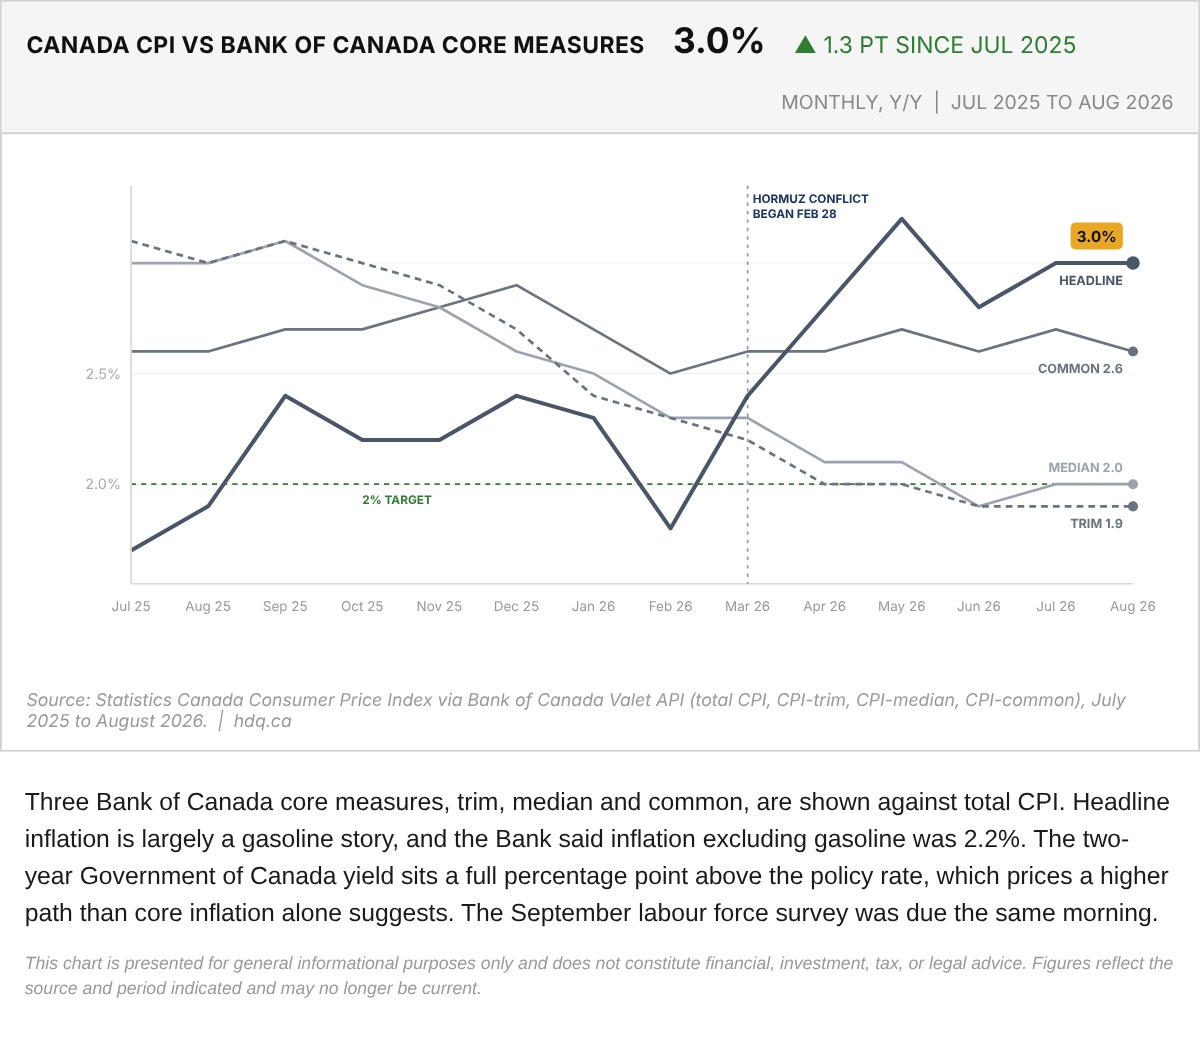
Three Bank of Canada core measures, trim, median and common, are shown against total CPI.
Canada CPI Against Bank of Canada Core Measures, July 2025 to August 2026
October 9, 2026
View chart & download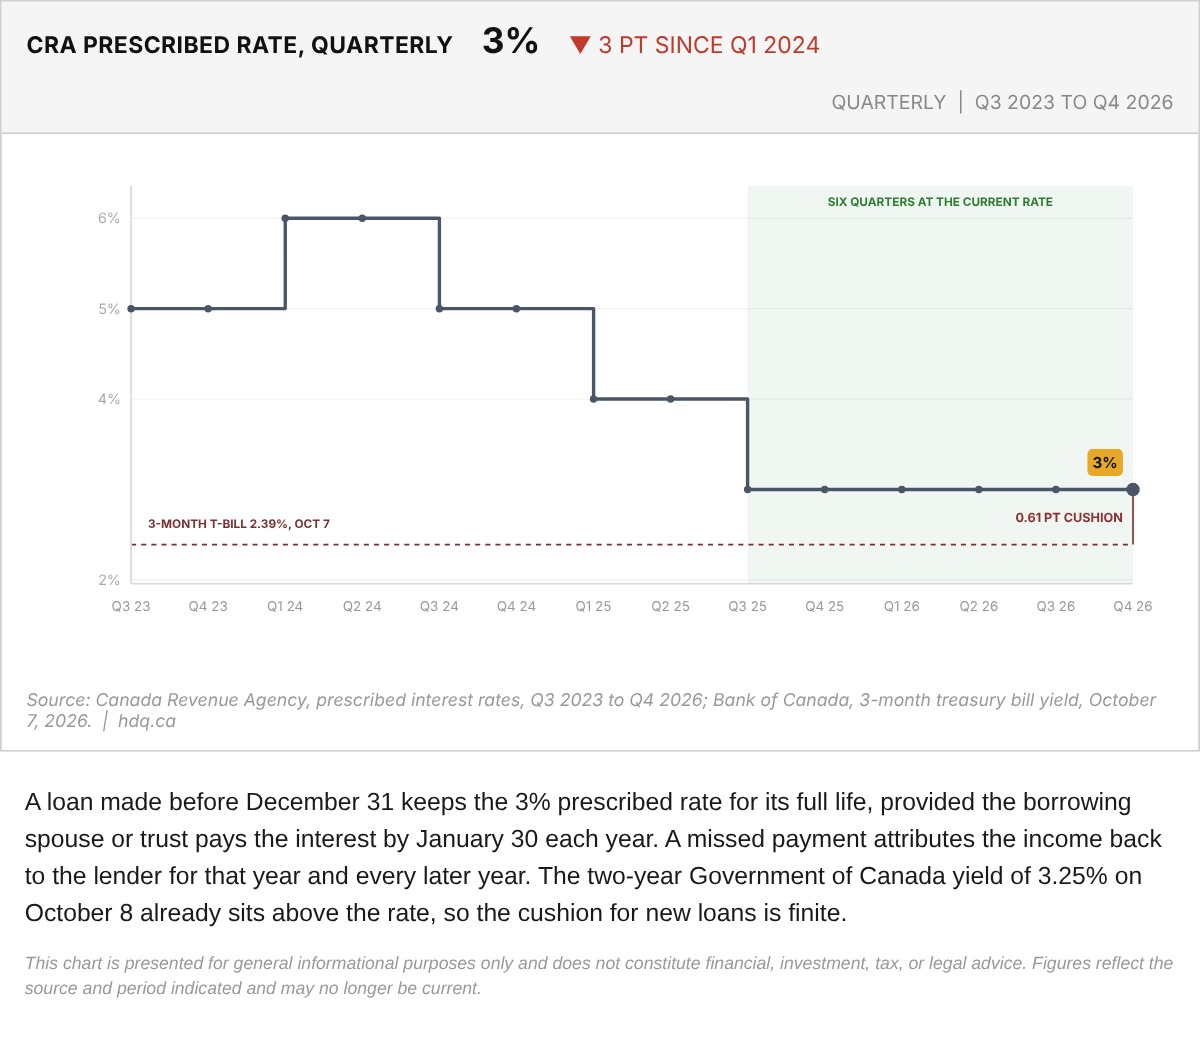
A loan made before December 31 keeps the 3% prescribed rate for its full life, provided the borrowing spouse or trust pays the interest by January 30 each year.
CRA Prescribed Rate, Q3 2023 to Q4 2026, With the 3-Month Bill Yield
October 9, 2026
View chart & download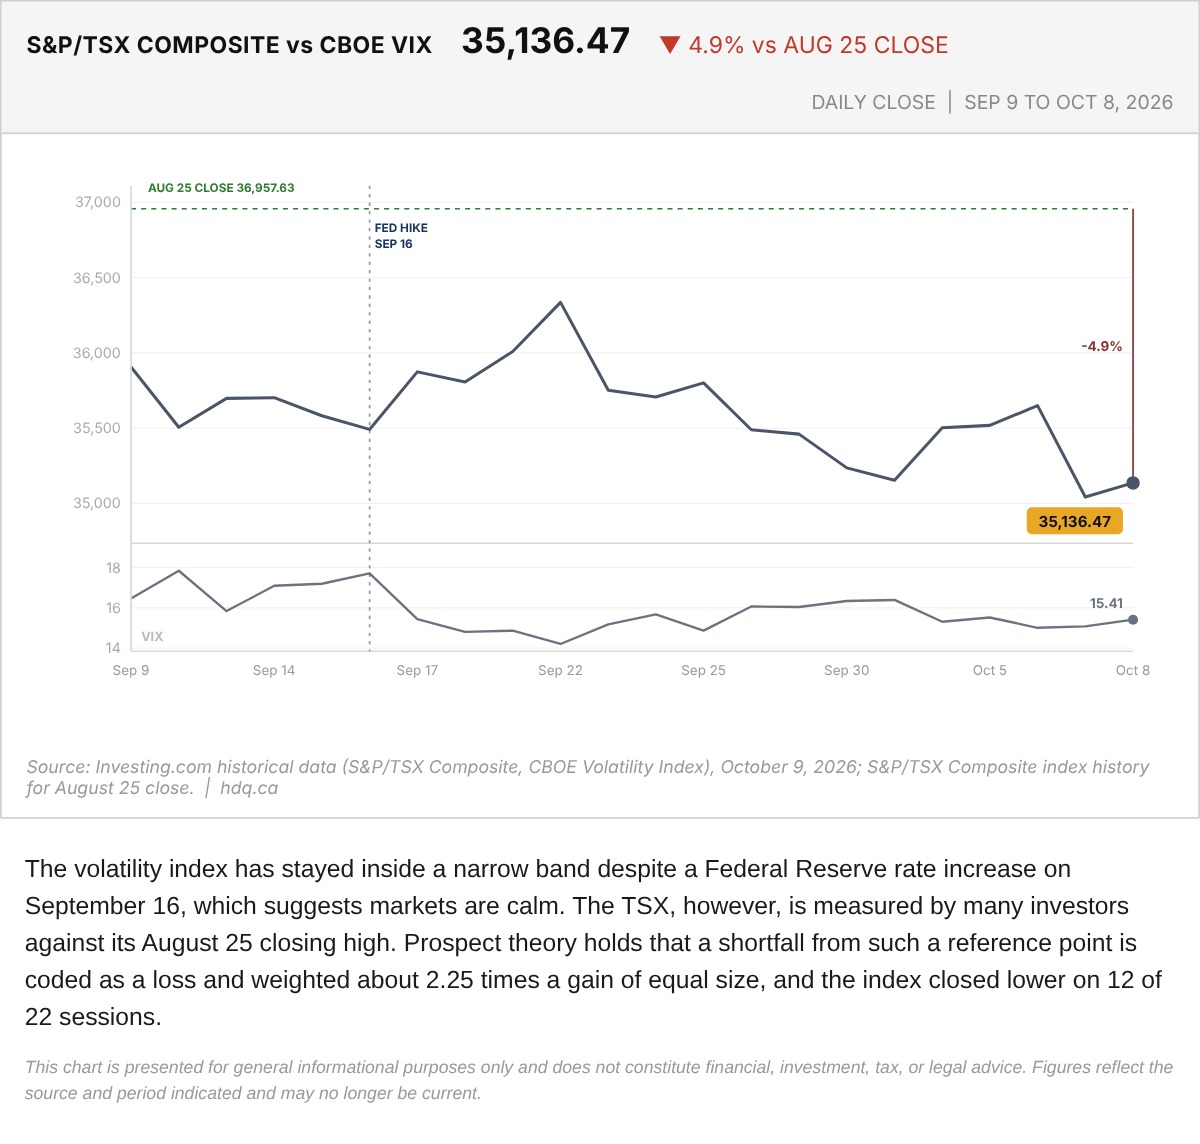
The volatility index has stayed inside a narrow band despite a Federal Reserve rate increase on September 16, which suggests markets are calm.
S&P/TSX Composite Against the Cboe VIX, September 9 to October 8
October 9, 2026
View chart & download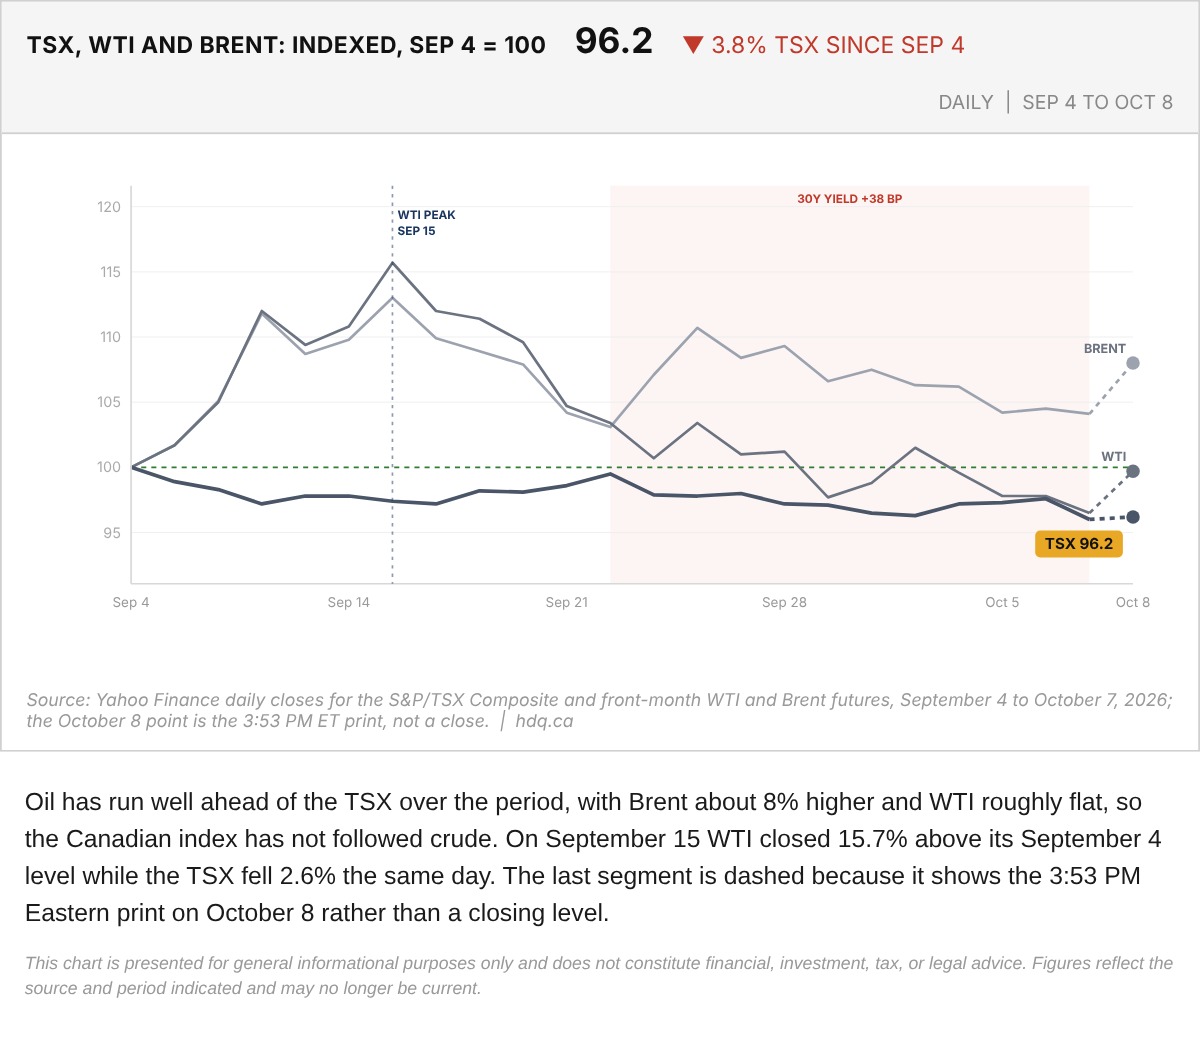
Oil has run well ahead of the TSX over the period, with Brent about 8% higher and WTI roughly flat, so the Canadian index has not followed crude.
TSX, WTI and Brent Indexed to the September 4 Close
October 8, 2026
View chart & download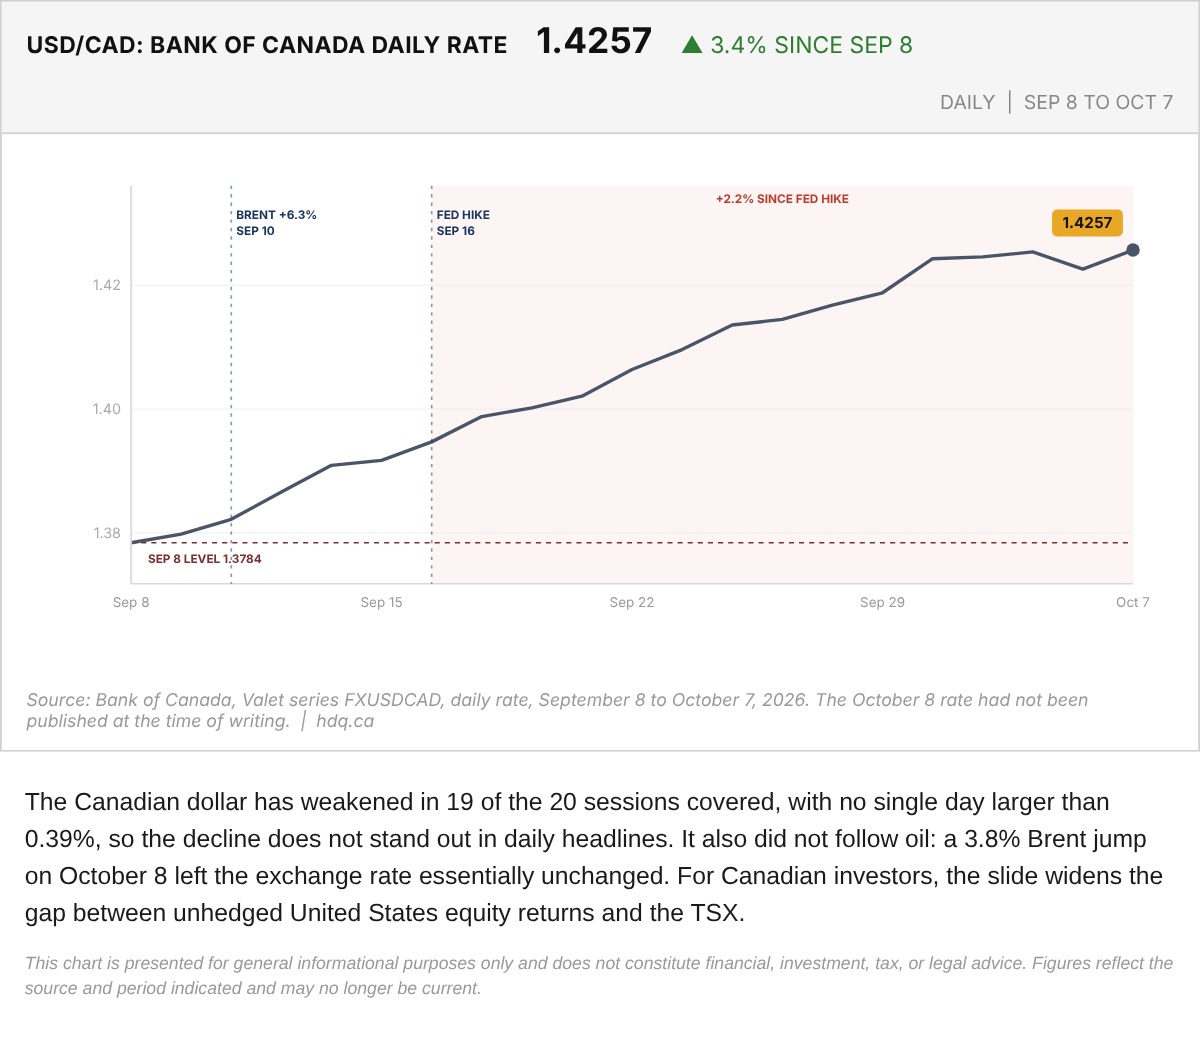
The Canadian dollar has weakened in 19 of the 20 sessions covered, with no single day larger than 0.39%, so the decline does not stand out in daily headlines.
USD/CAD Bank of Canada Daily Rate, September 8 to October 7
October 8, 2026
View chart & download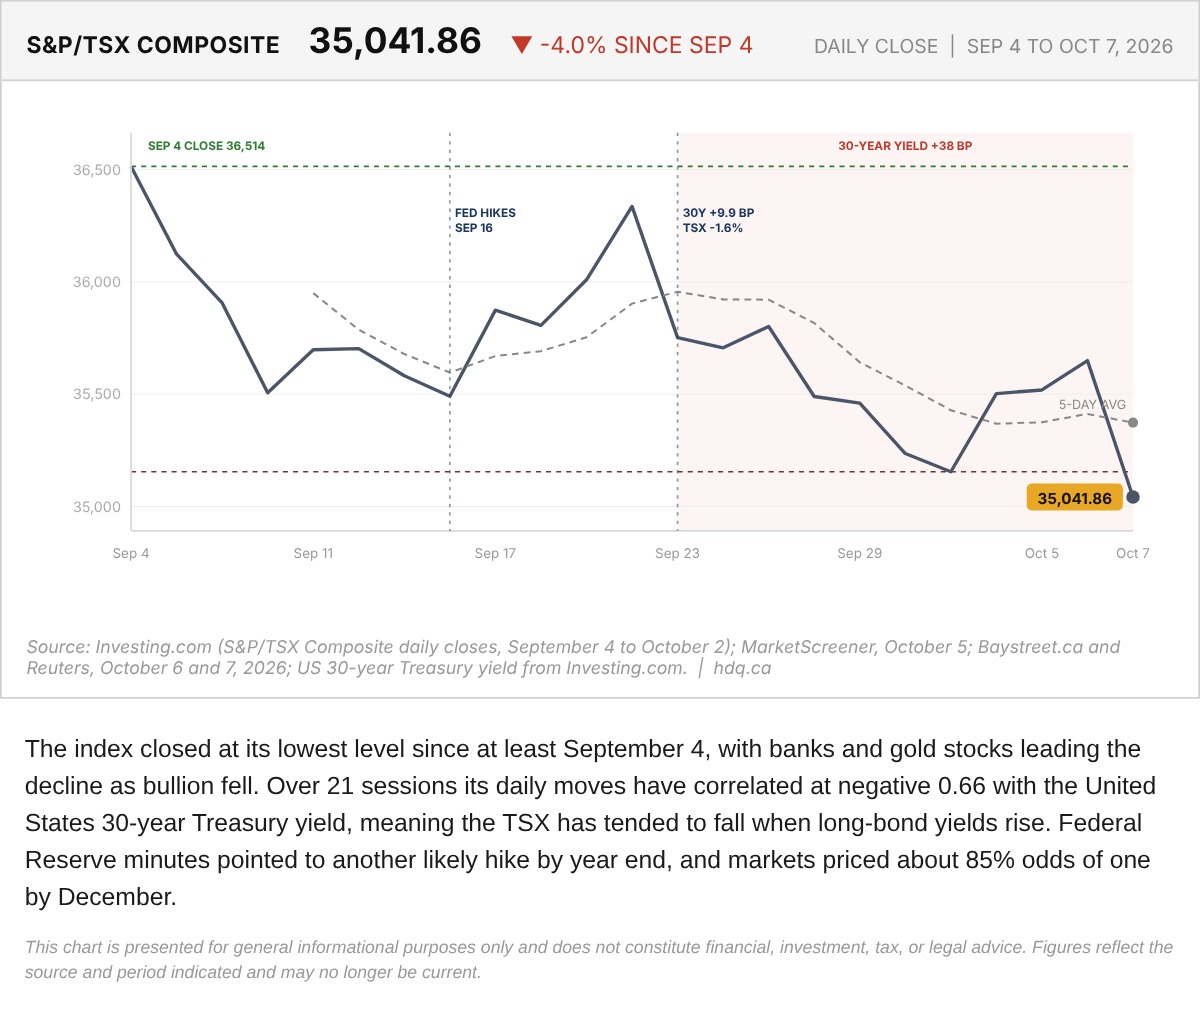
The index closed at its lowest level since at least September 4, with banks and gold stocks leading the decline as bullion fell.
S&P/TSX Composite With Five-Session Average, September 4 to October 7
October 8, 2026
View chart & download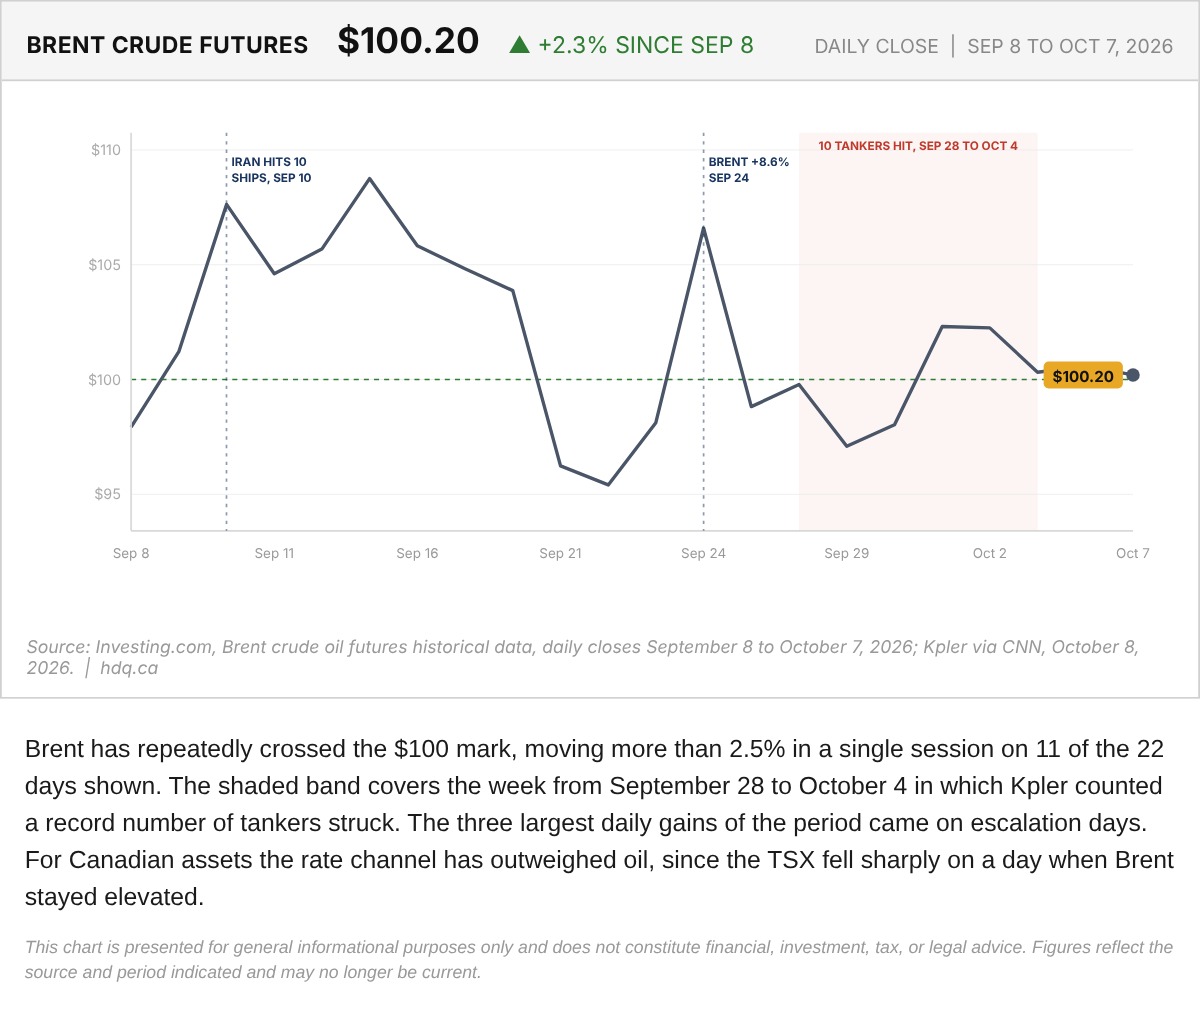
Brent has repeatedly crossed the $100 mark, moving more than 2.5% in a single session on 11 of the 22 days shown.
Brent Crude Futures Daily Close, September 8 to October 7
October 8, 2026
View chart & download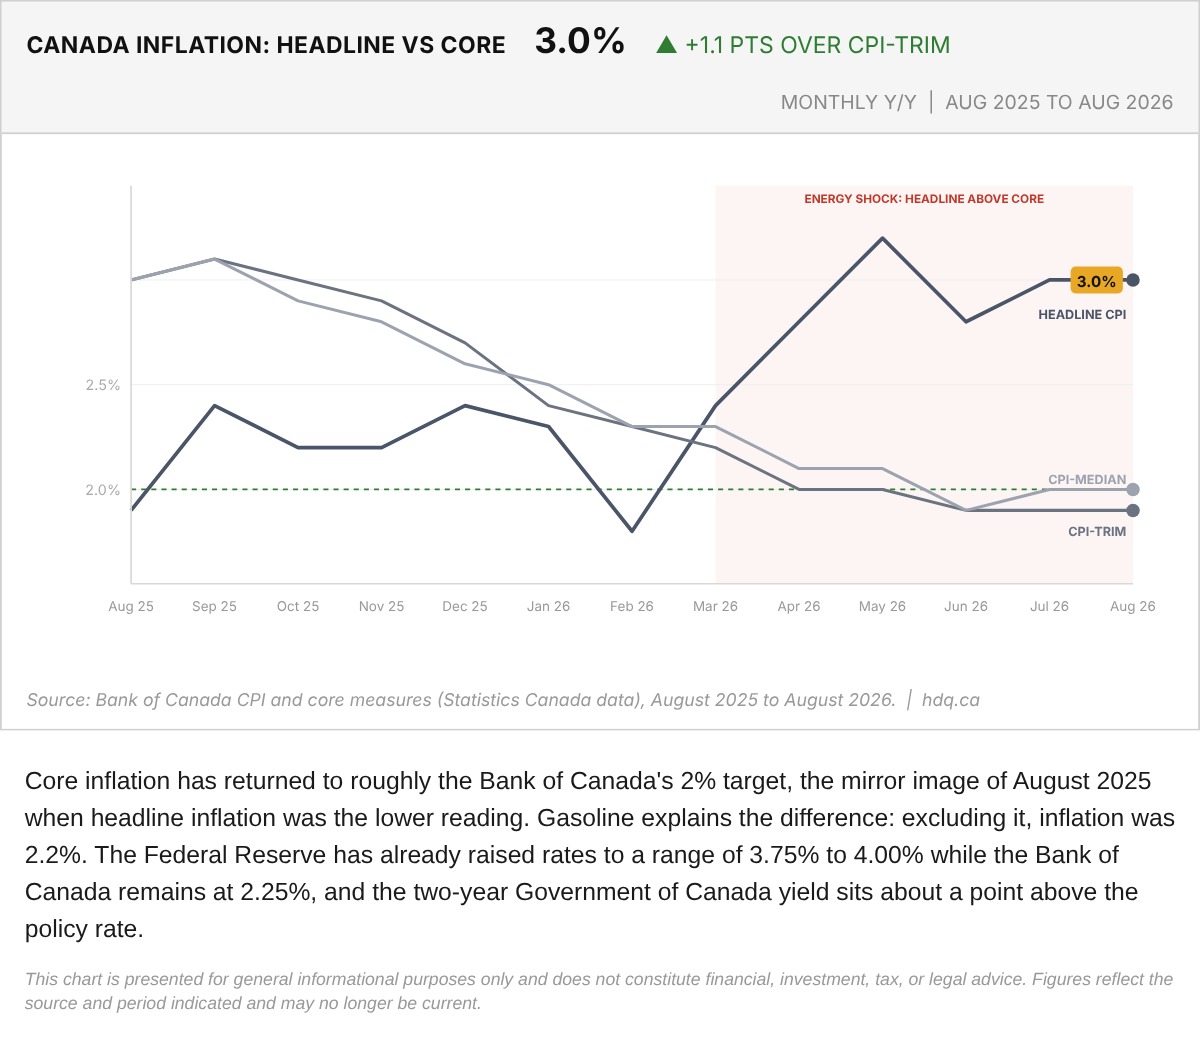
Core inflation has returned to roughly the Bank of Canada's 2% target, the mirror image of August 2025 when headline inflation was the lower reading.
Canada Headline CPI and Core Inflation Against the 2% Target
October 8, 2026
View chart & download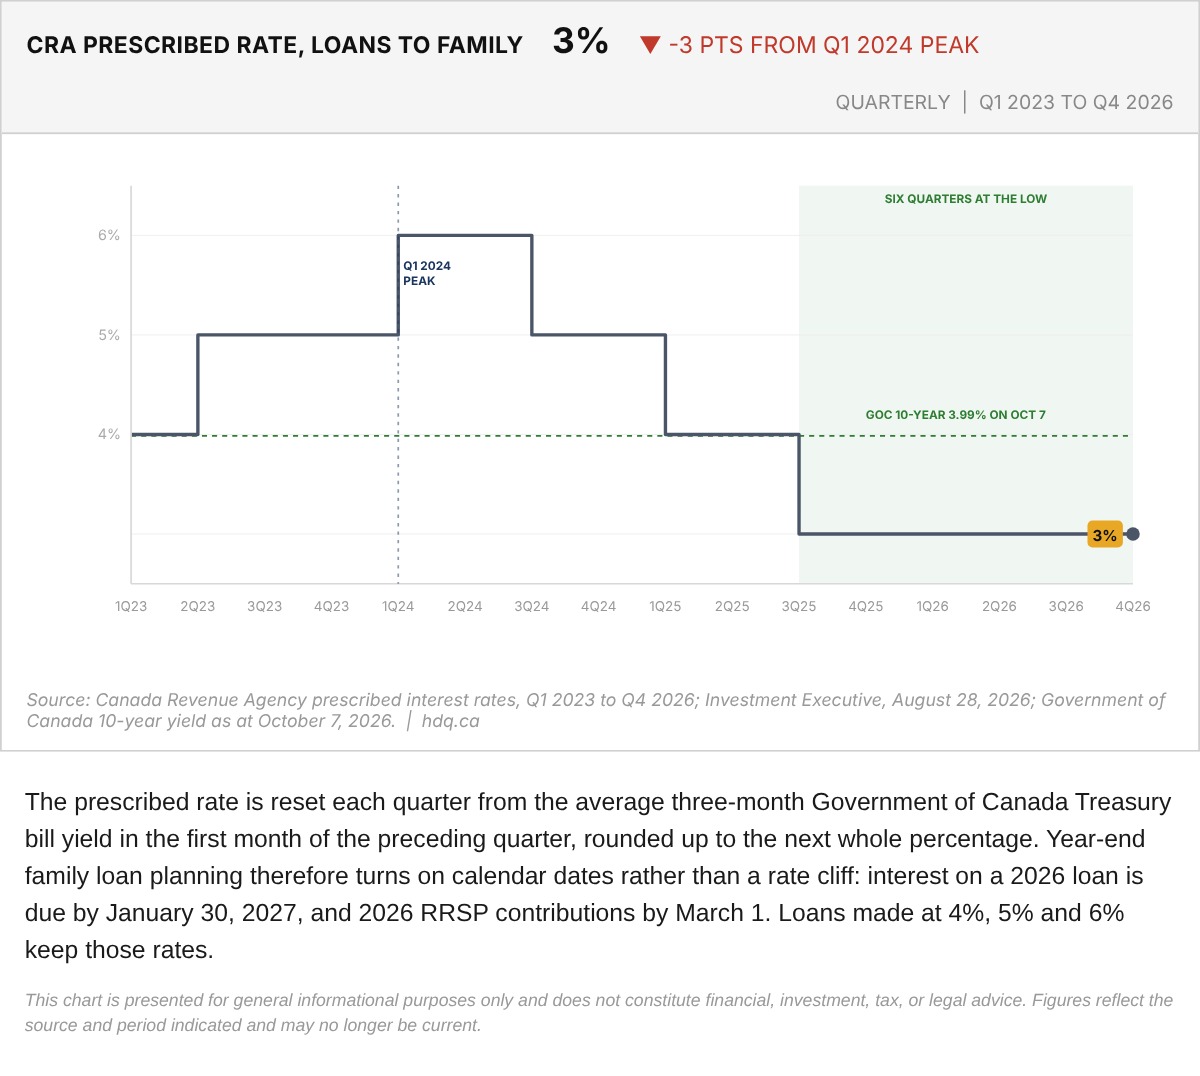
The prescribed rate is reset each quarter from the average three-month Government of Canada Treasury bill yield in the first month of the…
CRA Prescribed Rate for Family Loans, Q1 2023 to Q4 2026
October 8, 2026
View chart & download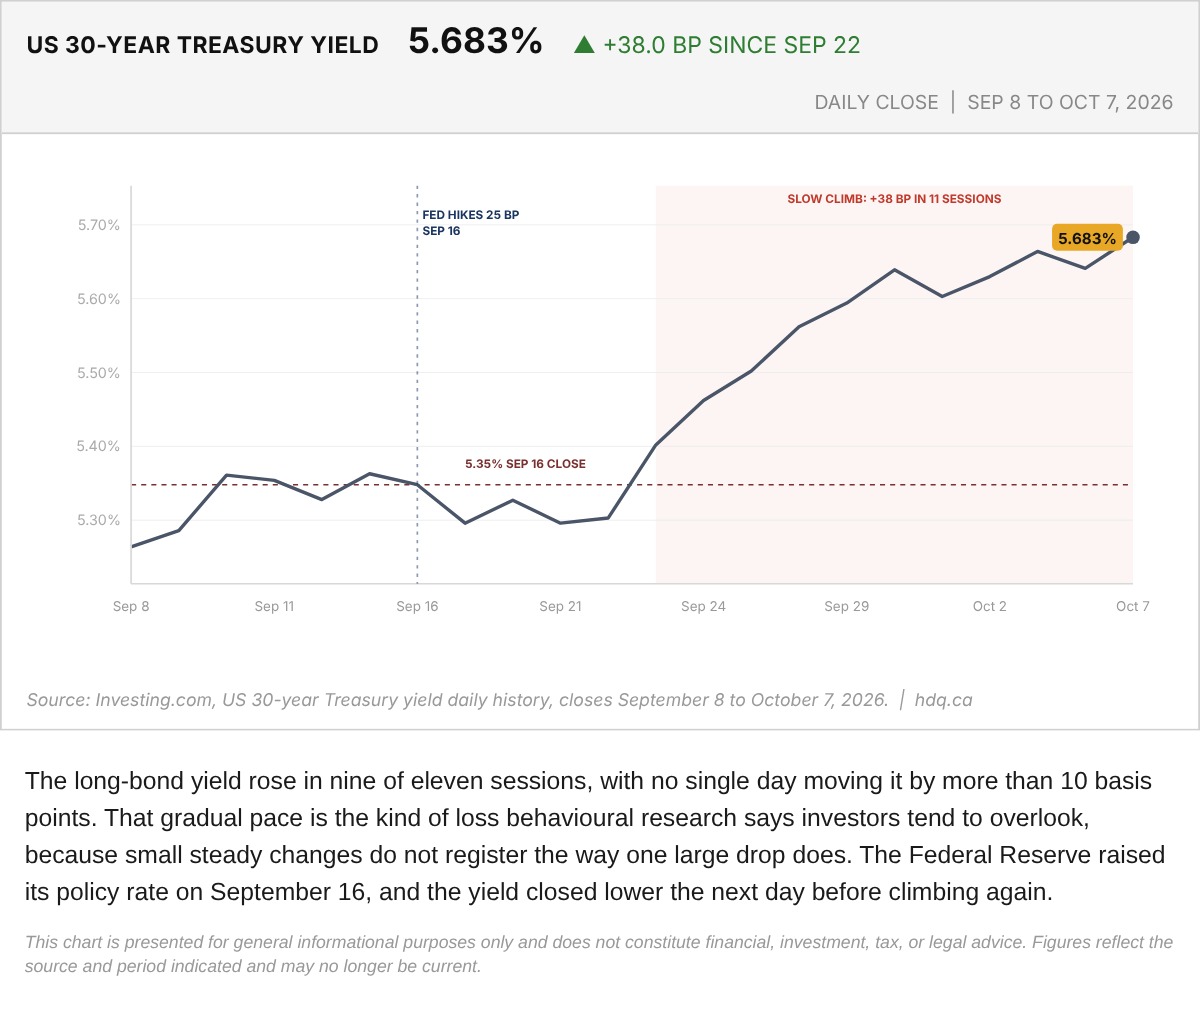
The long-bond yield rose in nine of eleven sessions, with no single day moving it by more than 10 basis points.
US 30-Year Treasury Yield Daily Close, September 8 to October 7
October 8, 2026
View chart & download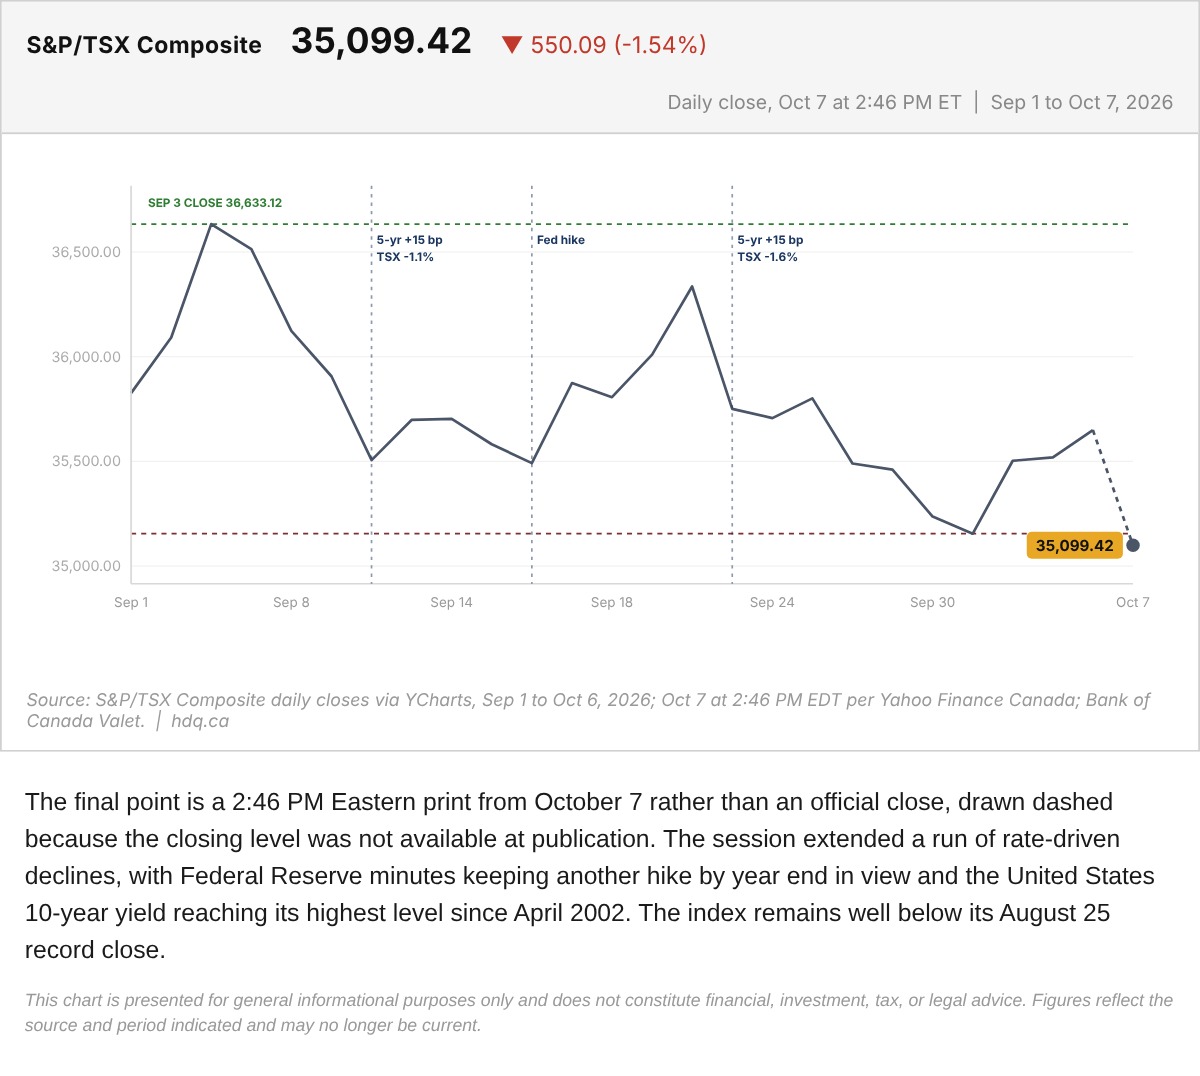
The final point is a 2:46 PM Eastern print from October 7 rather than an official close, drawn dashed because the closing level was not available at publication.
S&P/TSX Composite With the October 7 Midday Print
October 7, 2026
View chart & download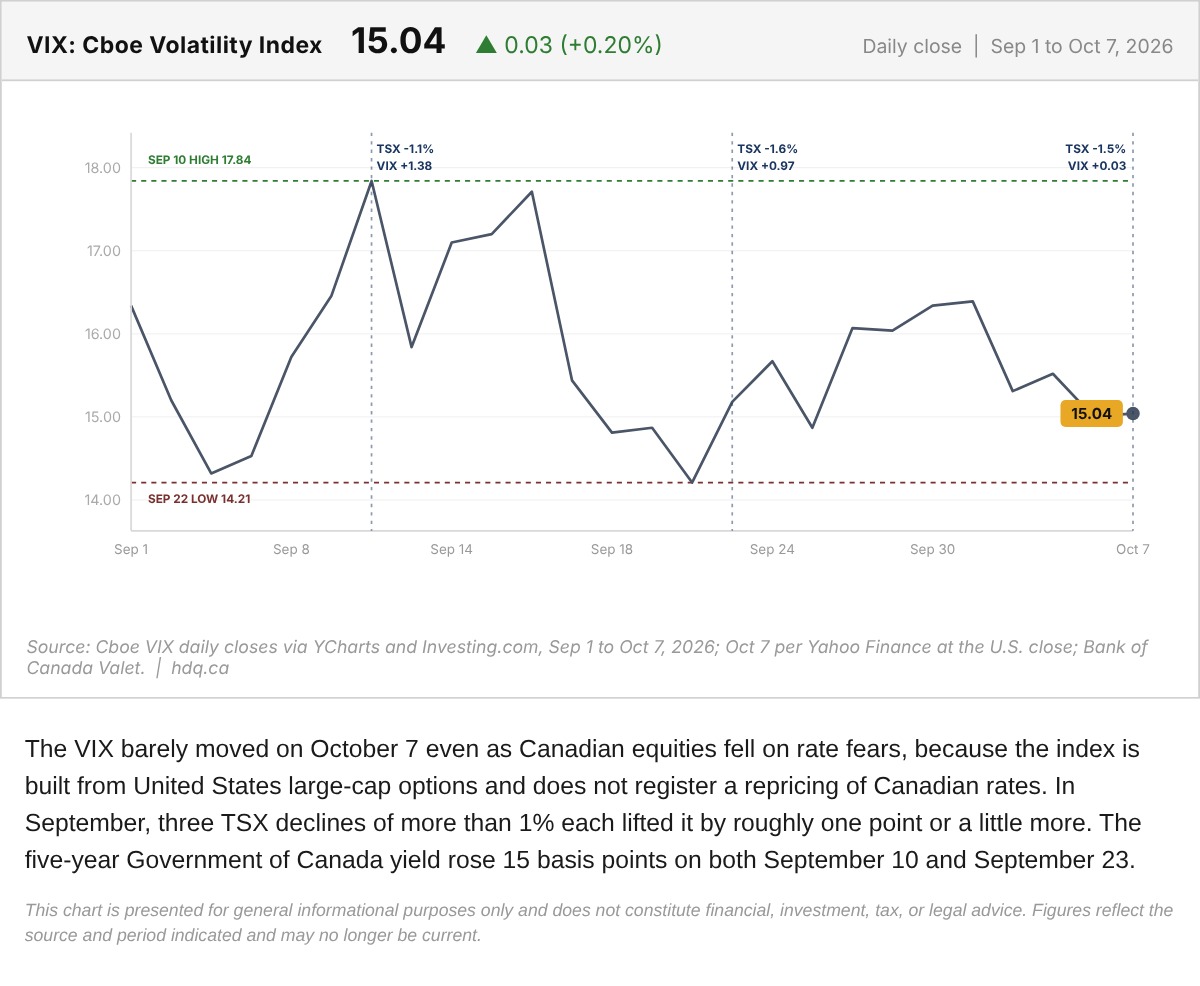
The VIX barely moved on October 7 even as Canadian equities fell on rate fears, because the index is built from United States large-cap…
VIX Daily Close on the Day Rate Fear Hit the TSX
October 7, 2026
View chart & download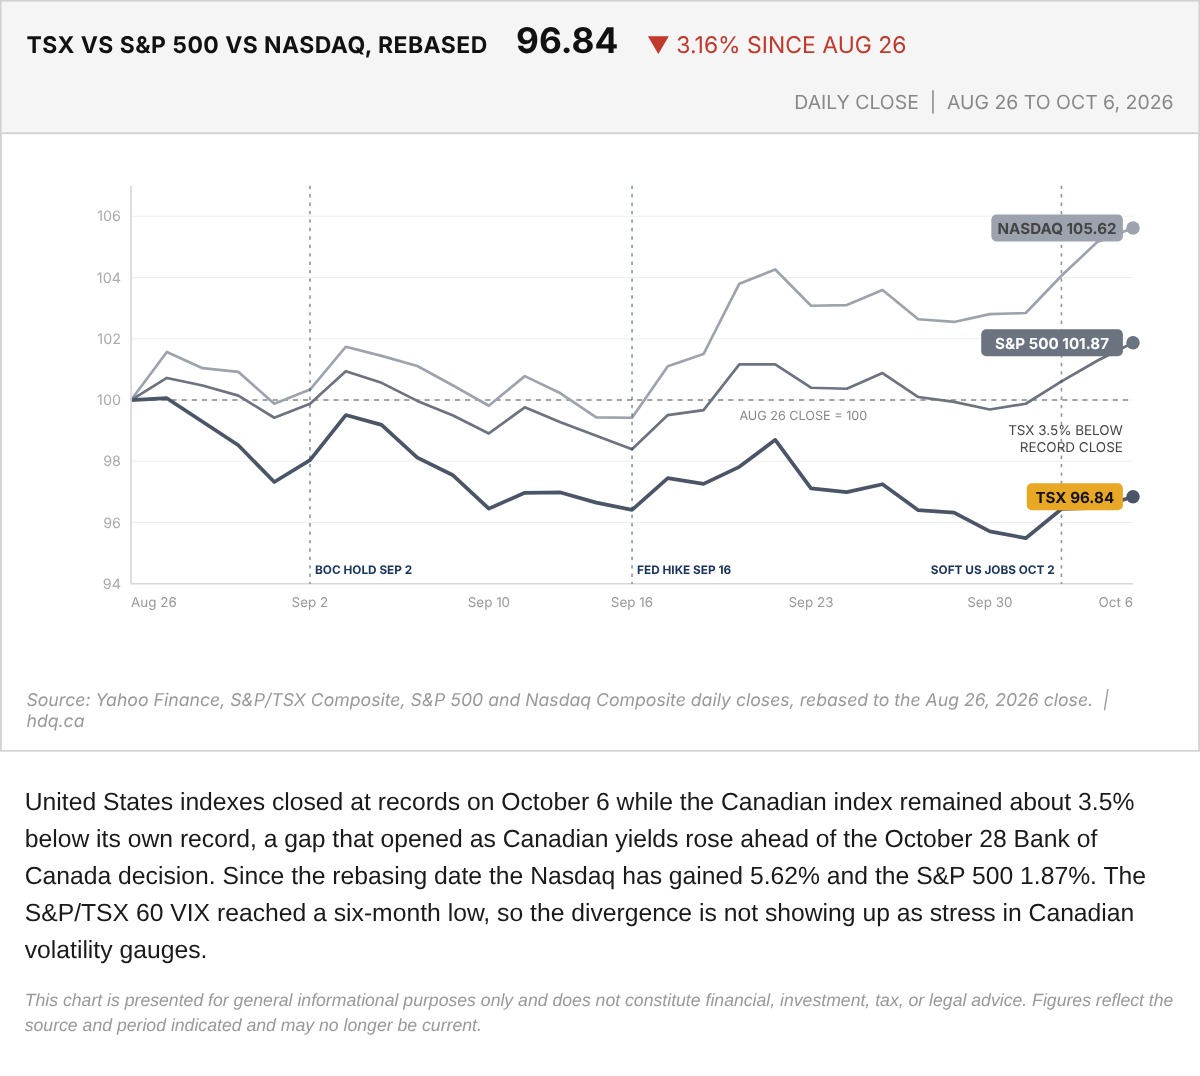
United States indexes closed at records on October 6 while the Canadian index remained about 3.5% below its own record, a gap that opened…
TSX, S&P 500 and Nasdaq Rebased to the August 26 Close
October 7, 2026
View chart & download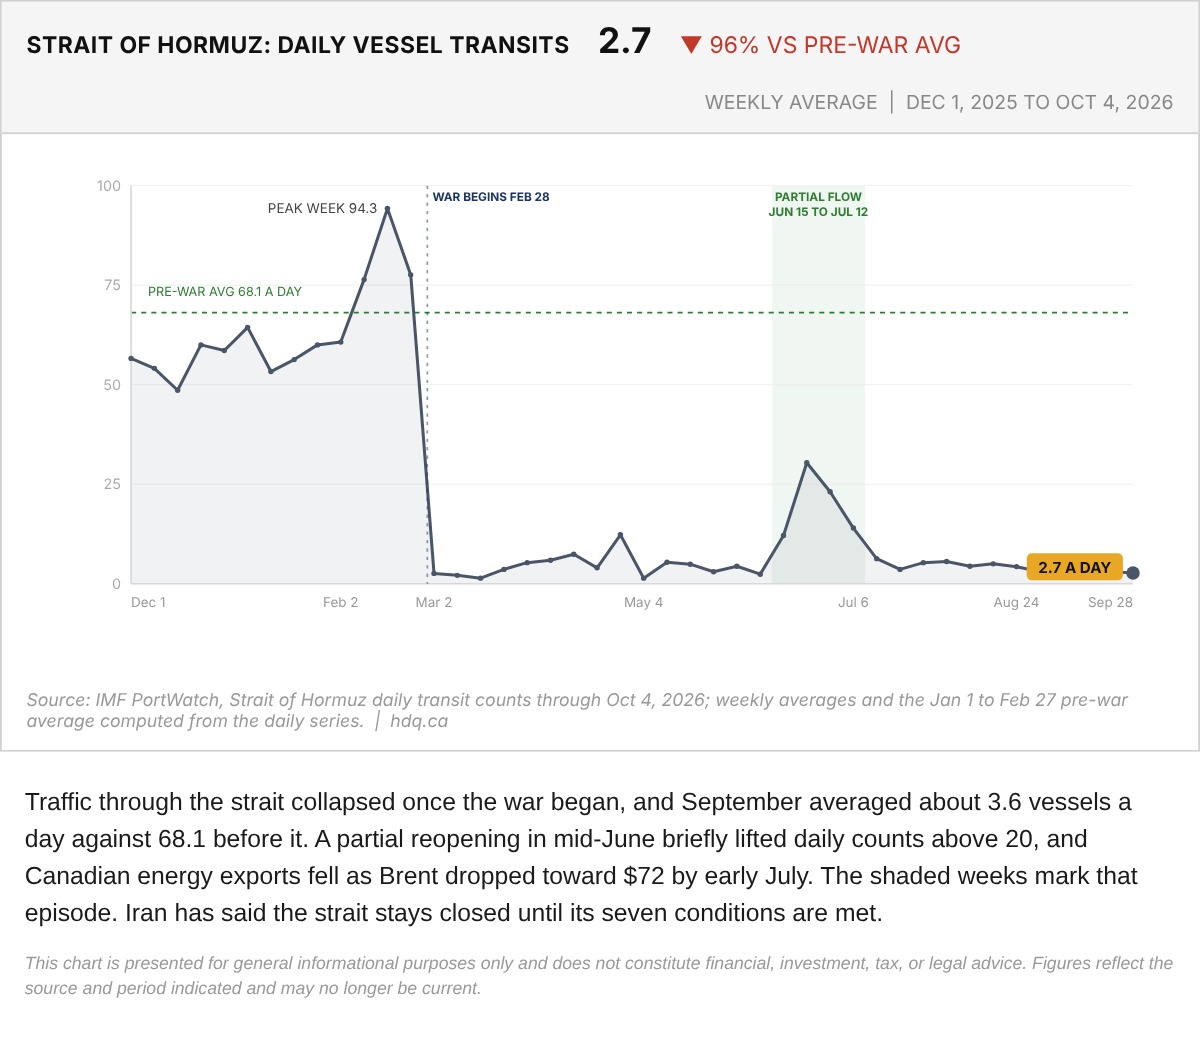
Traffic through the strait collapsed once the war began, and September averaged about 3.6 vessels a day against 68.1 before it.
Strait of Hormuz Weekly Average Vessel Transits, December 2025 to October 2026
October 7, 2026
View chart & download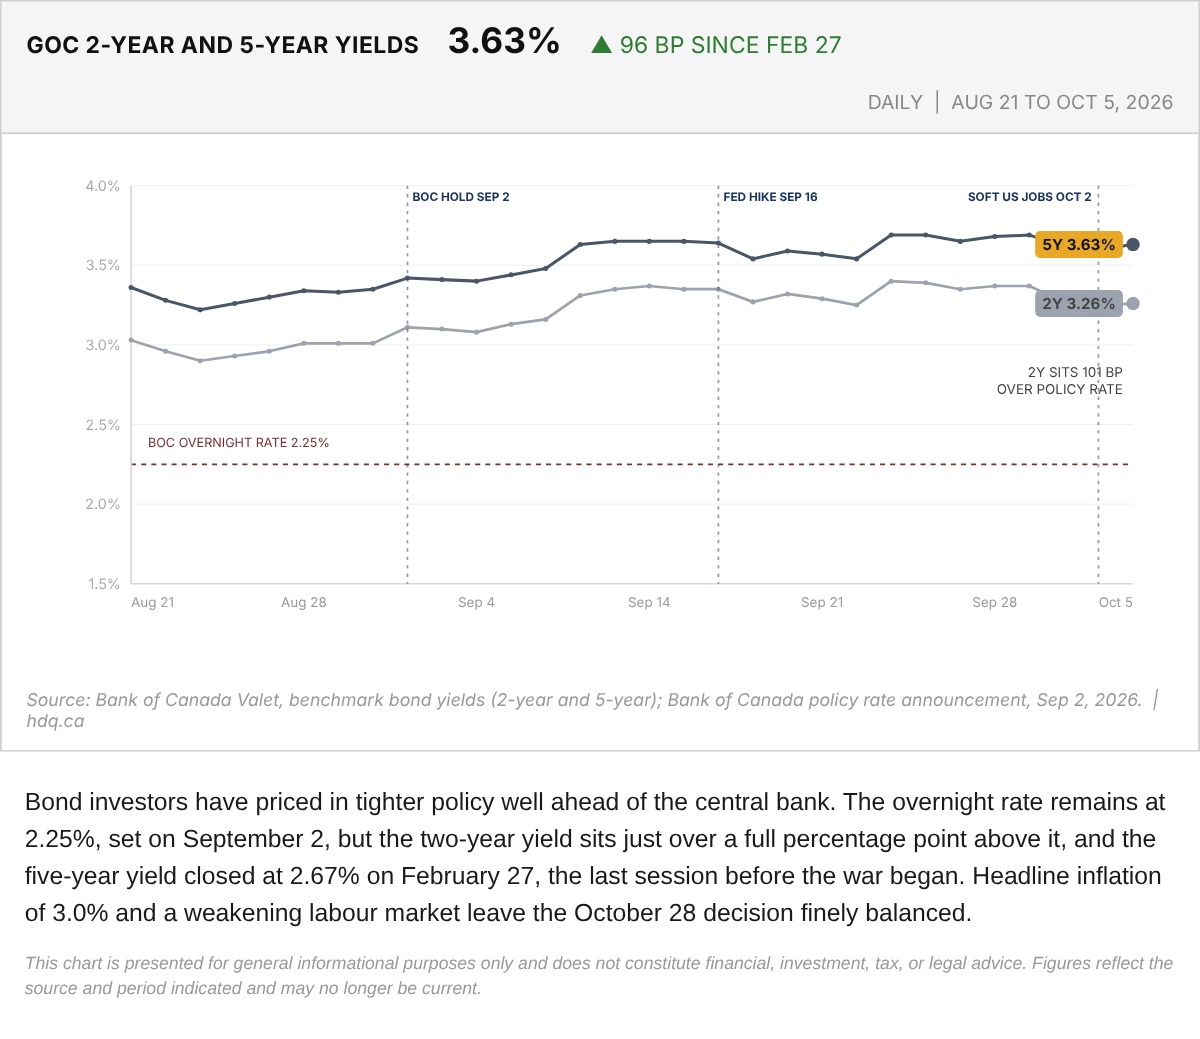
Bond investors have priced in tighter policy well ahead of the central bank.
Government of Canada 2-Year and 5-Year Yields Since the Pre-War Close
October 7, 2026
View chart & download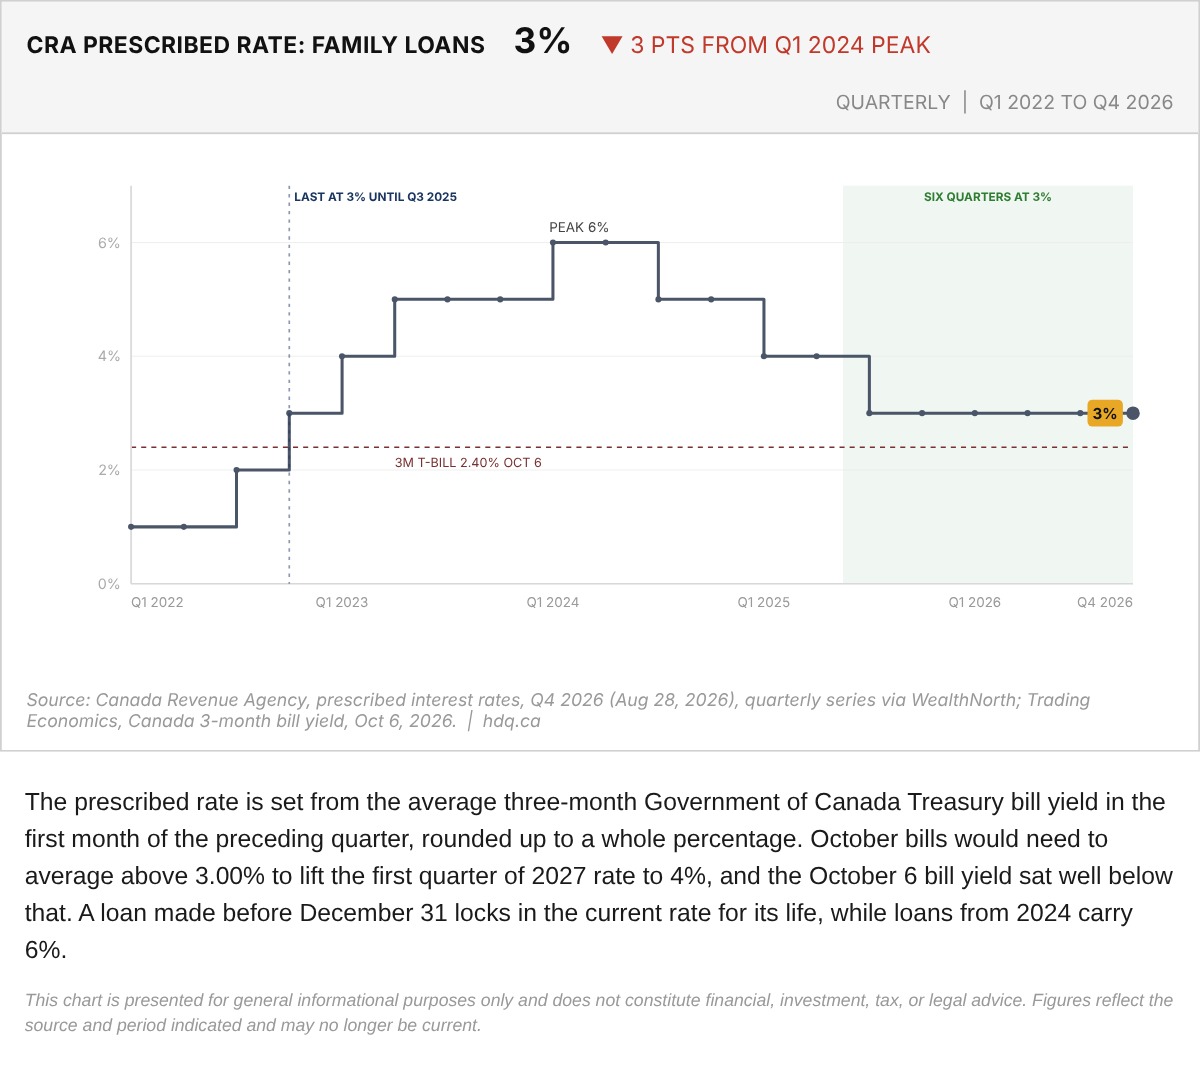
The prescribed rate is set from the average three-month Government of Canada Treasury bill yield in the first month of the preceding quarter, rounded up to a whole percentage.
CRA Prescribed Rate for Family Loans, Q1 2022 to Q4 2026
October 7, 2026
View chart & download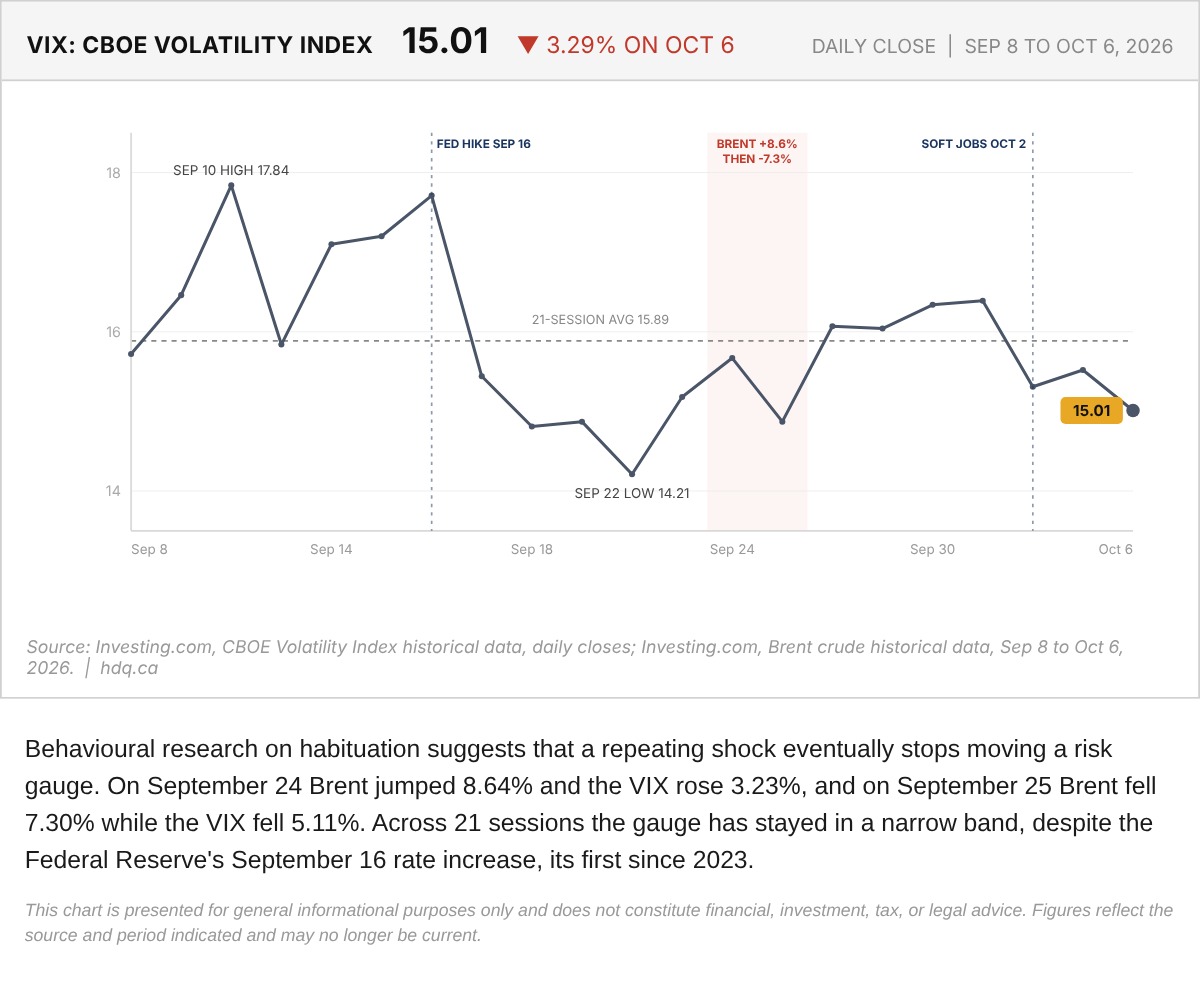
Behavioural research on habituation suggests that a repeating shock eventually stops moving a risk gauge.
VIX Daily Close and Habituation to Oil Shocks, September 8 to October 6
October 7, 2026
View chart & download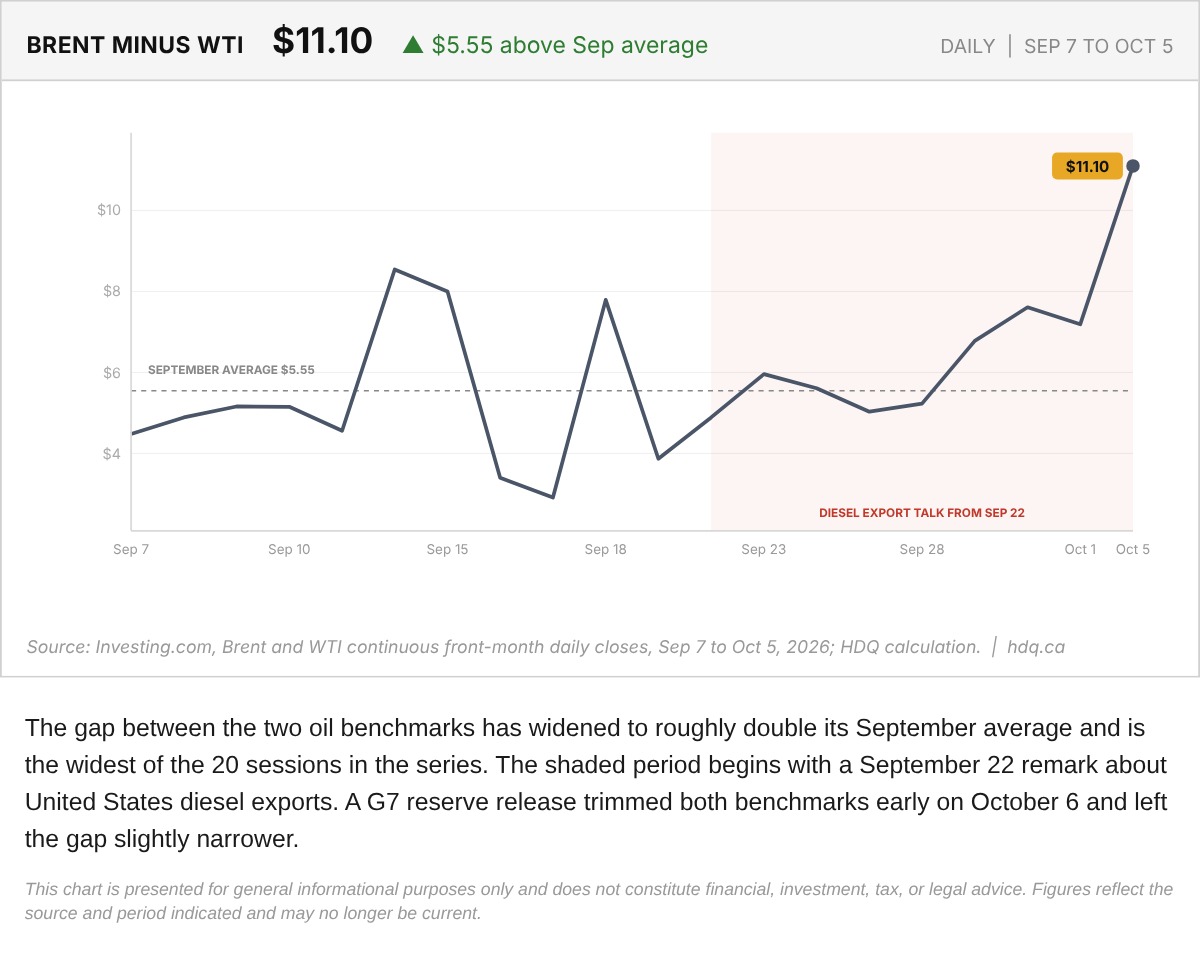
The gap between the two oil benchmarks has widened to roughly double its September average and is the widest of the 20 sessions in the series.
Brent-WTI Price Gap Against Its September Average
October 6, 2026
View chart & download