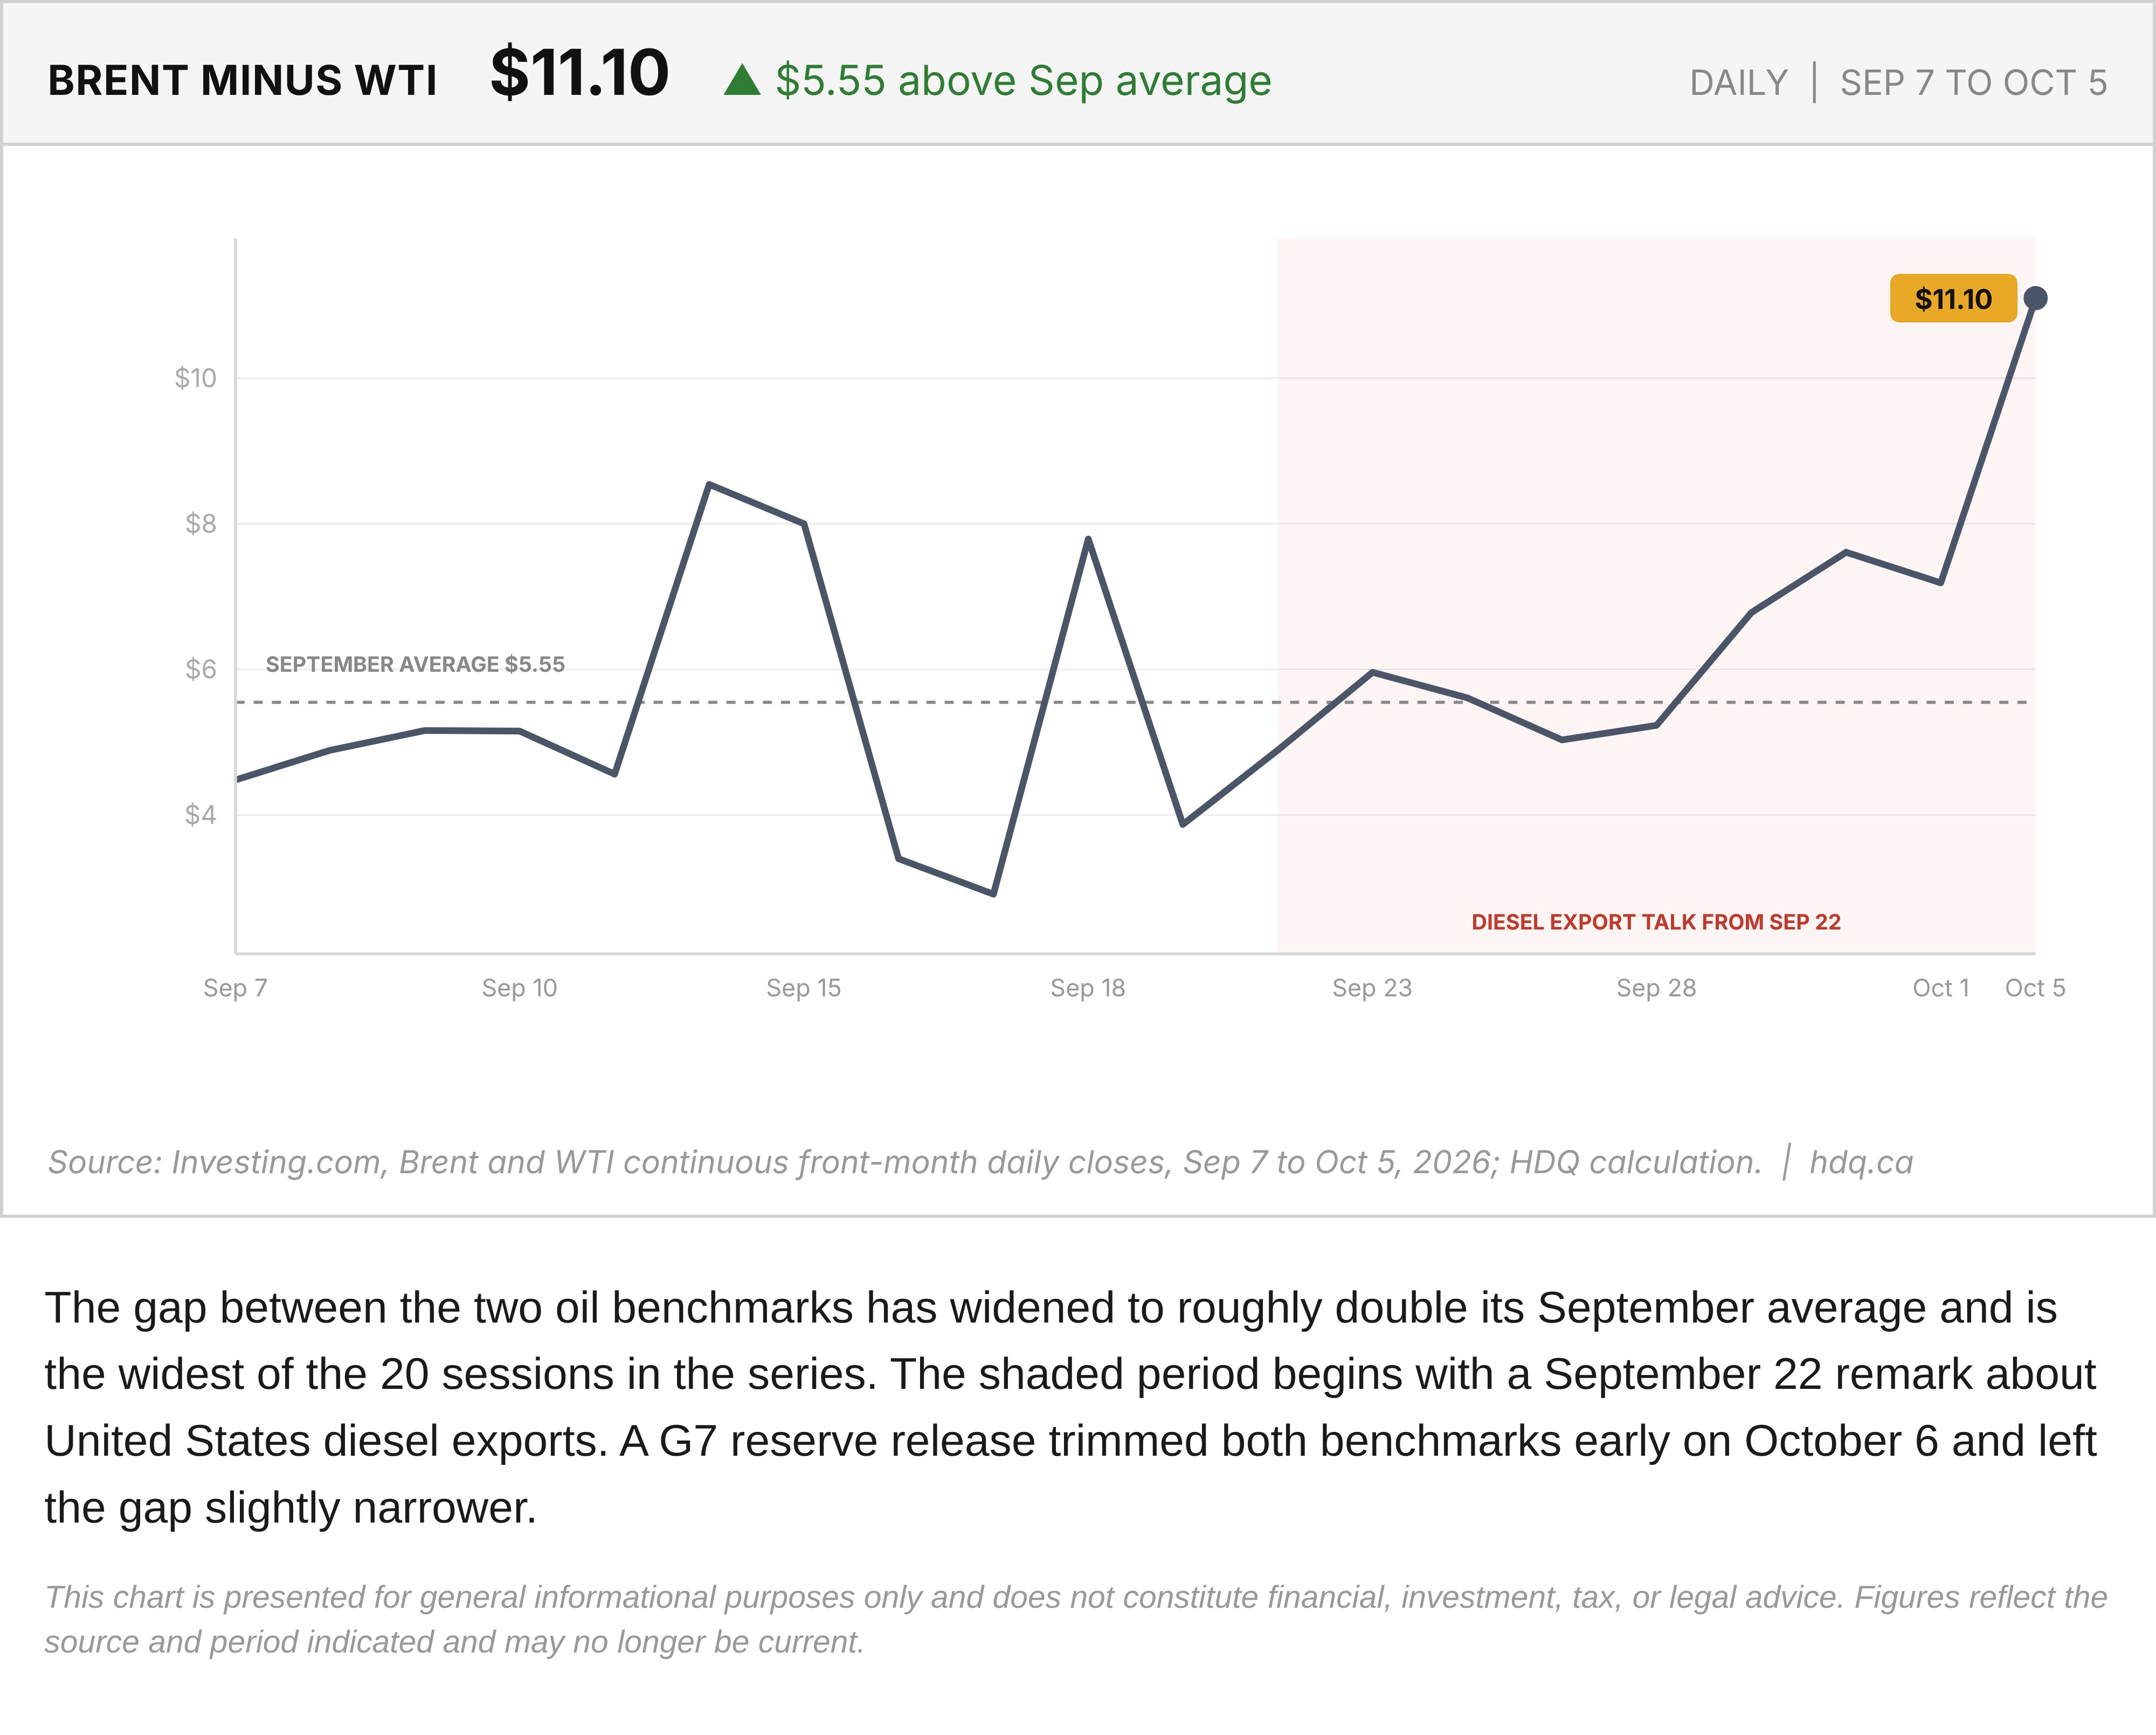
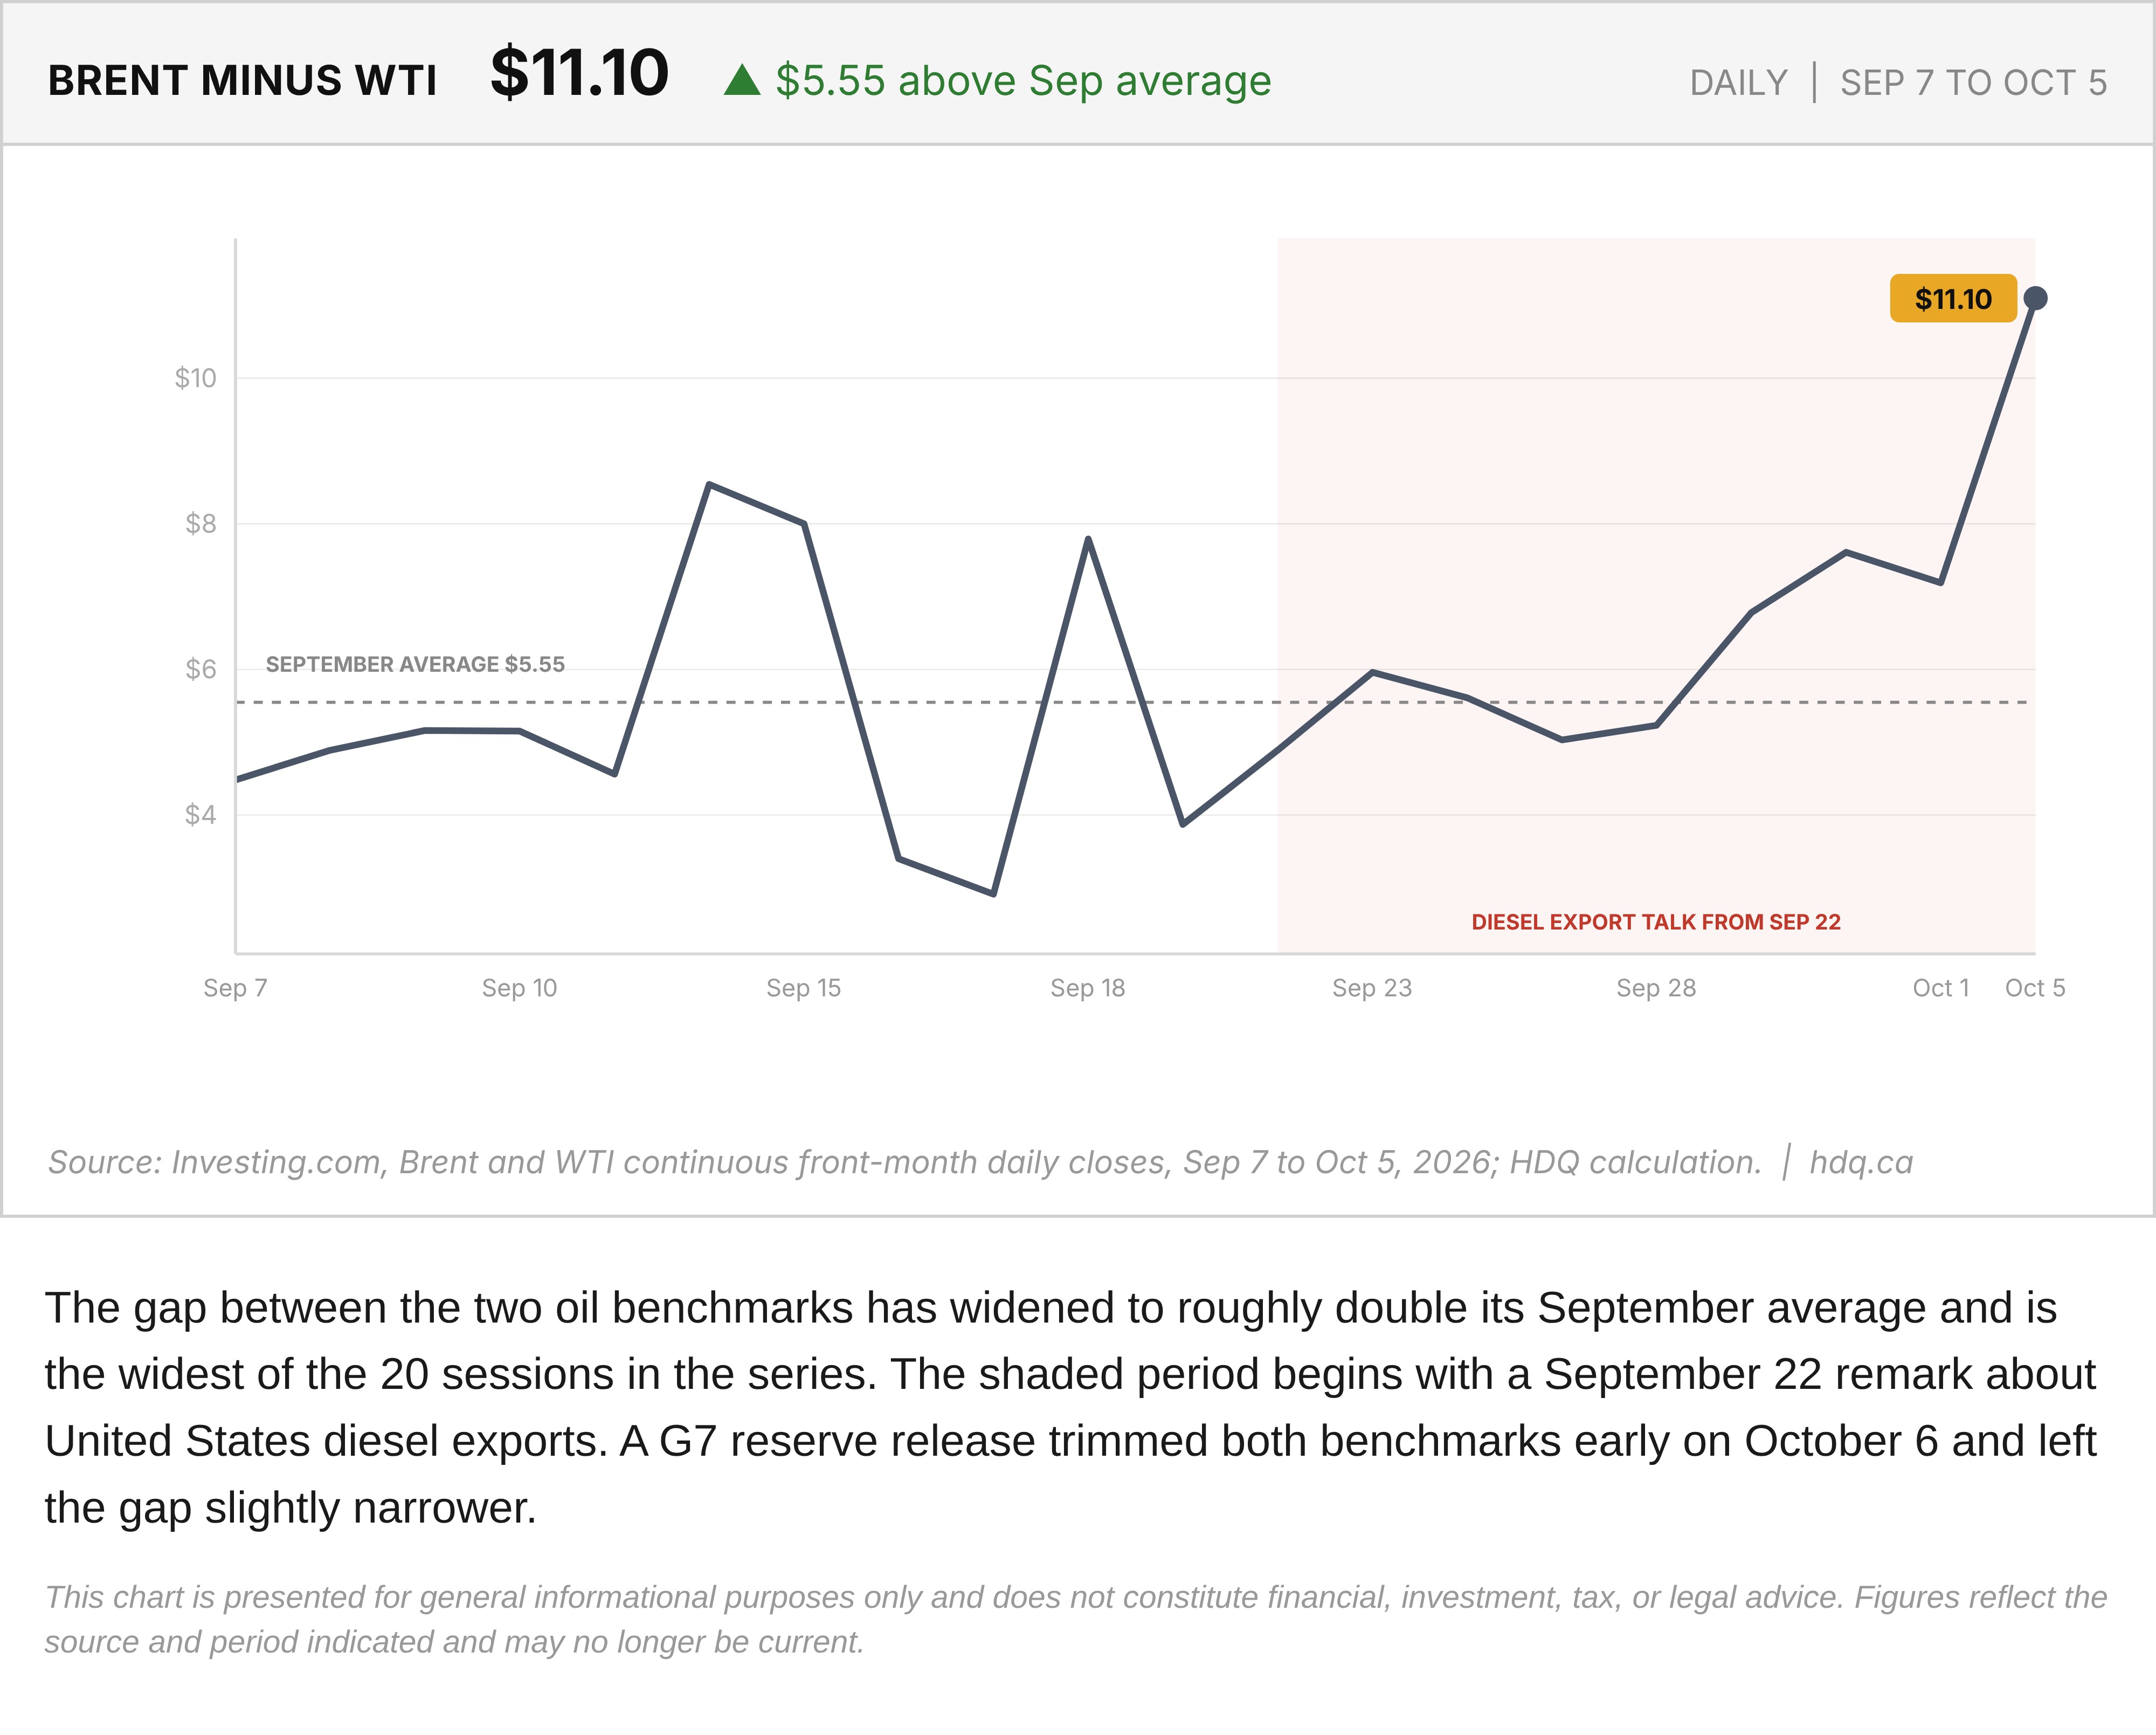
The gap between the two oil benchmarks has widened to roughly double its September average and is the widest of the 20 sessions in the series. The shaded period begins with a September 22 remark about United States diesel exports. A G7 reserve release trimmed both benchmarks early on October 6 and left the gap slightly narrower.
This chart is presented for general informational purposes only and does not constitute financial, investment, tax, or legal advice. Figures reflect the source and period indicated and may no longer be current.
Related charts
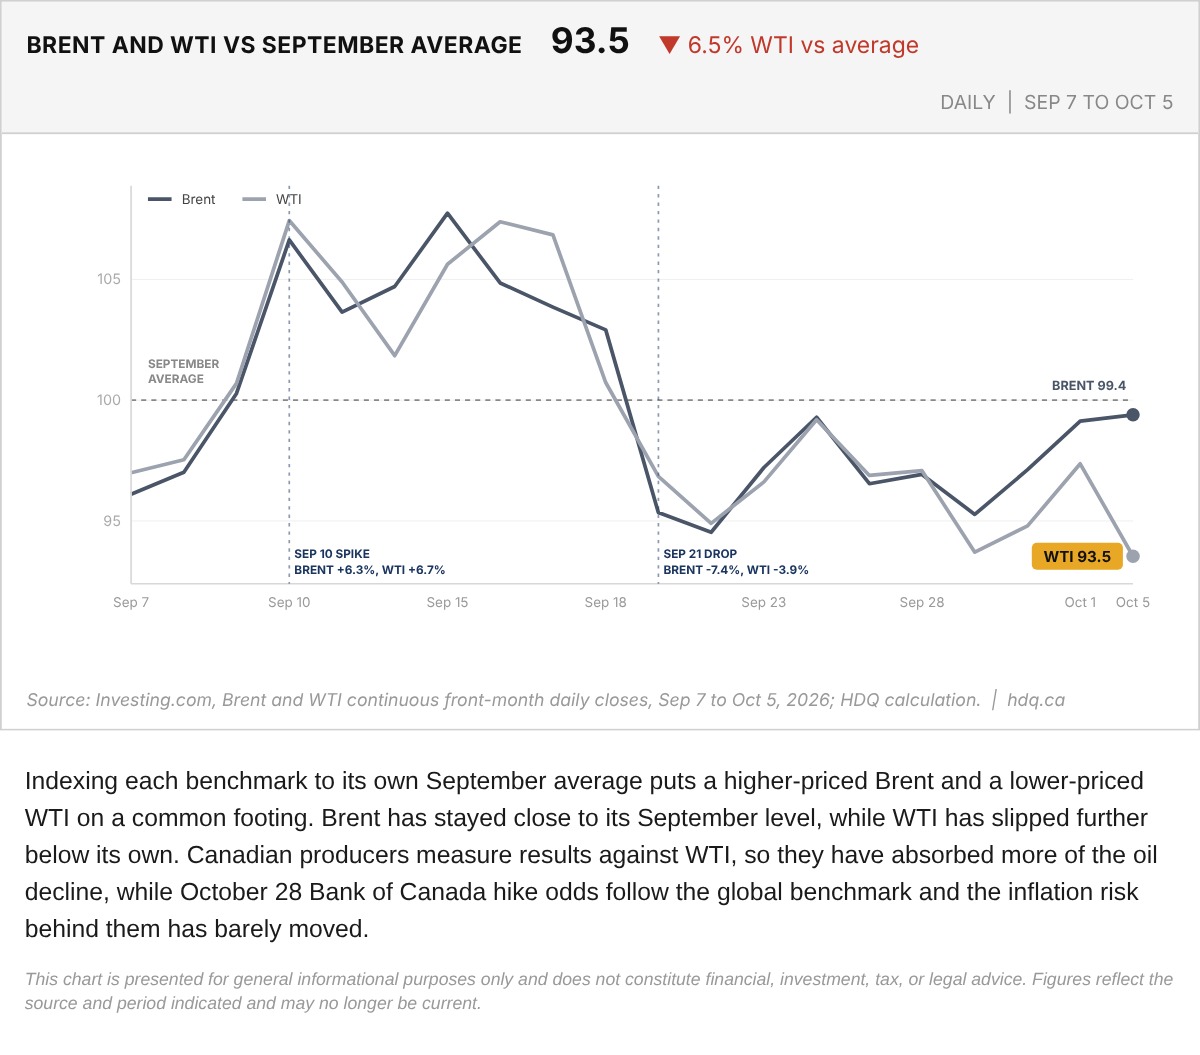
Indexing each benchmark to its own September average puts a higher-priced Brent and a lower-priced WTI on a common footing.
Brent and WTI Against Their September Averages
October 6, 2026
View chart & download
The S&P/TSX Composite closed July at 35,226, up 1.06% for the month, a modest headline figure that conceals sharp intra-month swings.
S&P/TSX Composite closes July up 1.06% after a volatile month
July 31, 2026
View chart & download
Brent and WTI crude both surged in July, with WTI ending the month at $85.47, up 23.0%, after round-tripping from a five-month low near $68.74.
WTI and Brent crude surge in July as the Iran ceasefire collapses
July 31, 2026
View chart & download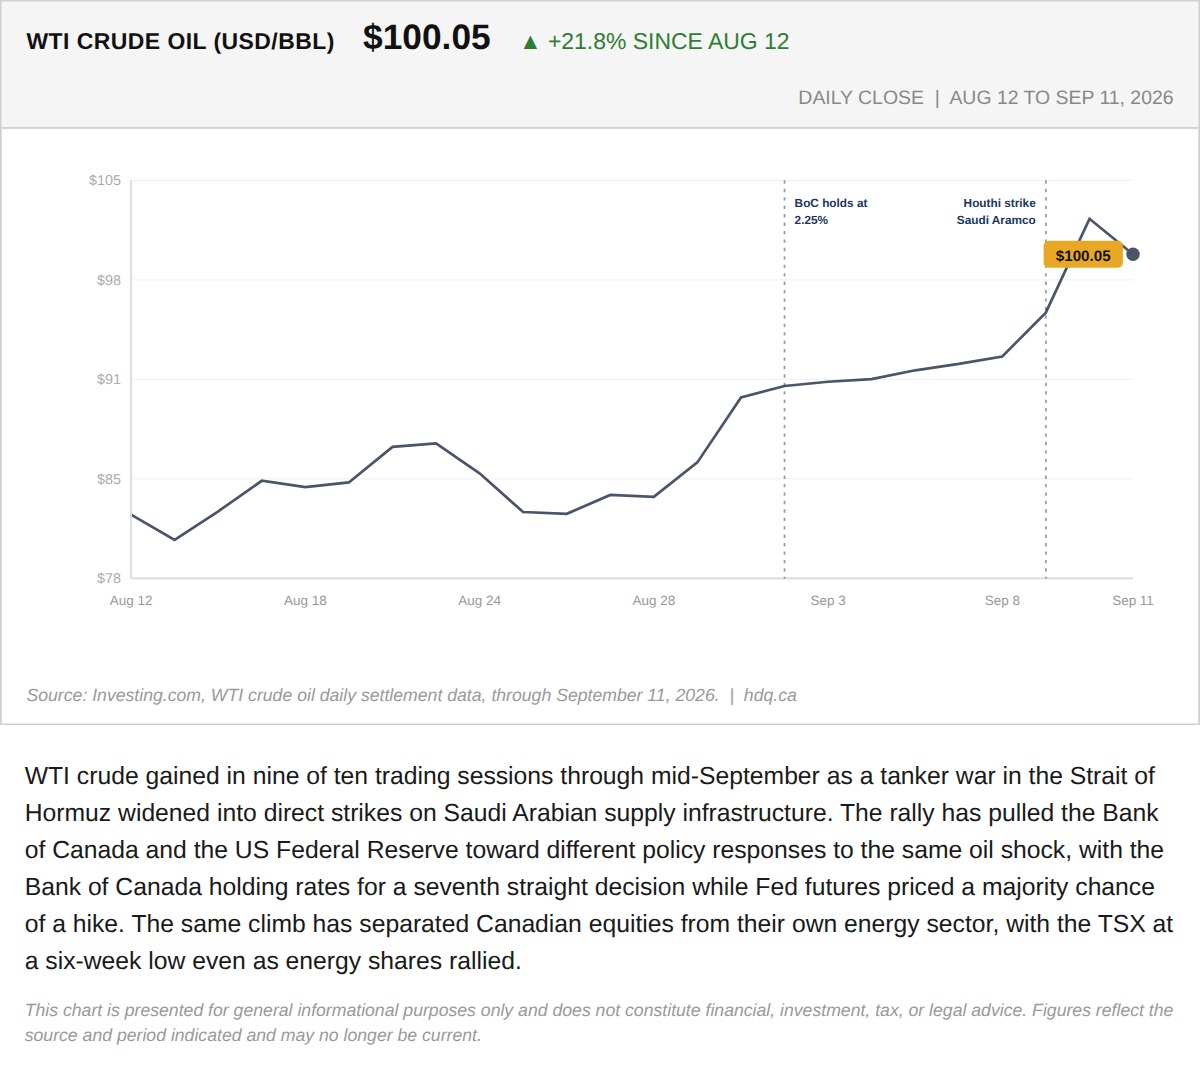
WTI crude gained in nine of ten trading sessions through mid-September as a tanker war in the Strait of Hormuz widened into direct strikes on Saudi Arabian supply infrastructure.
The Week the Same Barrel of Oil Split the BoC From the Fed and the TSX From Its Own Energy Sector
September 12, 2026
View chart & download
Brent was the only one of the three to finish above its starting level, while the index and gold both fell.
Brent, TSX and Gold Rebased to the August 31 Close
September 30, 2026
View chart & download
The Bank of Canada held its policy rate at 2.25% for a seventh straight time, yet Canadian yields rose as United States yields surged.
Government of Canada Benchmark Yields, September 2026
September 30, 2026
View chart & download