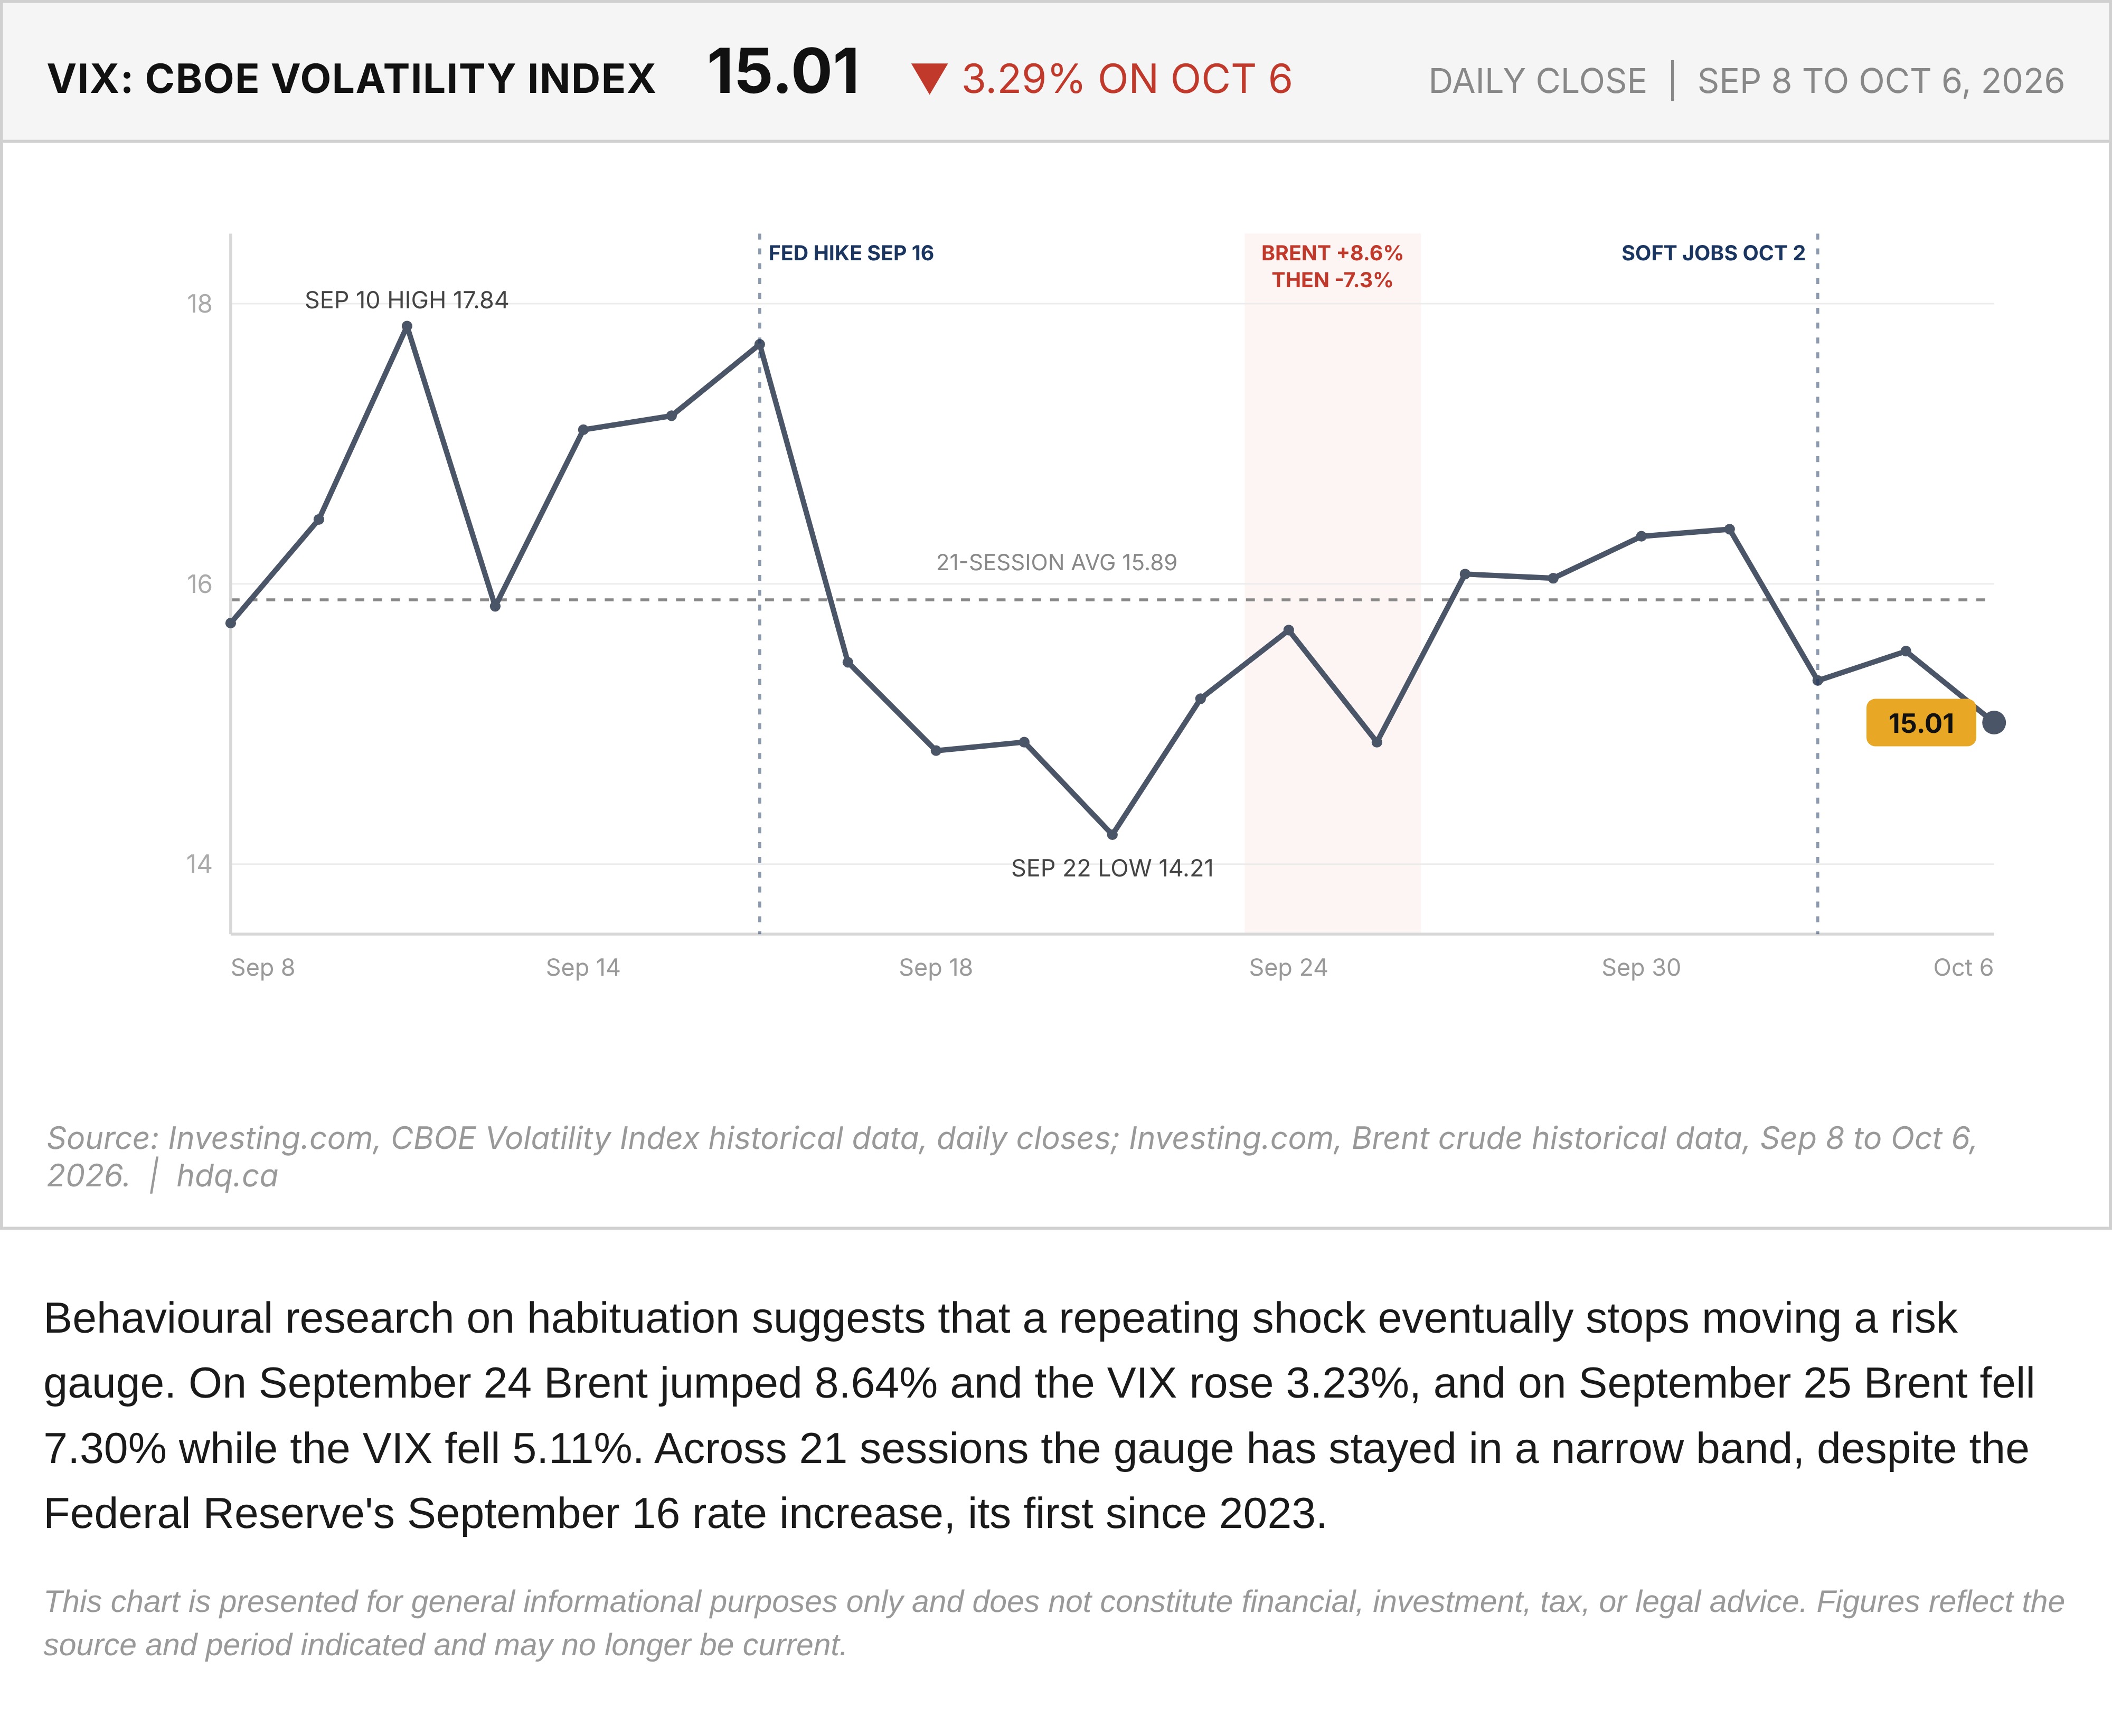
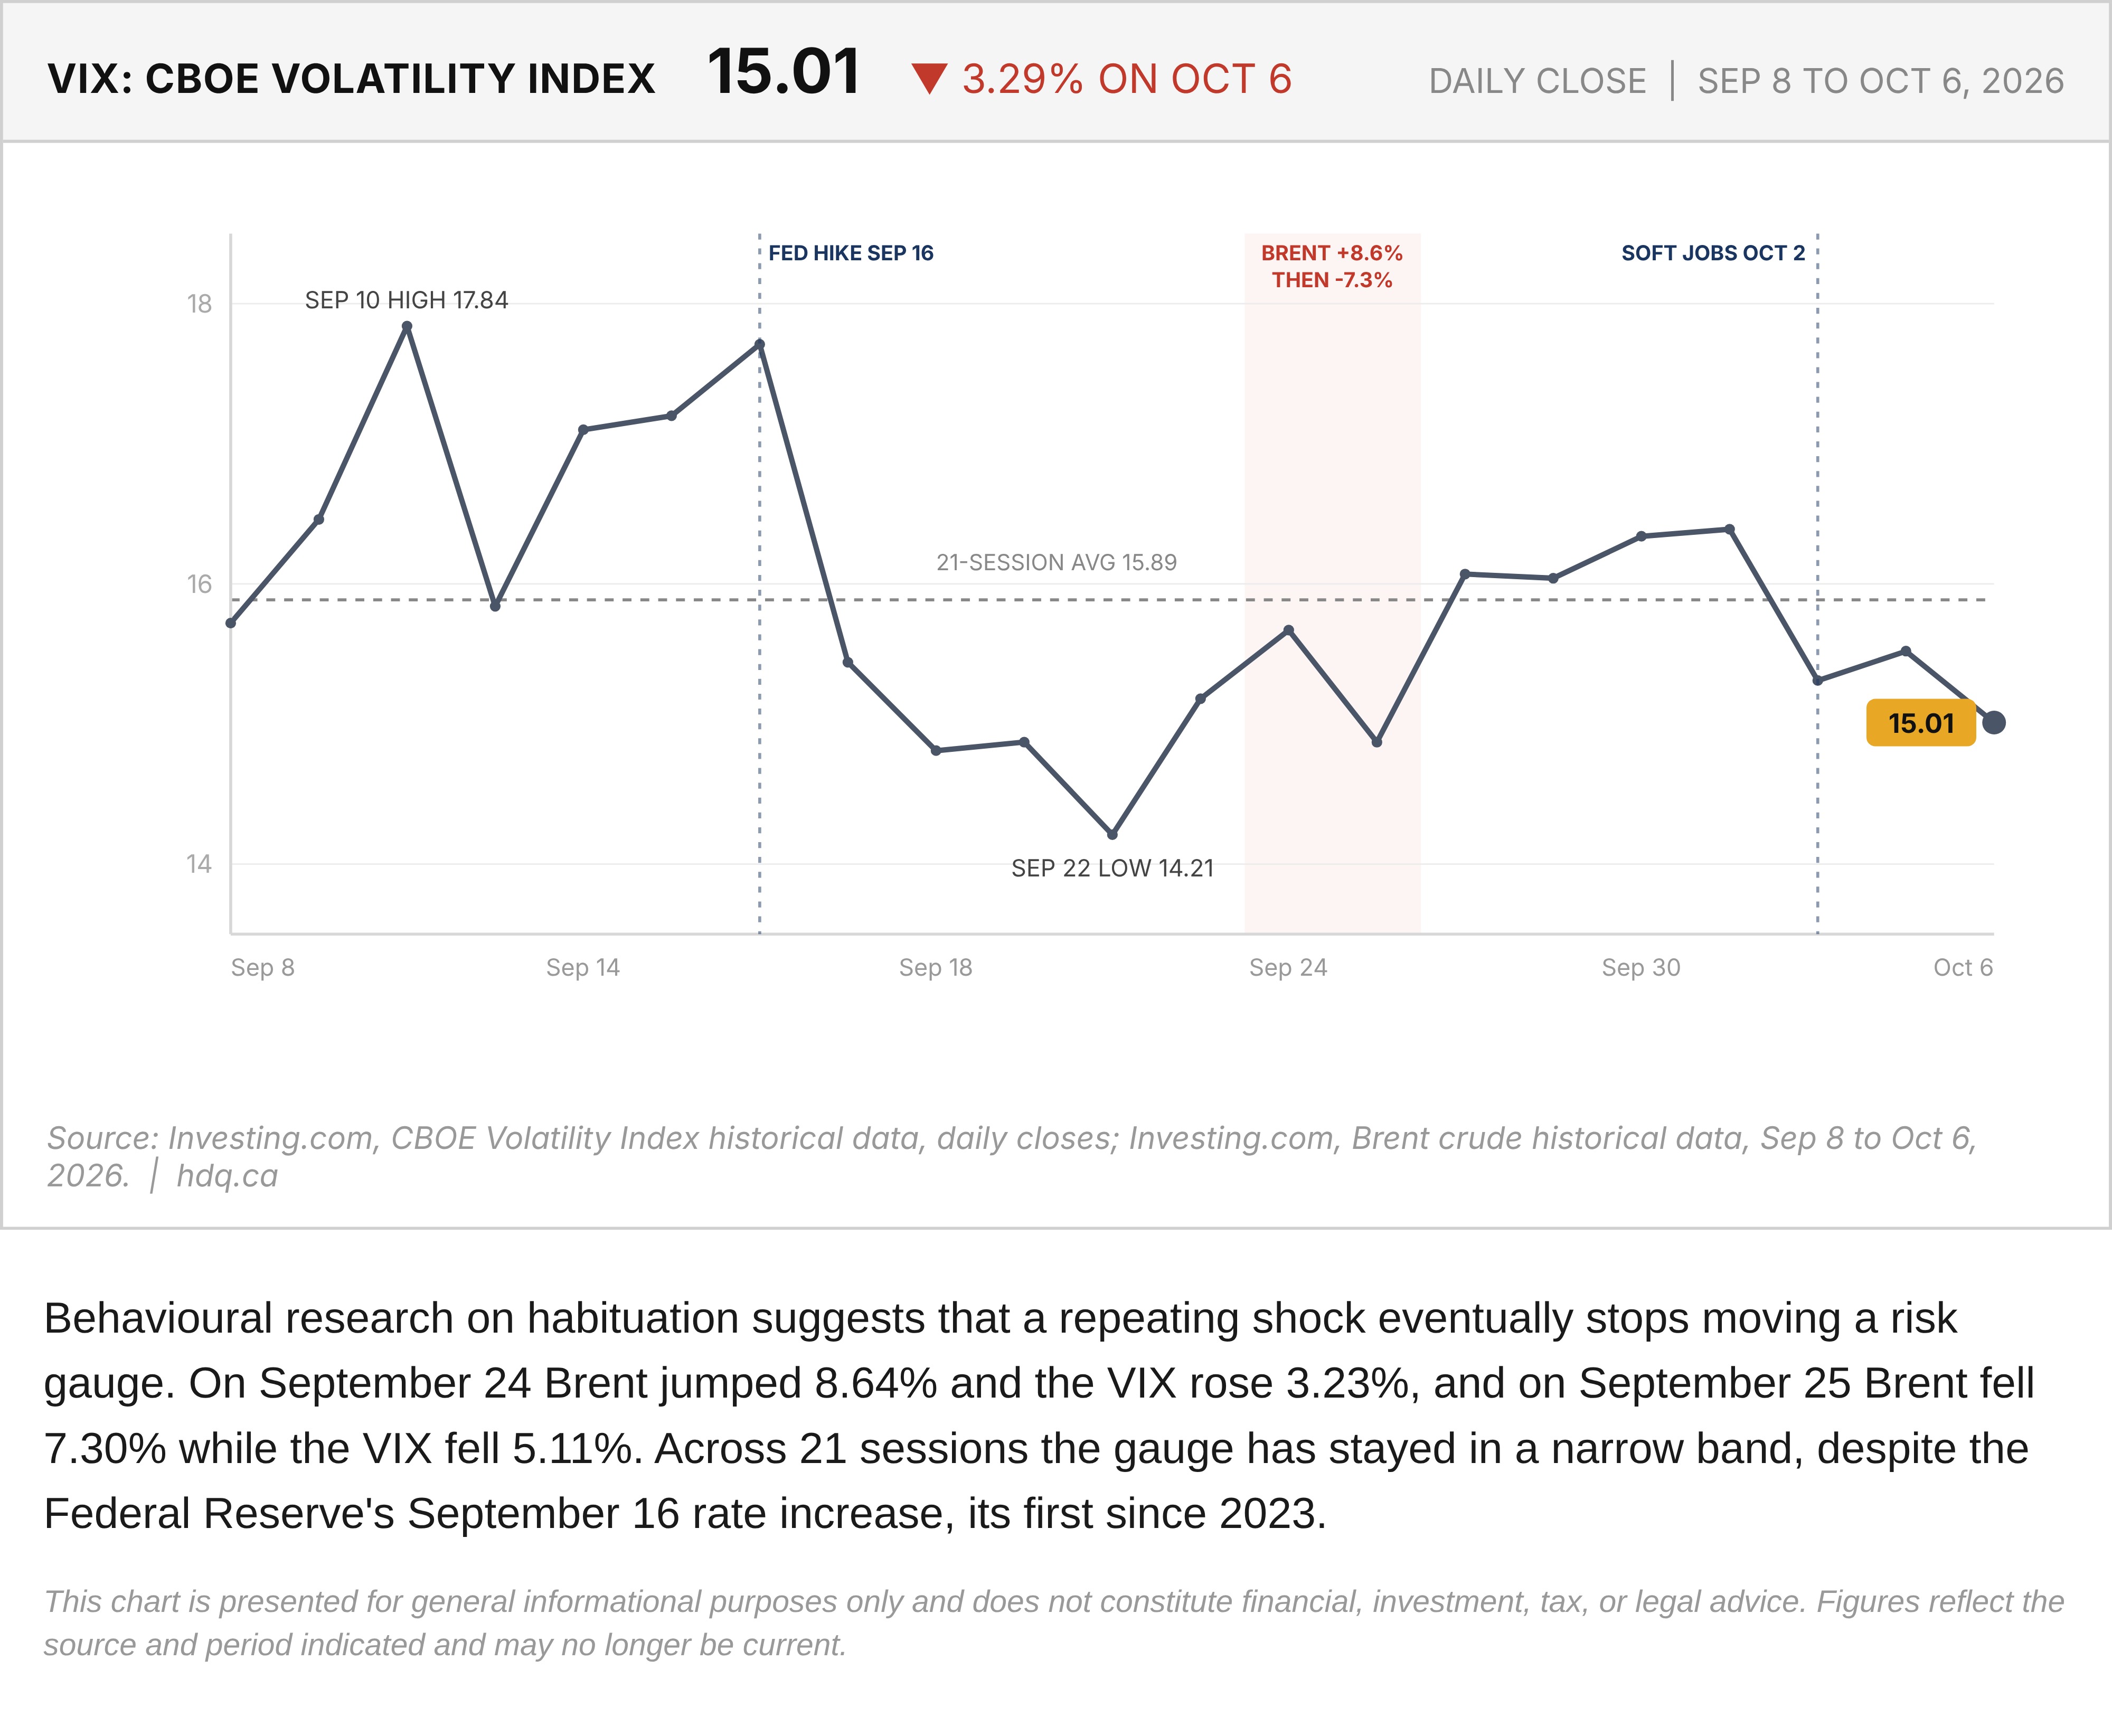
Behavioural research on habituation suggests that a repeating shock eventually stops moving a risk gauge. On September 24 Brent jumped 8.64% and the VIX rose 3.23%, and on September 25 Brent fell 7.30% while the VIX fell 5.11%. Across 21 sessions the gauge has stayed in a narrow band, despite the Federal Reserve's September 16 rate increase, its first since 2023.
This chart is presented for general informational purposes only and does not constitute financial, investment, tax, or legal advice. Figures reflect the source and period indicated and may no longer be current.
Related charts
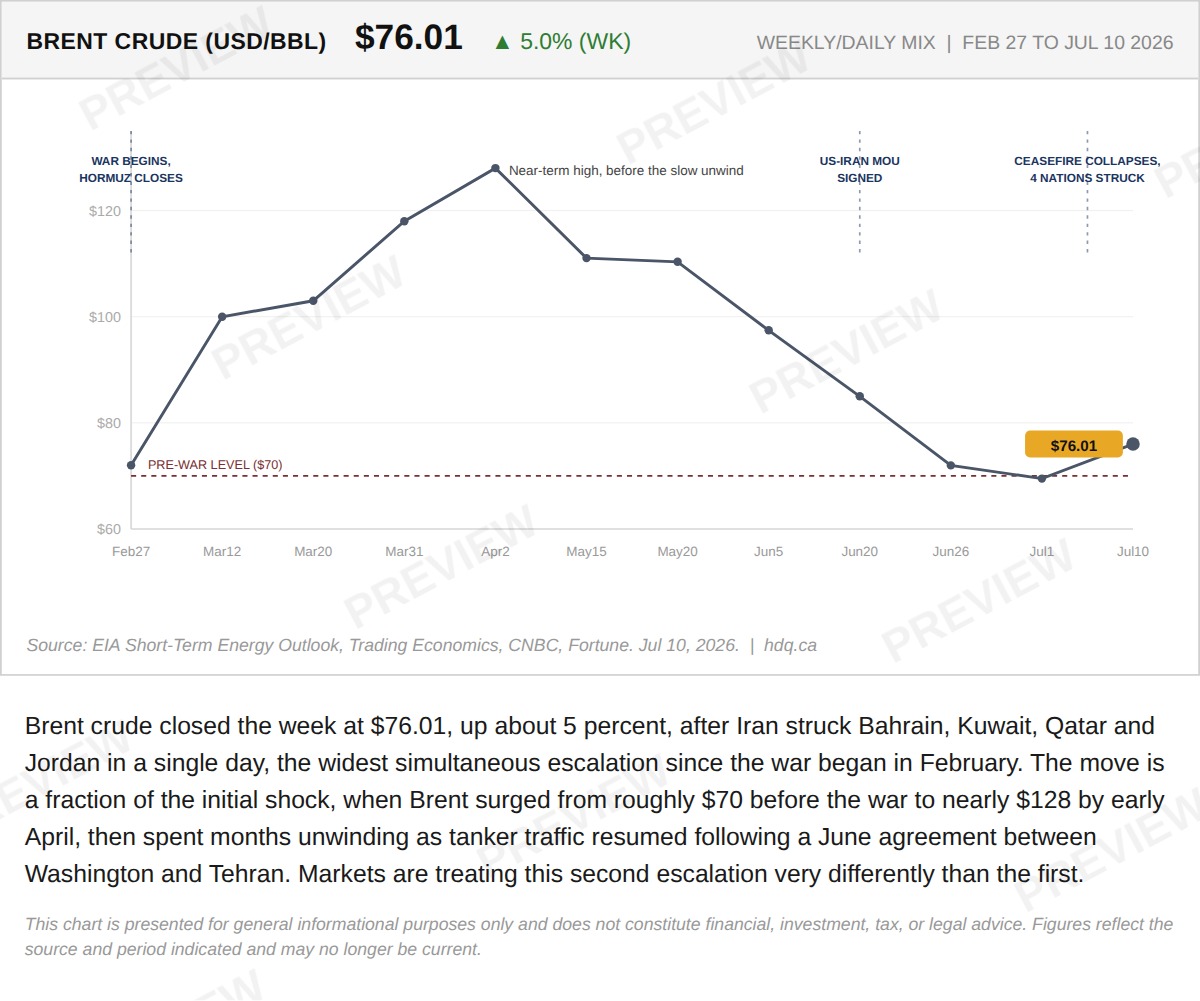
Brent crude closed the week at $76.01, up about 5 percent, after Iran struck Bahrain, Kuwait, Qatar and Jordan in a single day, the widest…
Brent crude gains 5% as Iran strikes widen war to four countries
July 11, 2026
View chart & download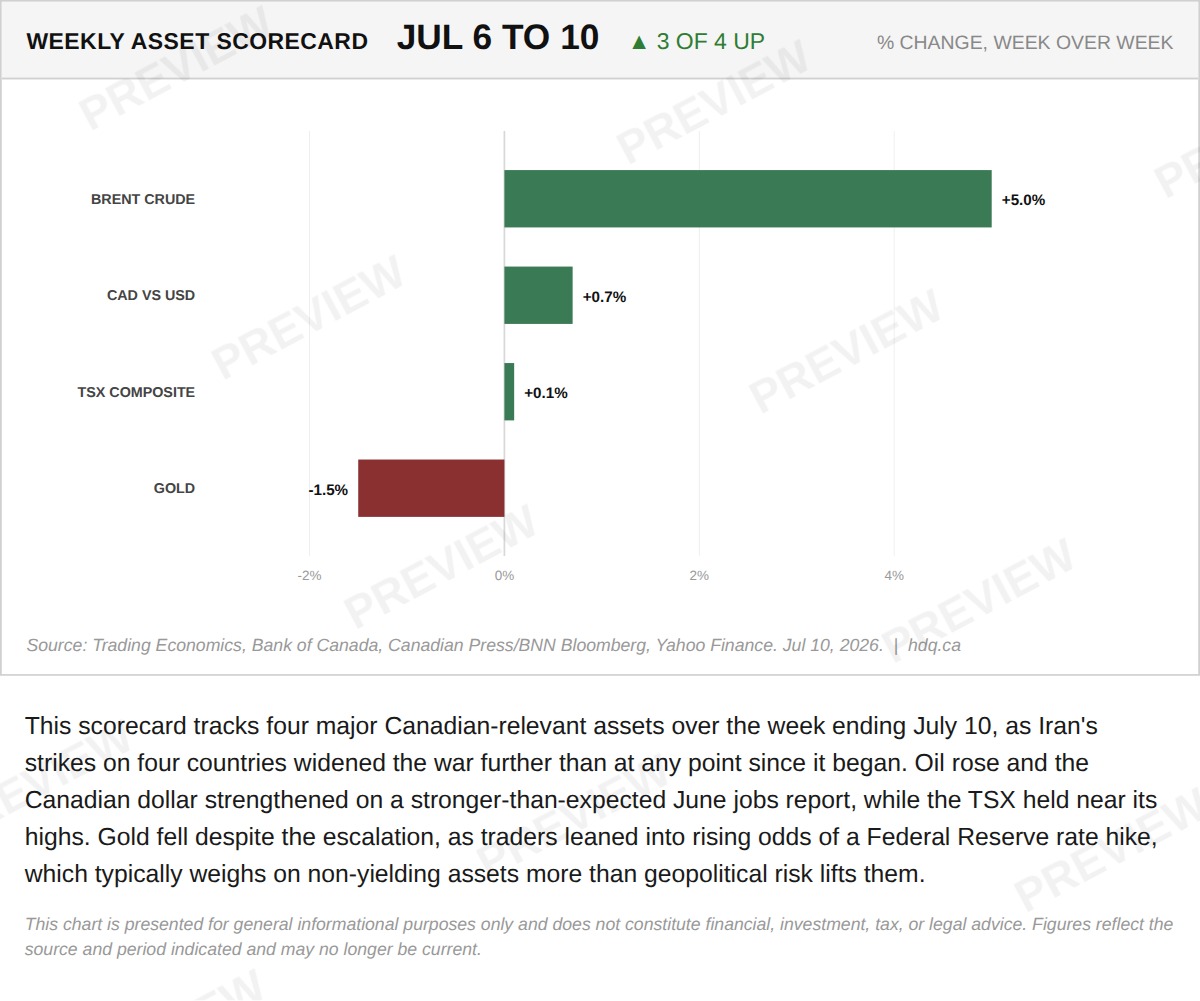
This scorecard tracks four major Canadian-relevant assets over the week ending July 10, as Iran's strikes on four countries widened the war further than at any point since it began.
Weekly scorecard: Brent, CAD and TSX rise as gold falls despite widening war
July 11, 2026
View chart & download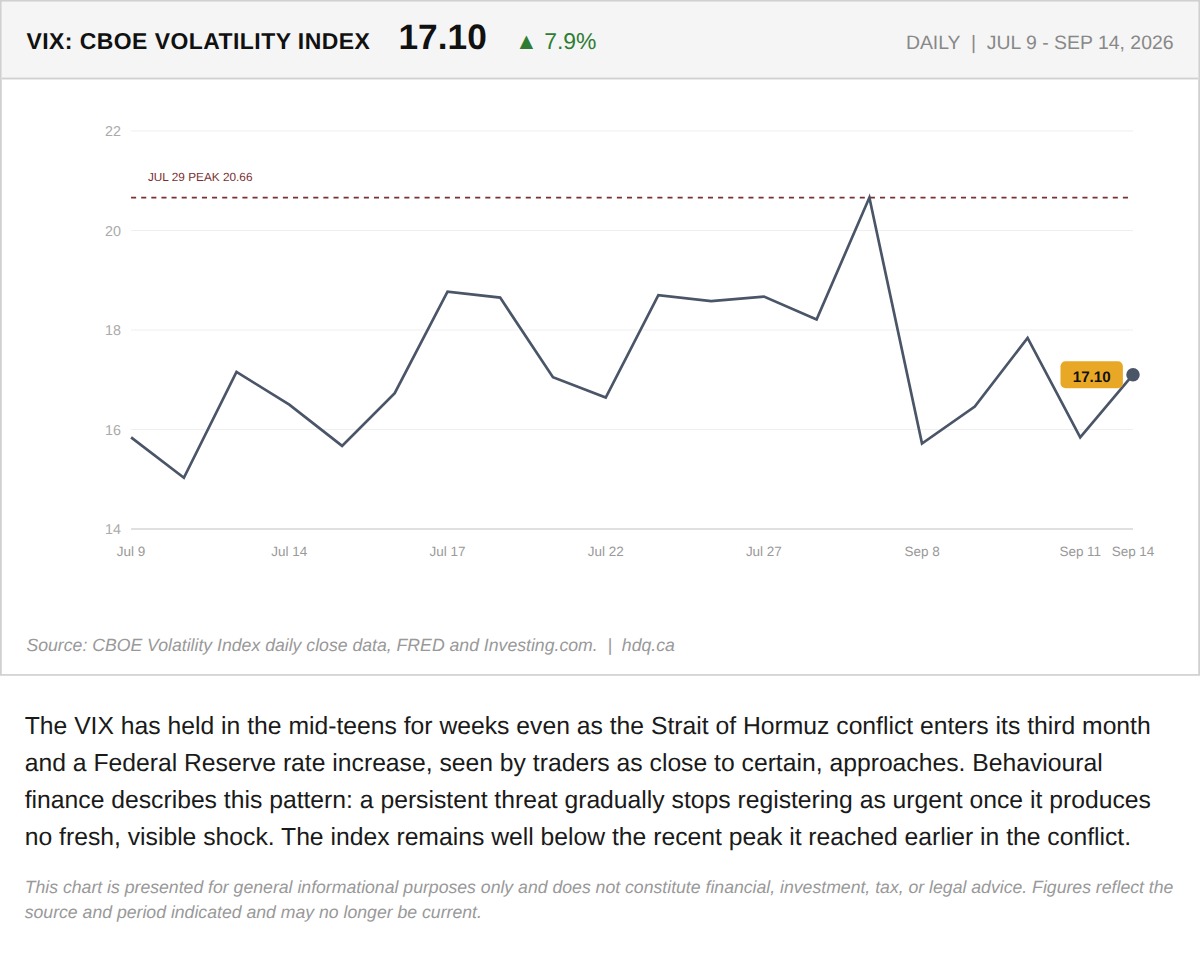
The VIX has held in the mid-teens for weeks even as the Strait of Hormuz conflict enters its third month and a Federal Reserve rate…
Why the Fear Gauge Is Sleeping Through a War and a Rate Hike
September 16, 2026
View chart & download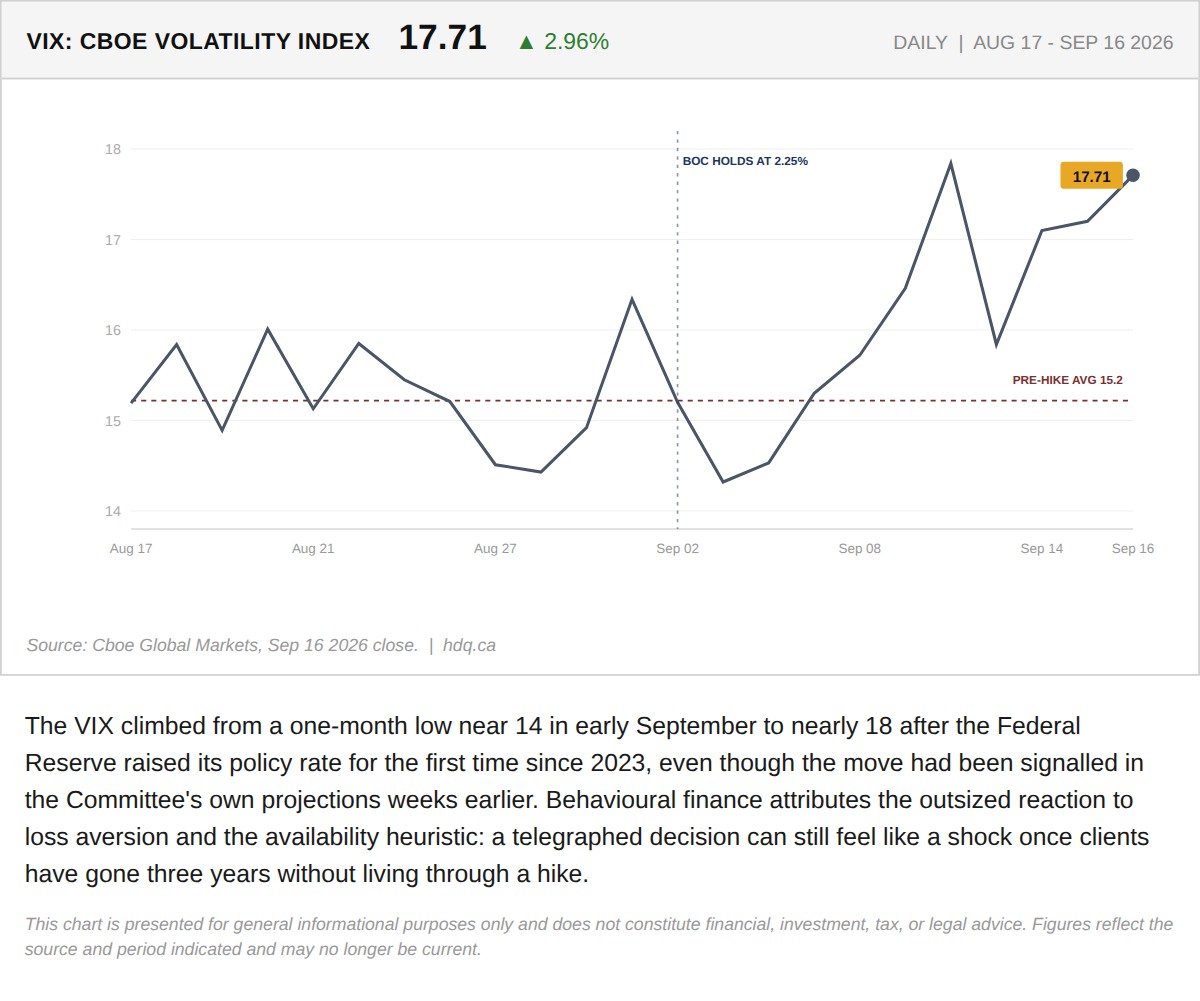
The VIX climbed from a one-month low near 14 in early September to nearly 18 after the Federal Reserve raised its policy rate for the first…
Why an Expected Rate Hike Still Triggered a 631-Point Selloff
September 17, 2026
View chart & download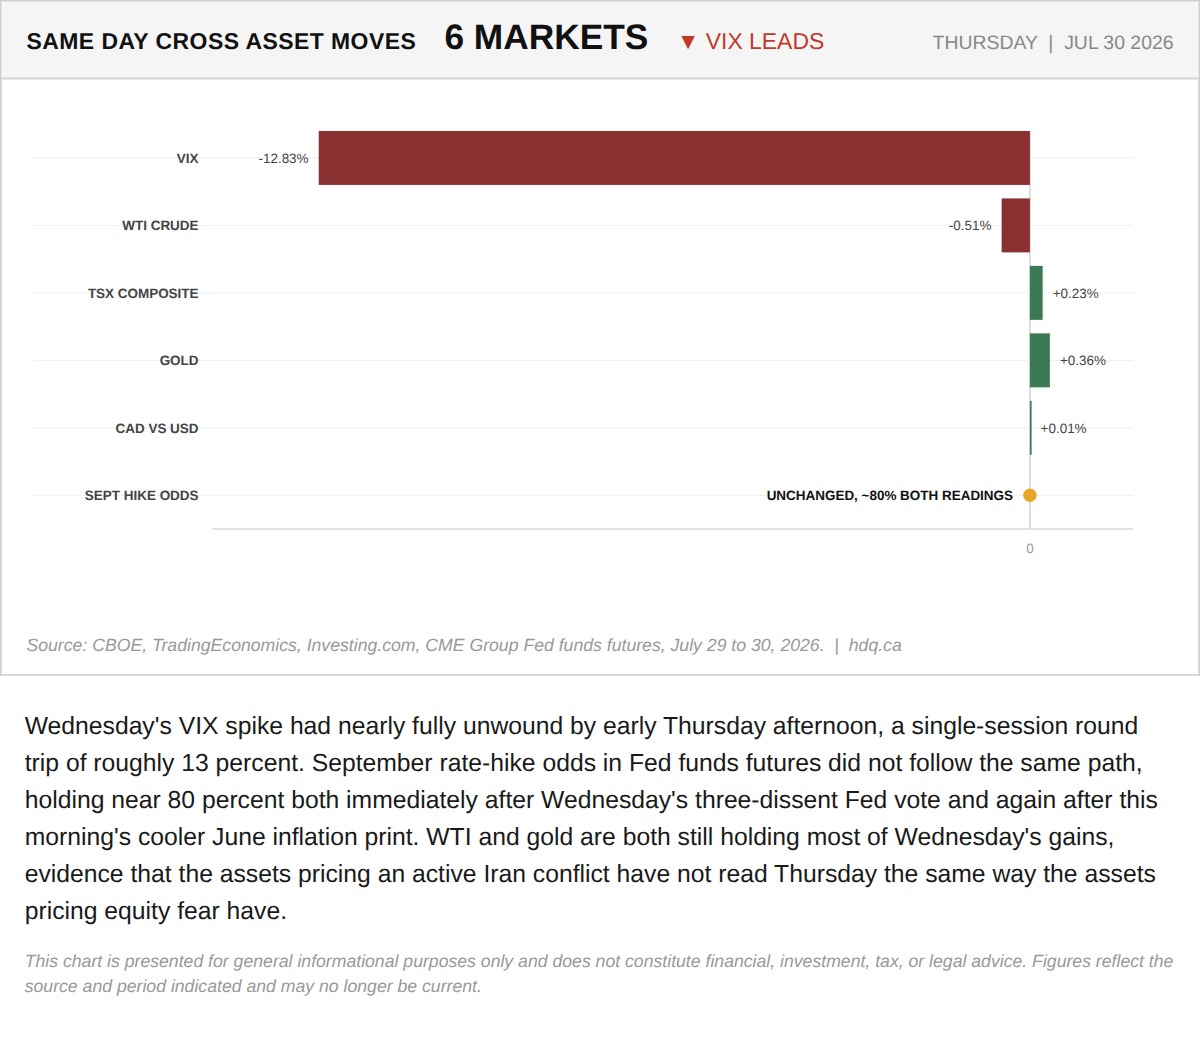
Wednesday's VIX spike had nearly fully unwound by early Thursday afternoon, a single-session round trip of roughly 13 percent.
The VIX Erased Wednesday's Spike. September Rate-Hike Odds Did Not Move With It.
July 30, 2026
View chart & download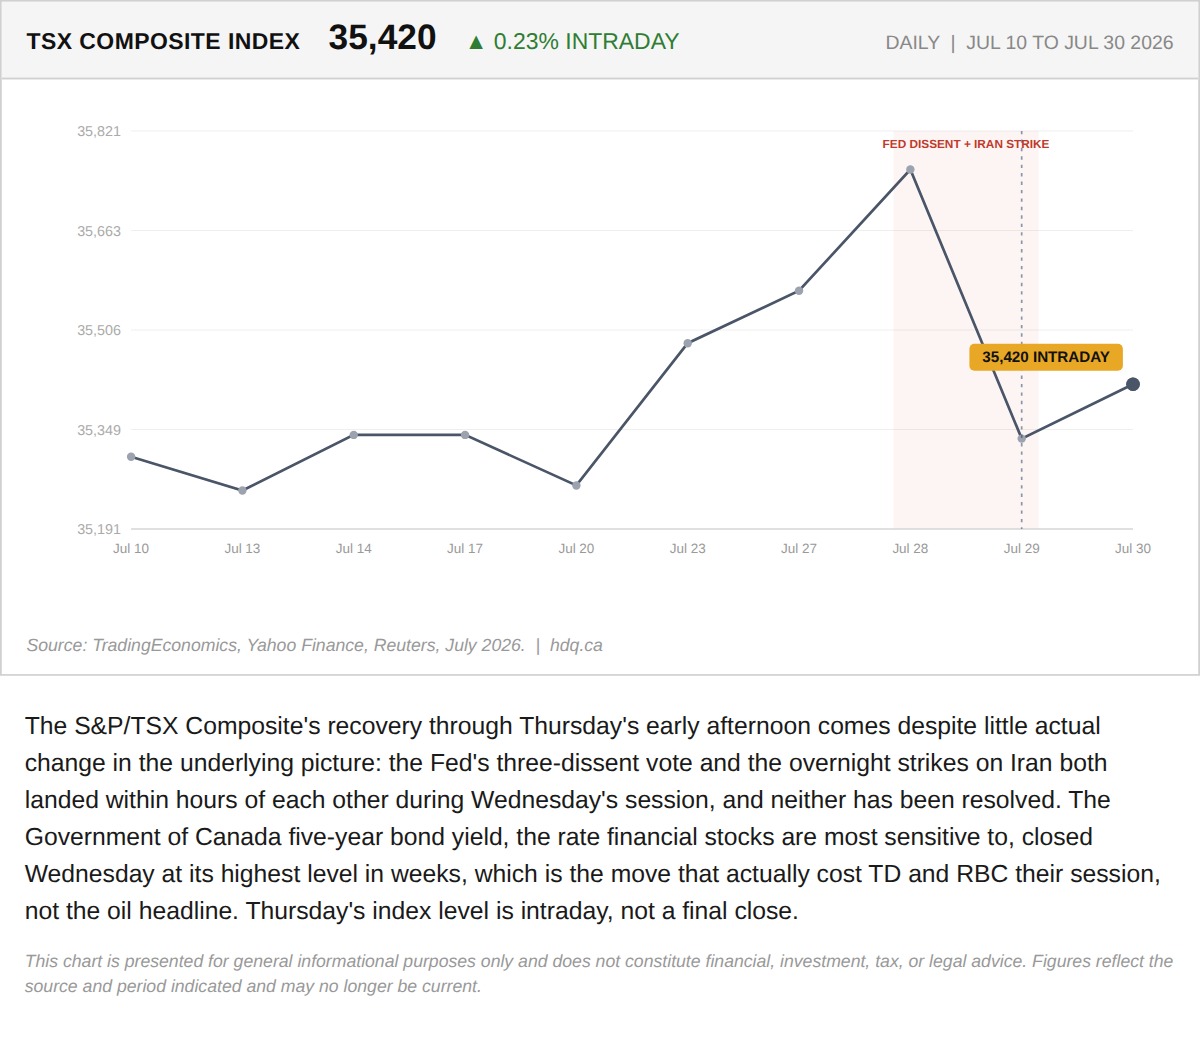
The S&P/TSX Composite's recovery through Thursday's early afternoon comes despite little actual change in the underlying picture: the Fed's…
TSX Composite Claws Back Part of Wednesday's Selloff Through Thursday Afternoon
July 30, 2026
View chart & download