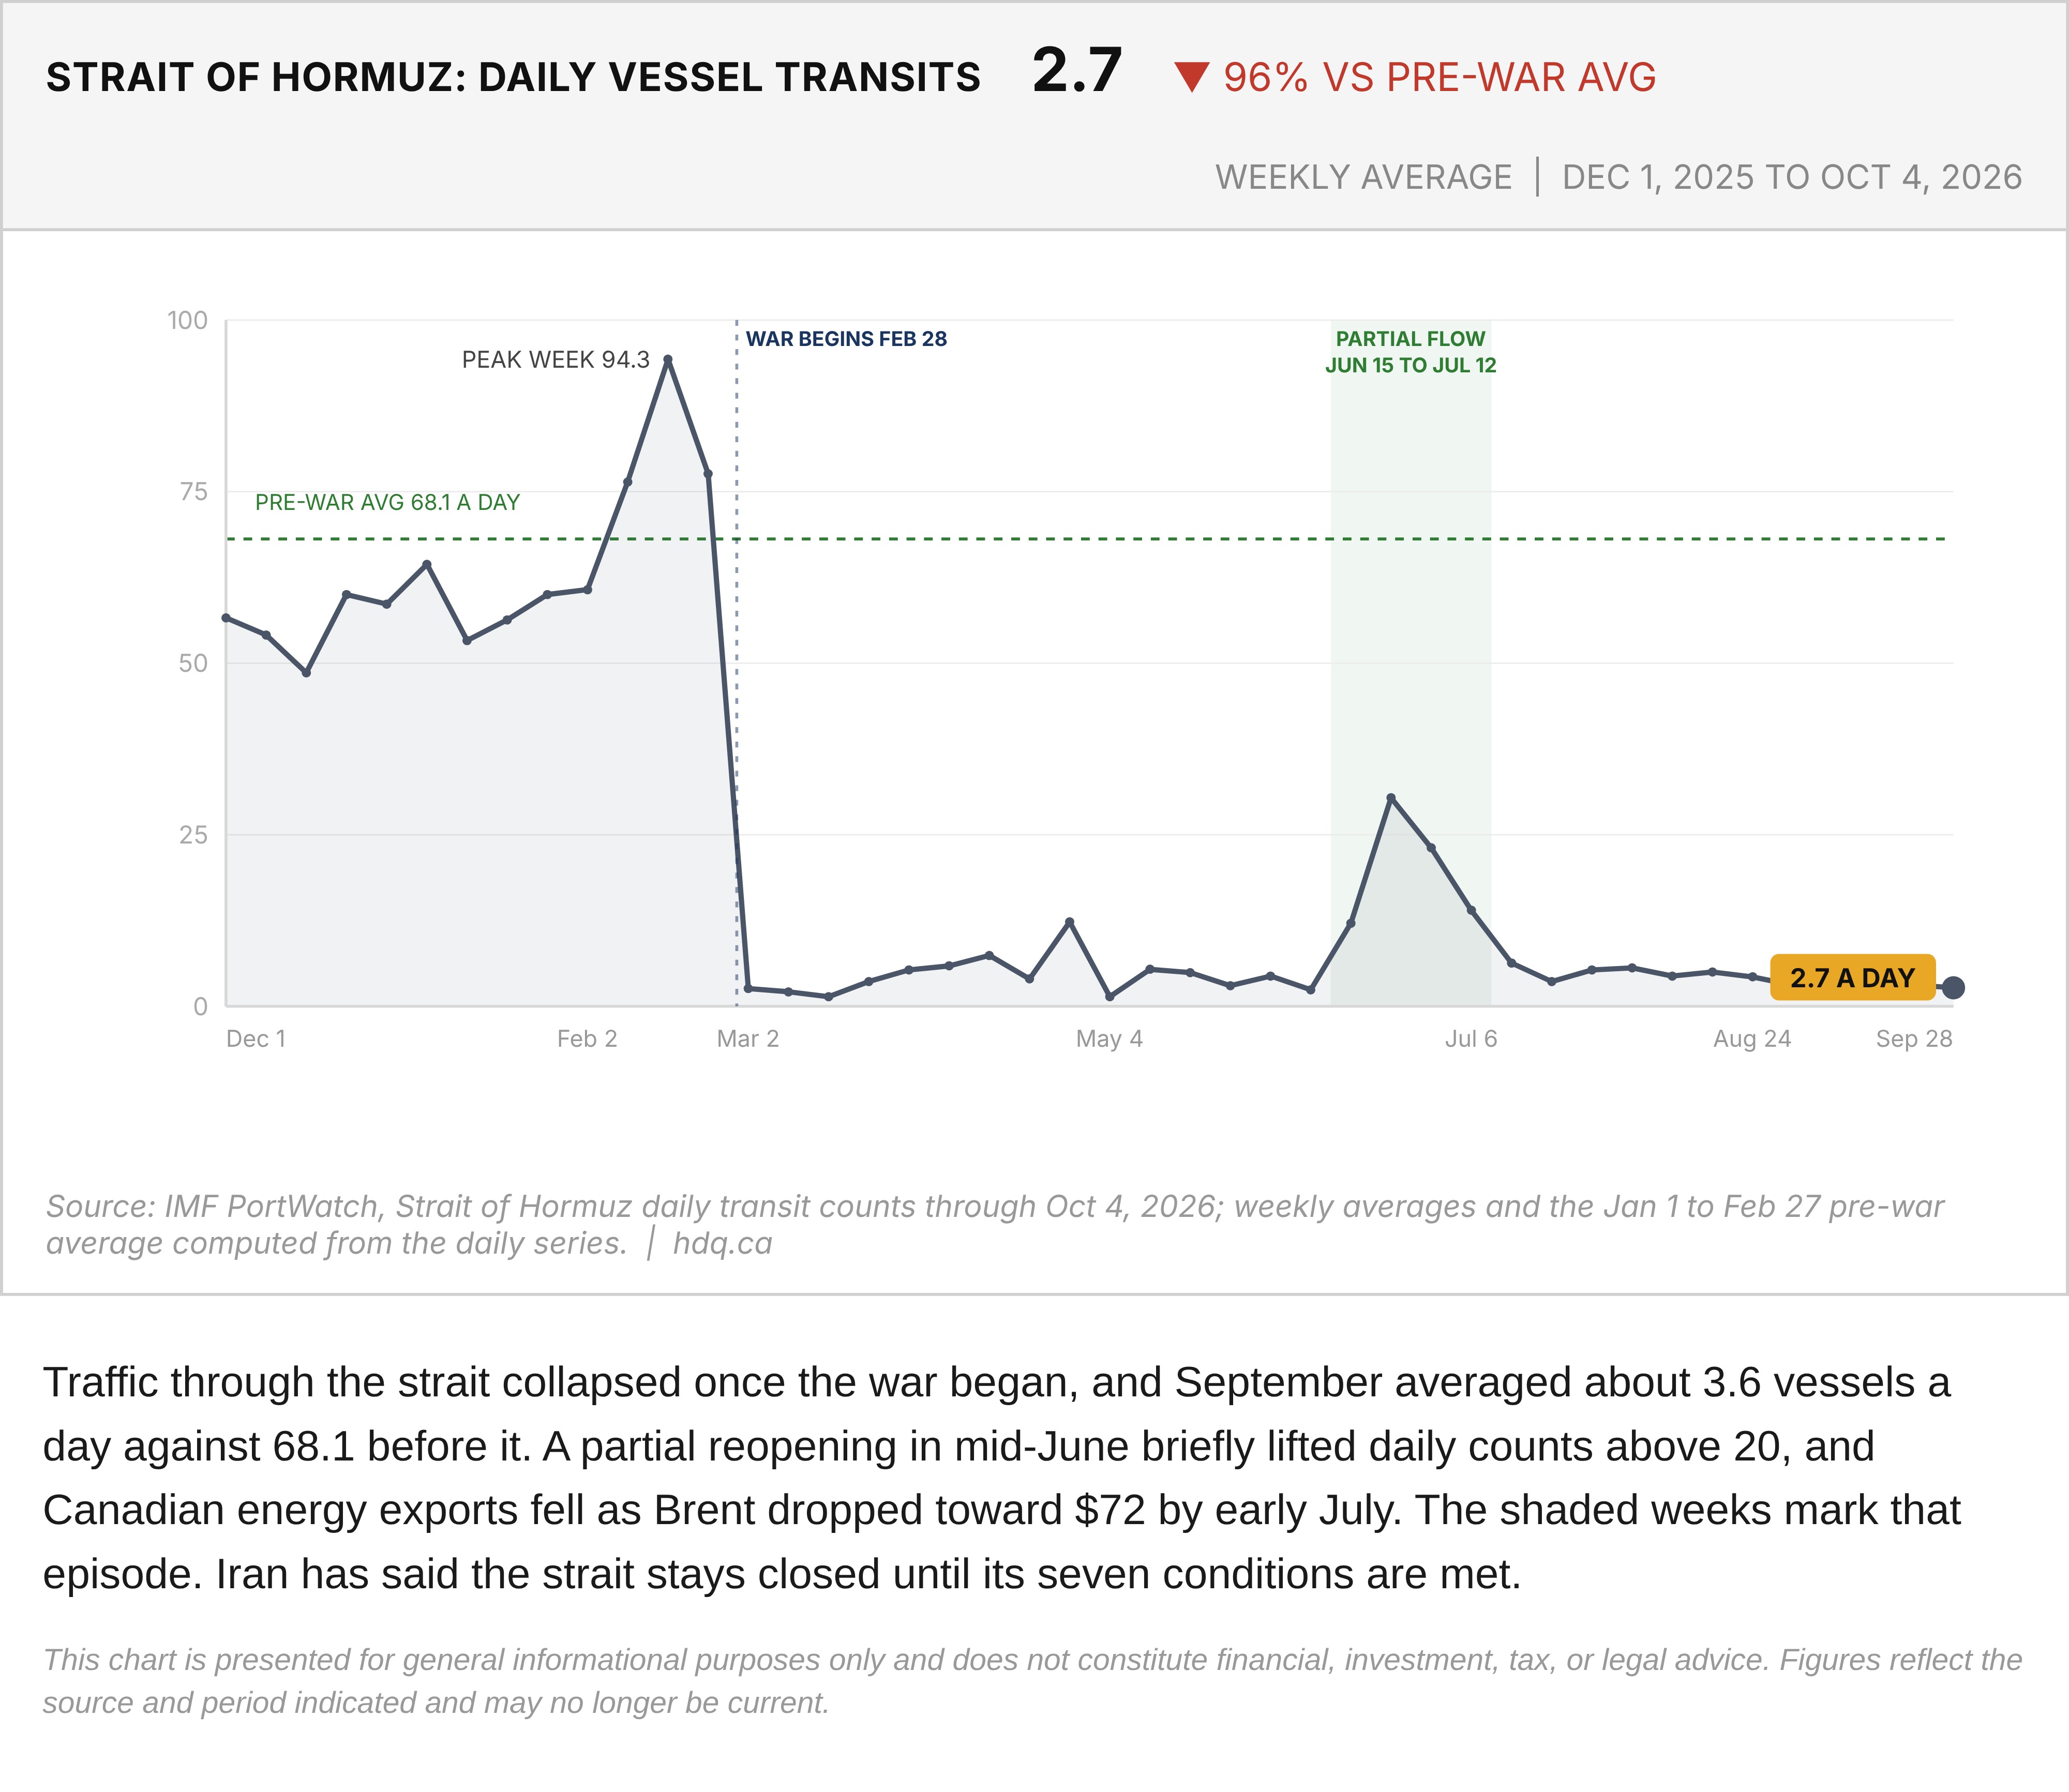
Traffic through the strait collapsed once the war began, and September averaged about 3.6 vessels a day against 68.1 before it. A partial reopening in mid-June briefly lifted daily counts above 20, and Canadian energy exports fell as Brent dropped toward $72 by early July. The shaded weeks mark that episode. Iran has said the strait stays closed until its seven conditions are met.
This chart is presented for general informational purposes only and does not constitute financial, investment, tax, or legal advice. Figures reflect the source and period indicated and may no longer be current.
Related charts
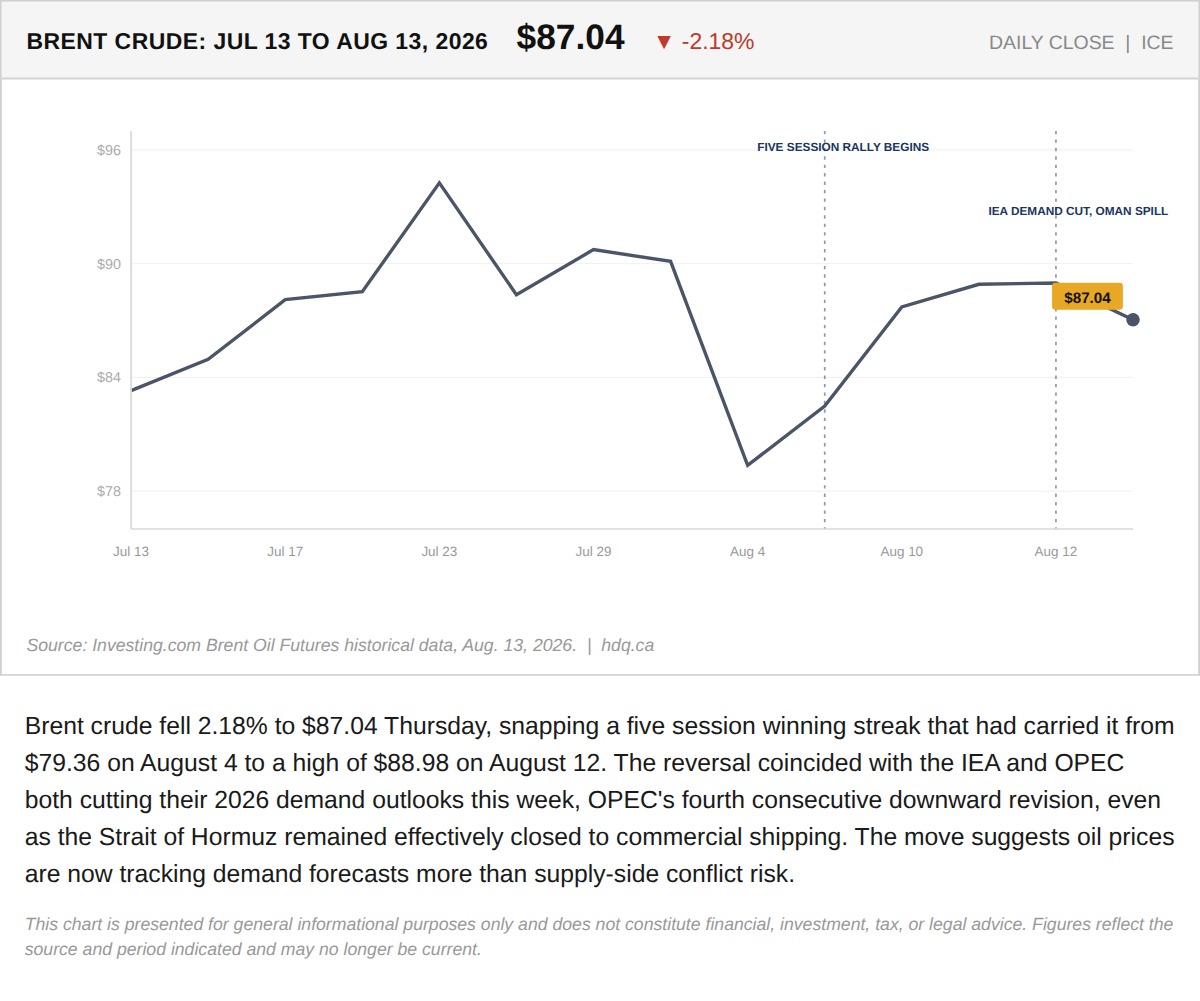
Brent crude fell 2.18% to $87.04 Thursday, snapping a five session winning streak that had carried it from $79.36 on August 4 to a high of $88.98 on August 12.
Oil Fell This Week. The Hormuz Rhetoric Didn't.
August 14, 2026
View chart & download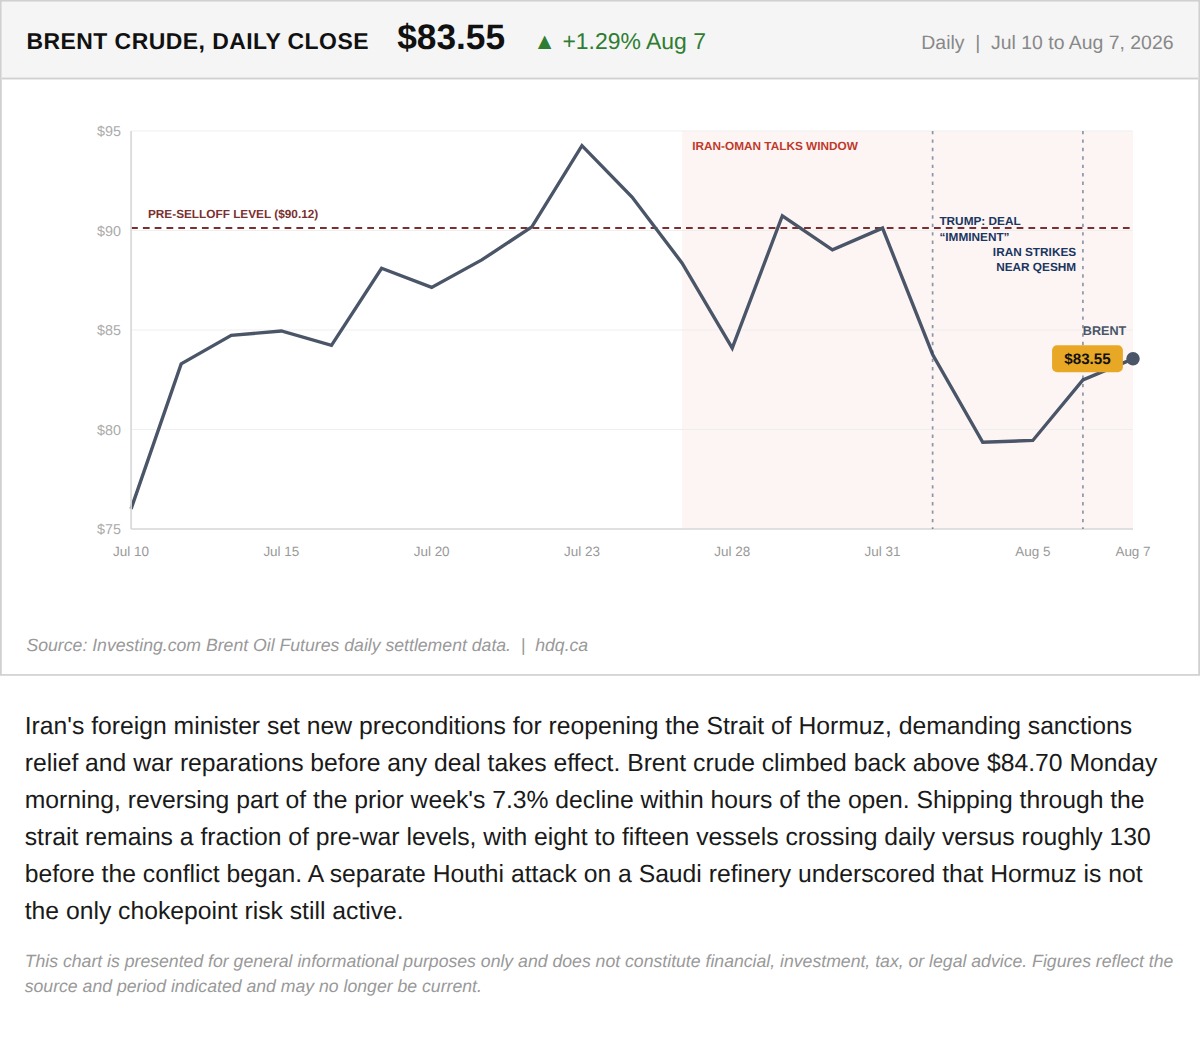
Iran's foreign minister set new preconditions for reopening the Strait of Hormuz, demanding sanctions relief and war reparations before any deal takes effect.
Iran Just Told the Market What the June MOU Actually Requires. The Market Priced Something Else.
August 10, 2026
View chart & download
The S&P/TSX Composite closed July at 35,226, up 1.06% for the month, a modest headline figure that conceals sharp intra-month swings.
S&P/TSX Composite closes July up 1.06% after a volatile month
July 31, 2026
View chart & download
Brent and WTI crude both surged in July, with WTI ending the month at $85.47, up 23.0%, after round-tripping from a five-month low near $68.74.
WTI and Brent crude surge in July as the Iran ceasefire collapses
July 31, 2026
View chart & download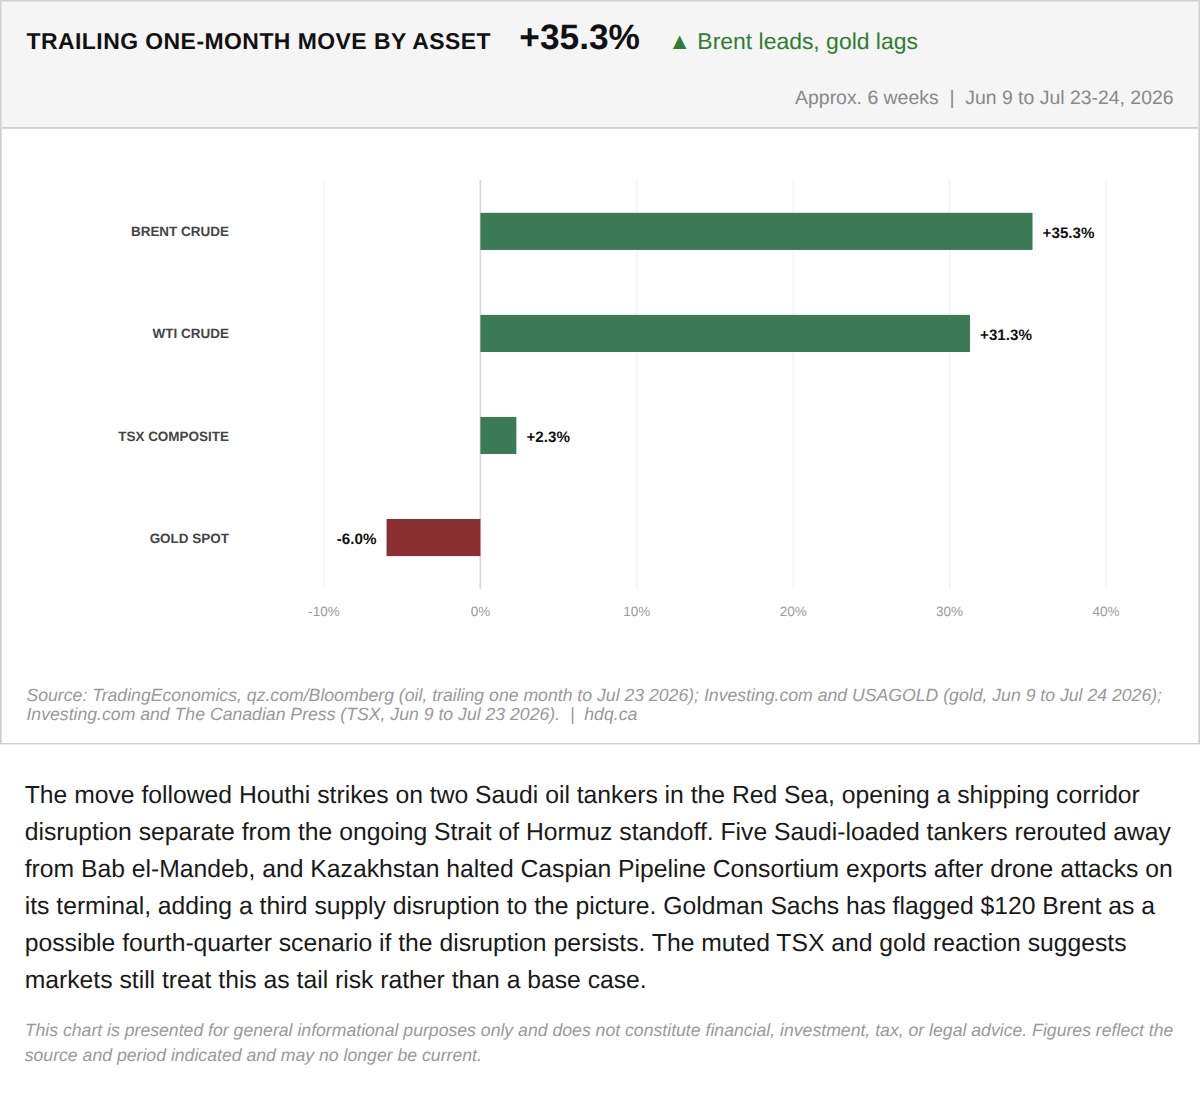
The move followed Houthi strikes on two Saudi oil tankers in the Red Sea, opening a shipping corridor disruption separate from the ongoing Strait of Hormuz standoff.
The Houthis Just Opened a Second Chokepoint. Markets Are Not Pricing It Yet.
July 24, 2026
View chart & download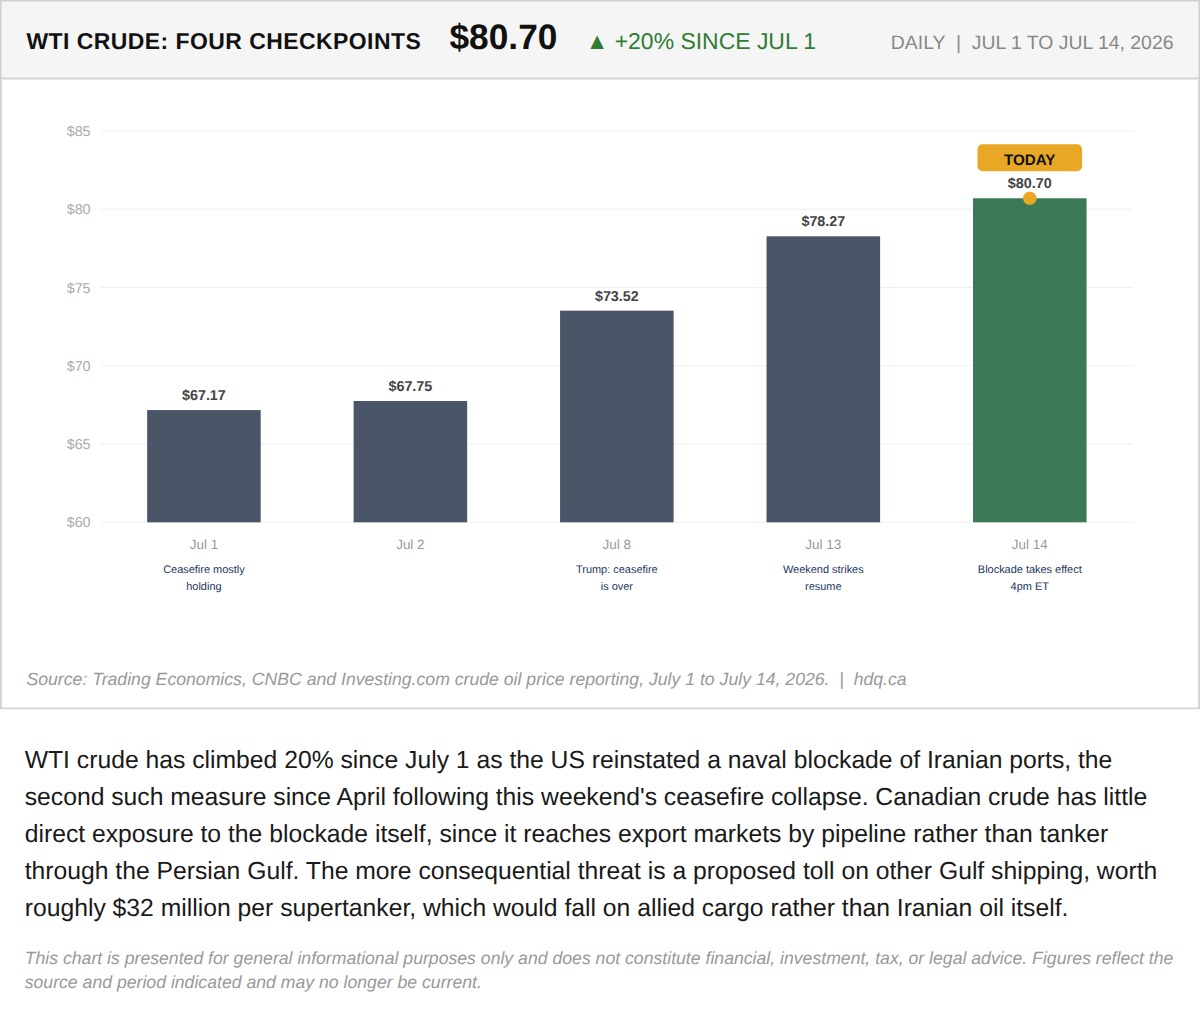
WTI crude has climbed 20% since July 1 as the US reinstated a naval blockade of Iranian ports, the second such measure since April following this weekend's ceasefire collapse.
Iran's Blockade Barely Touches Canadian Oil. The Toll on Everyone Else Might.
July 14, 2026
View chart & download