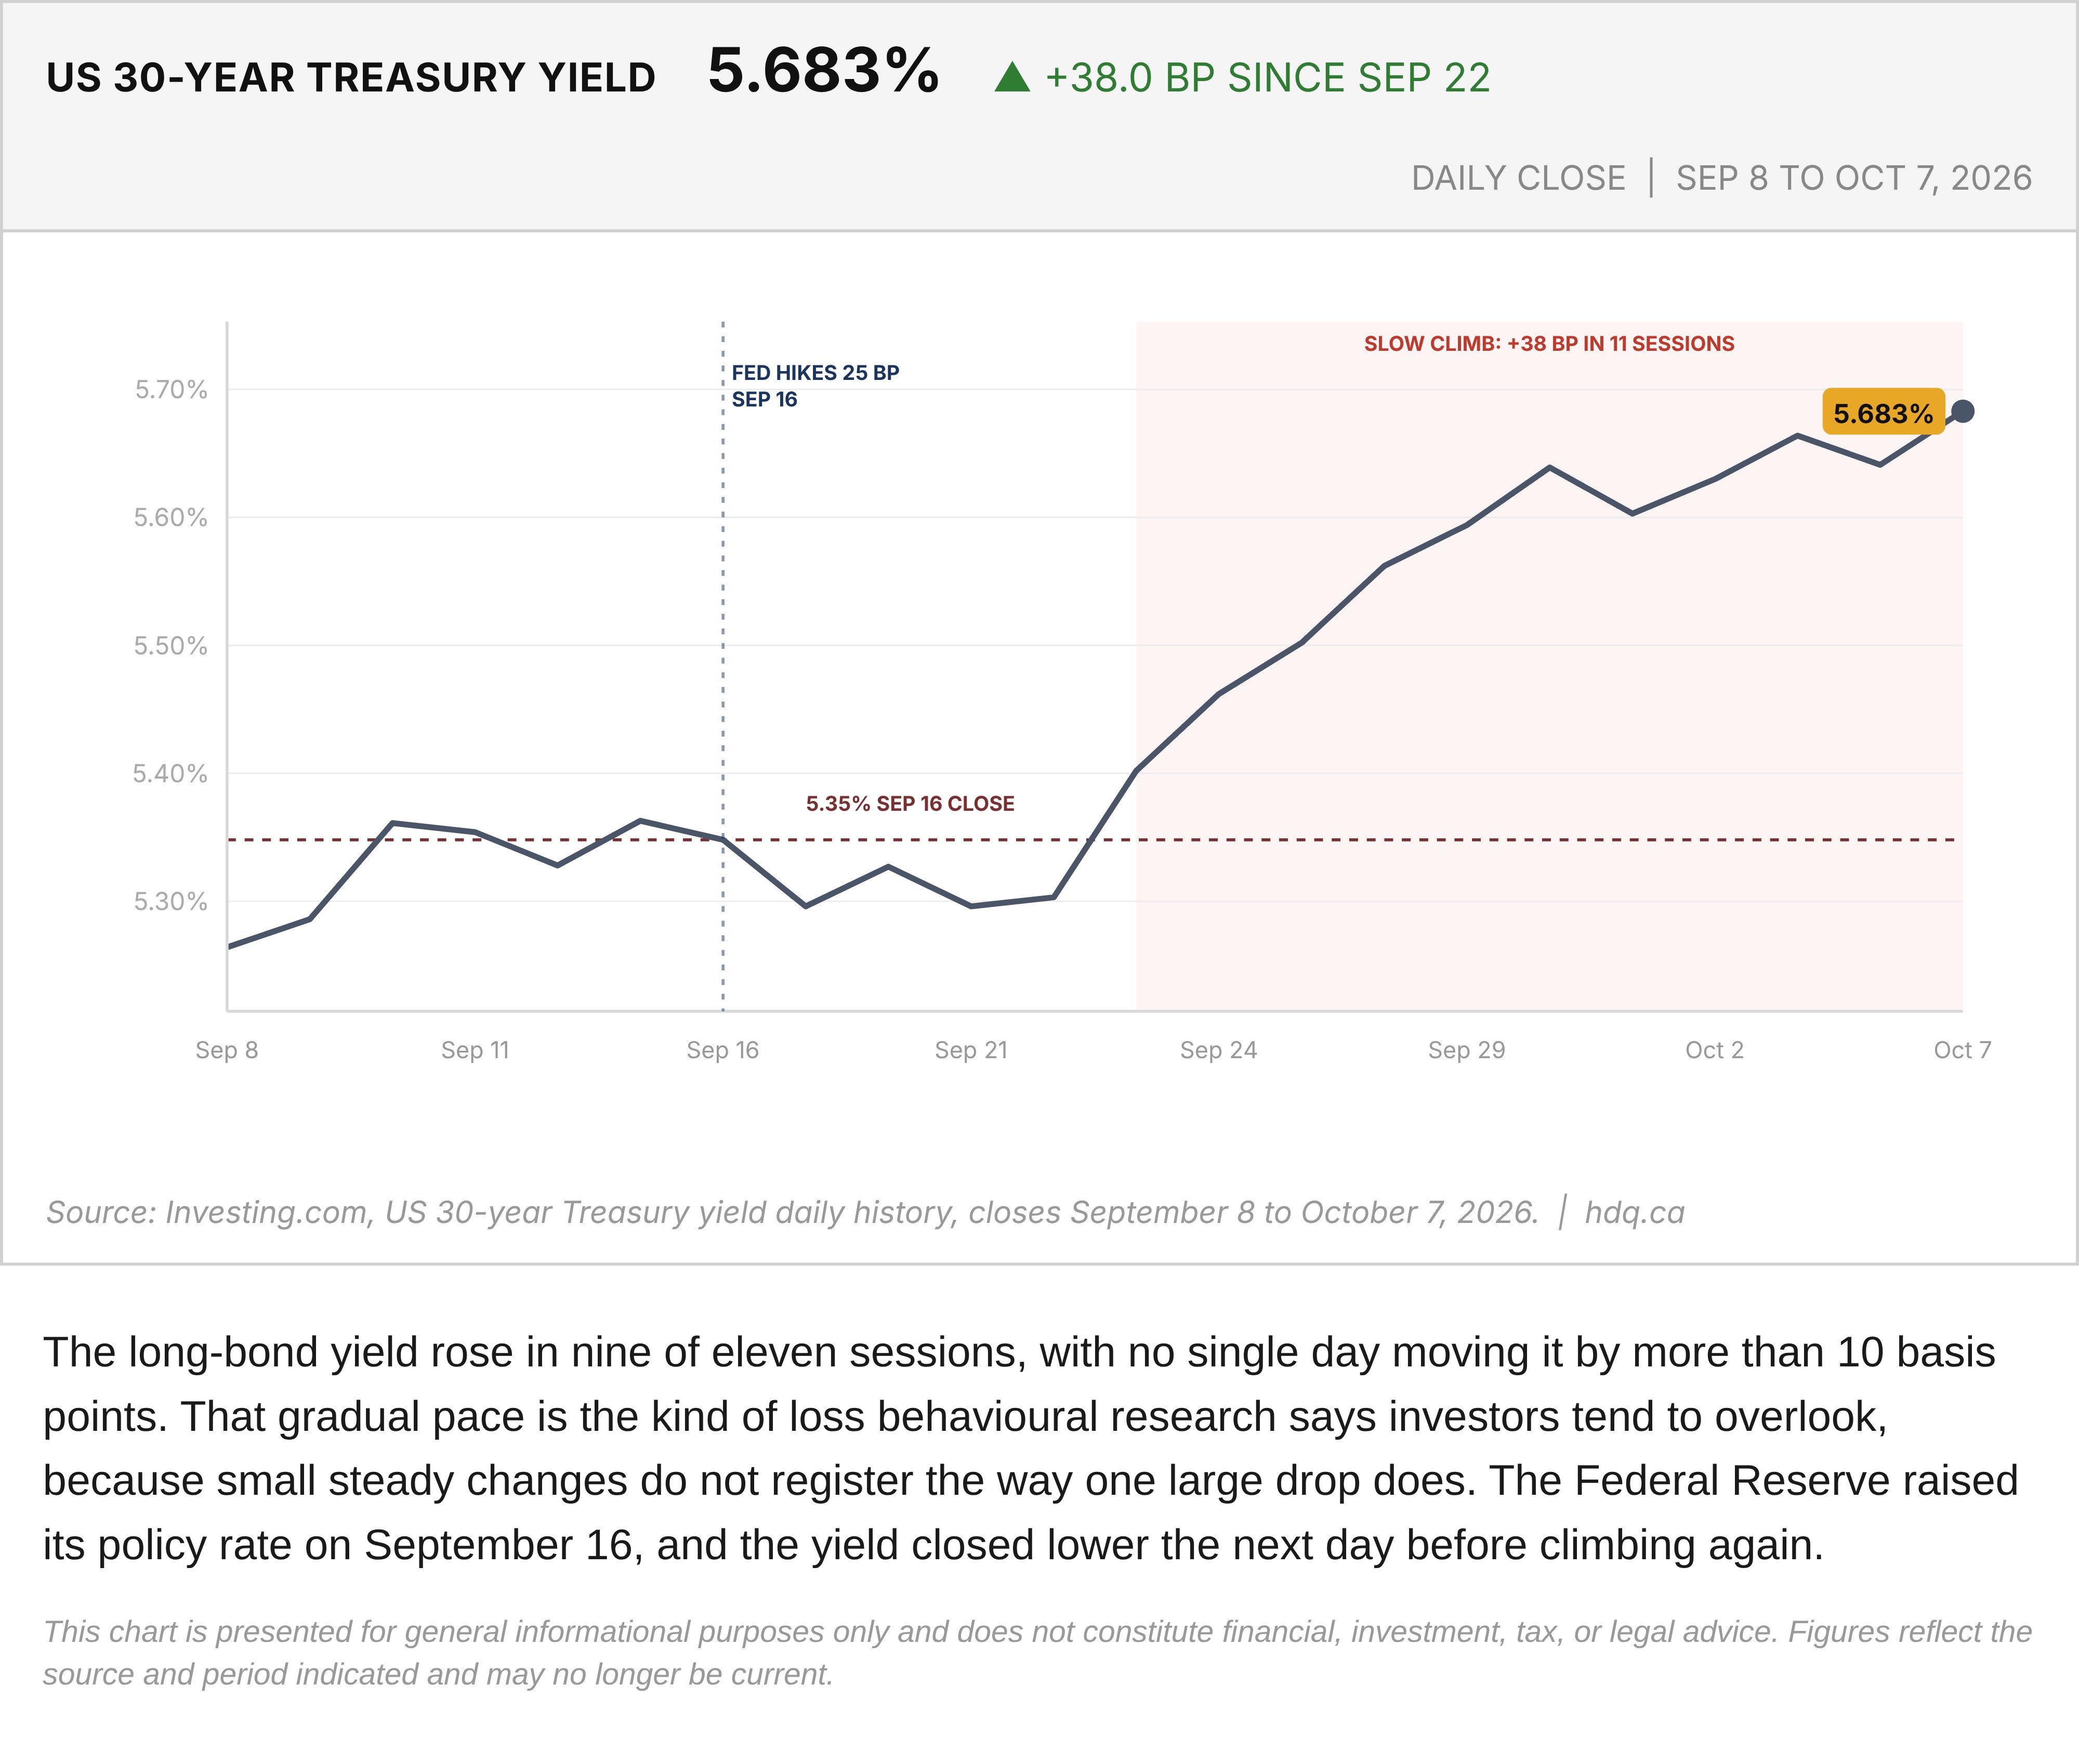
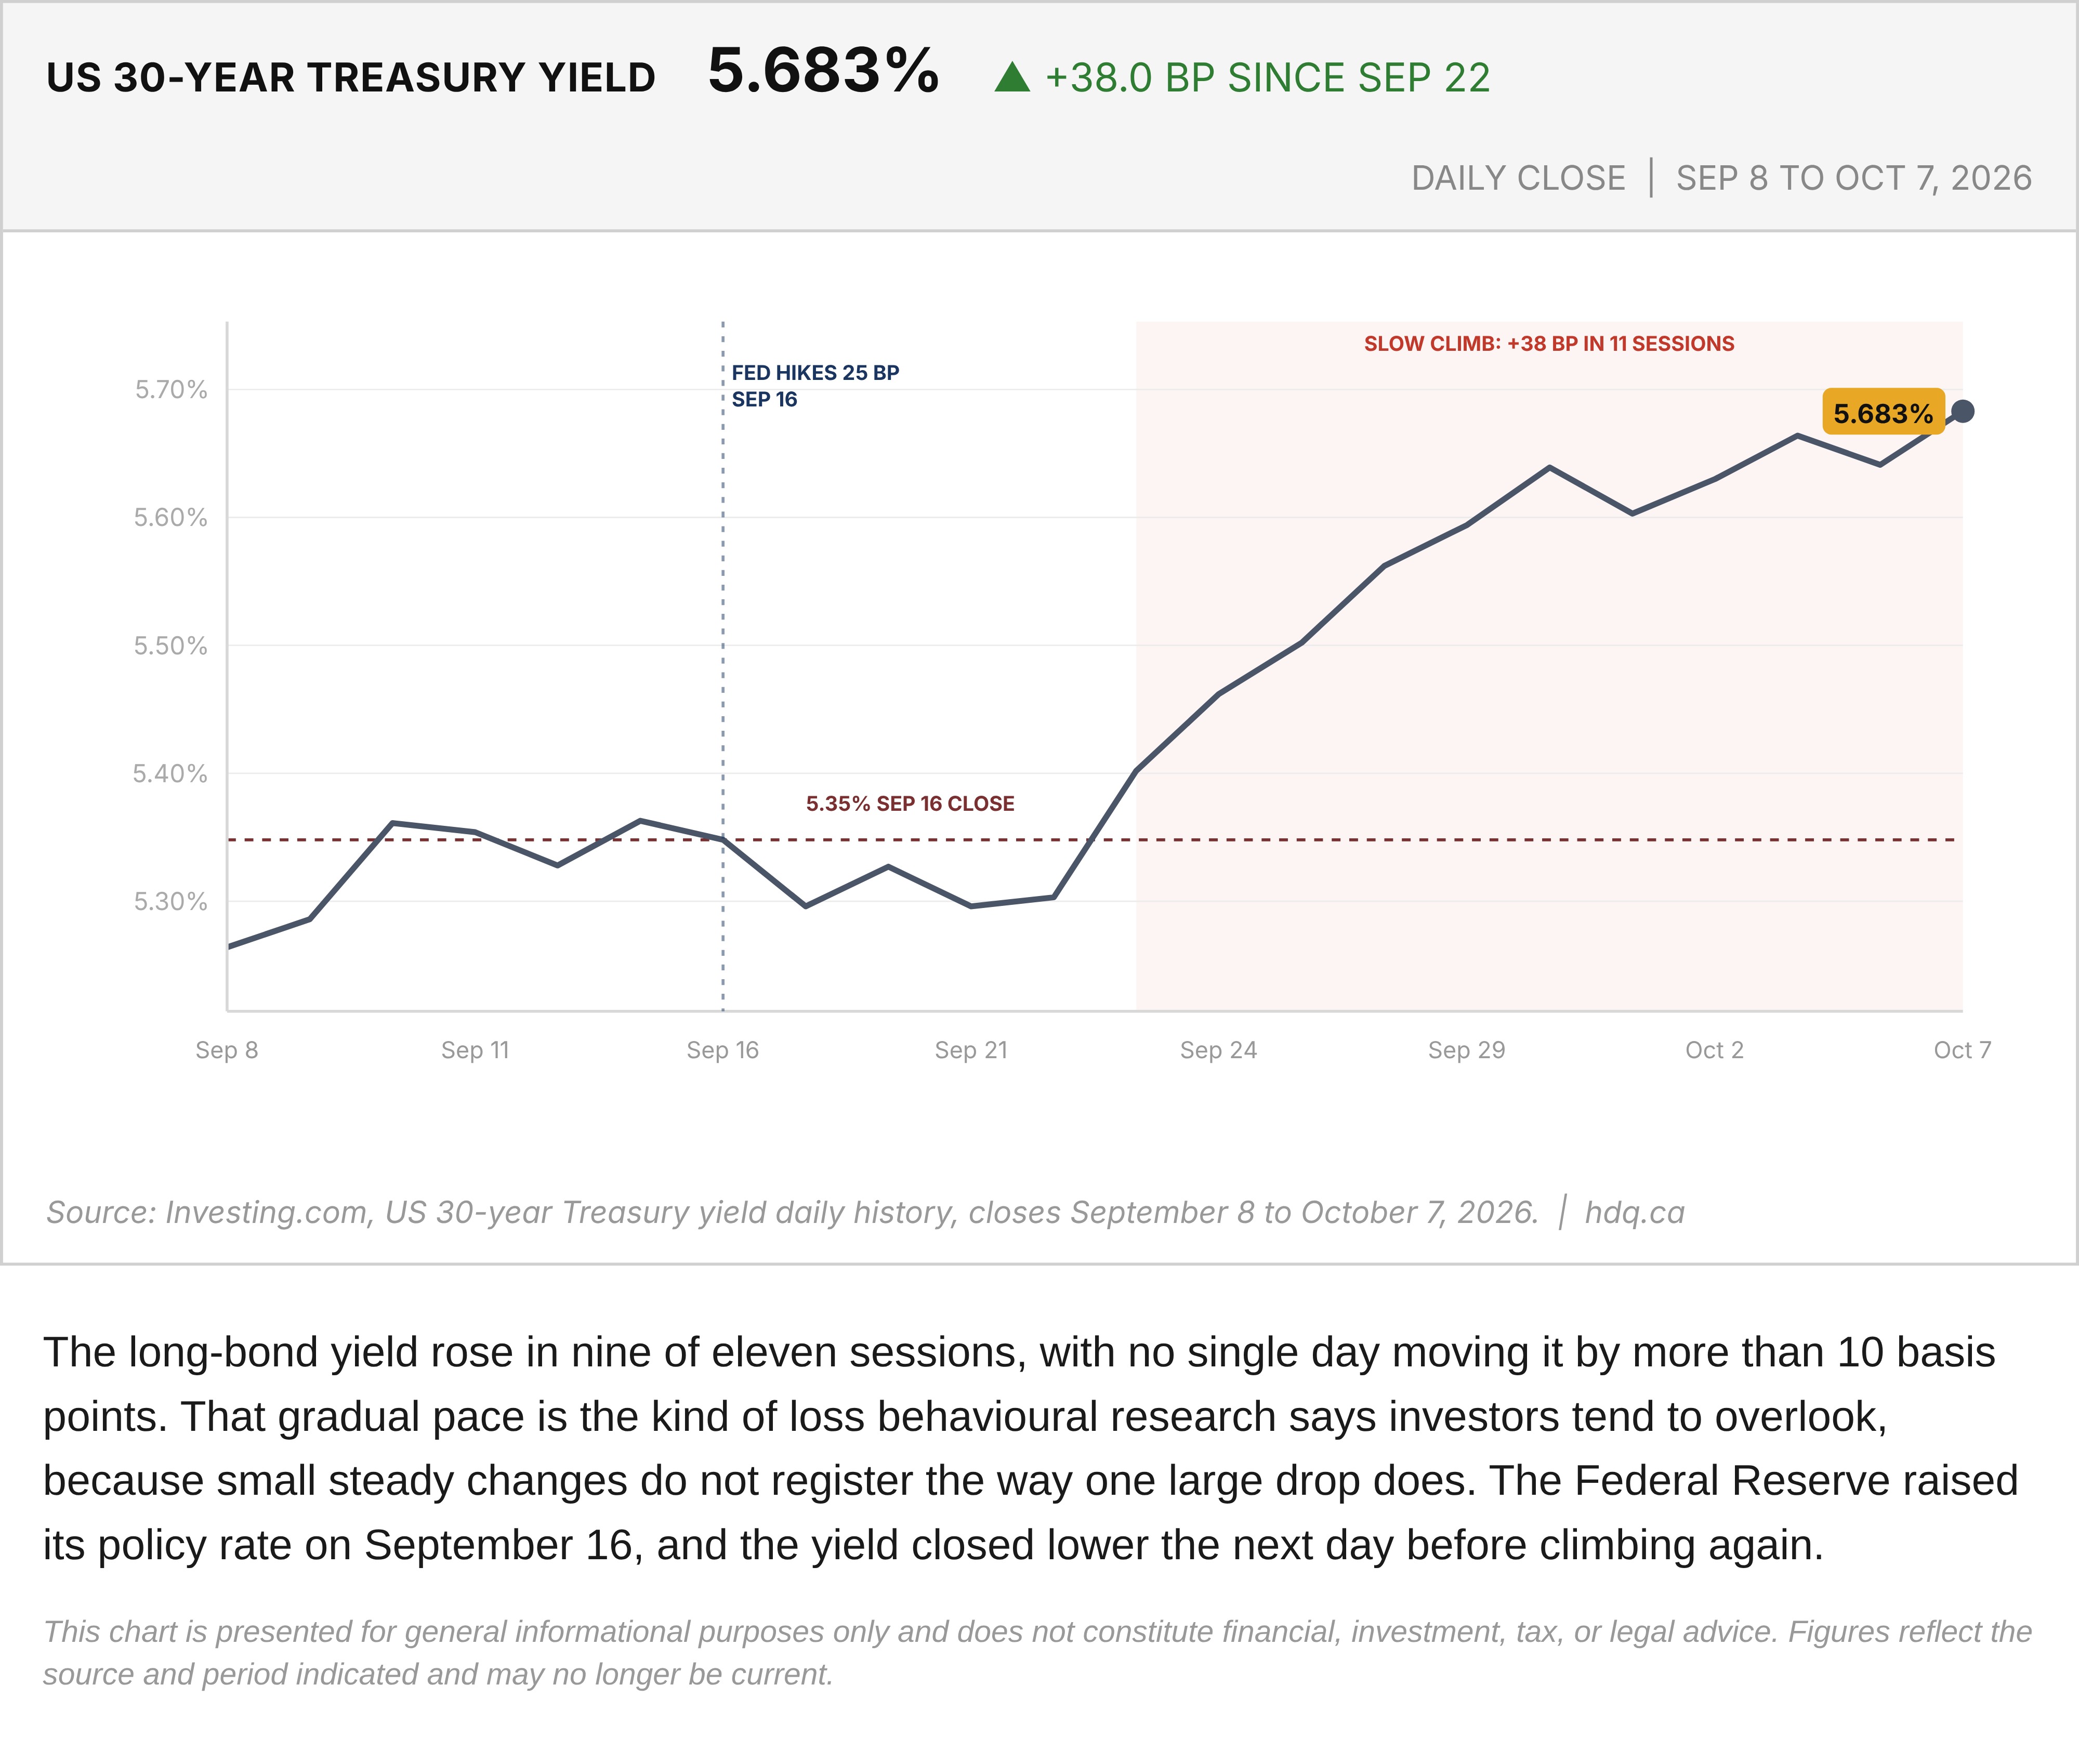
The long-bond yield rose in nine of eleven sessions, with no single day moving it by more than 10 basis points. That gradual pace is the kind of loss behavioural research says investors tend to overlook, because small steady changes do not register the way one large drop does. The Federal Reserve raised its policy rate on September 16, and the yield closed lower the next day before climbing again.
This chart is presented for general informational purposes only and does not constitute financial, investment, tax, or legal advice. Figures reflect the source and period indicated and may no longer be current.
Related charts
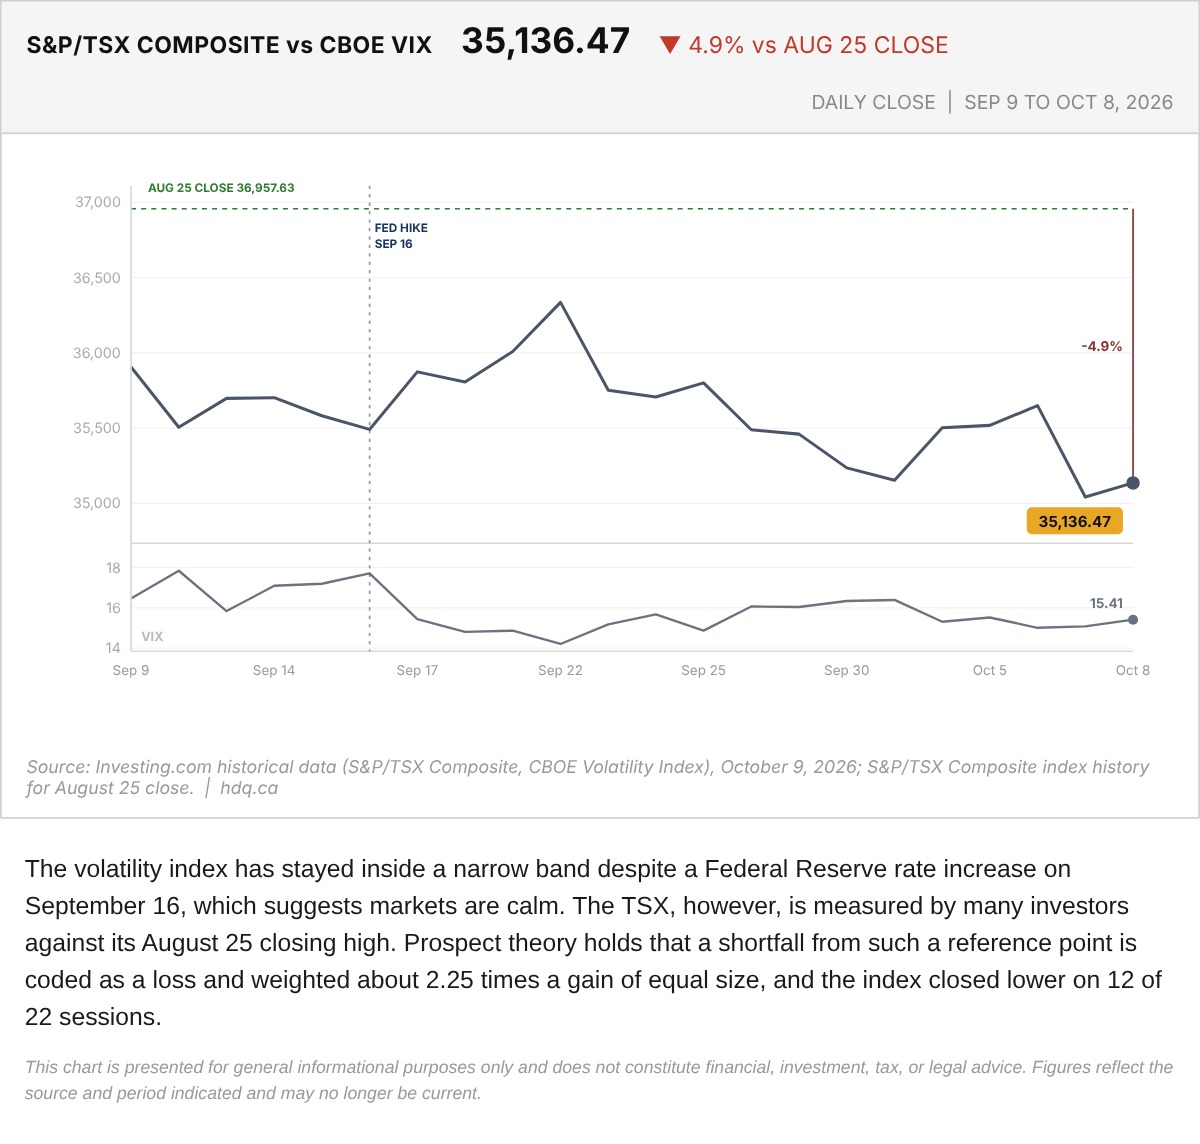
The volatility index has stayed inside a narrow band despite a Federal Reserve rate increase on September 16, which suggests markets are calm.
S&P/TSX Composite Against the Cboe VIX, September 9 to October 8
October 9, 2026
View chart & download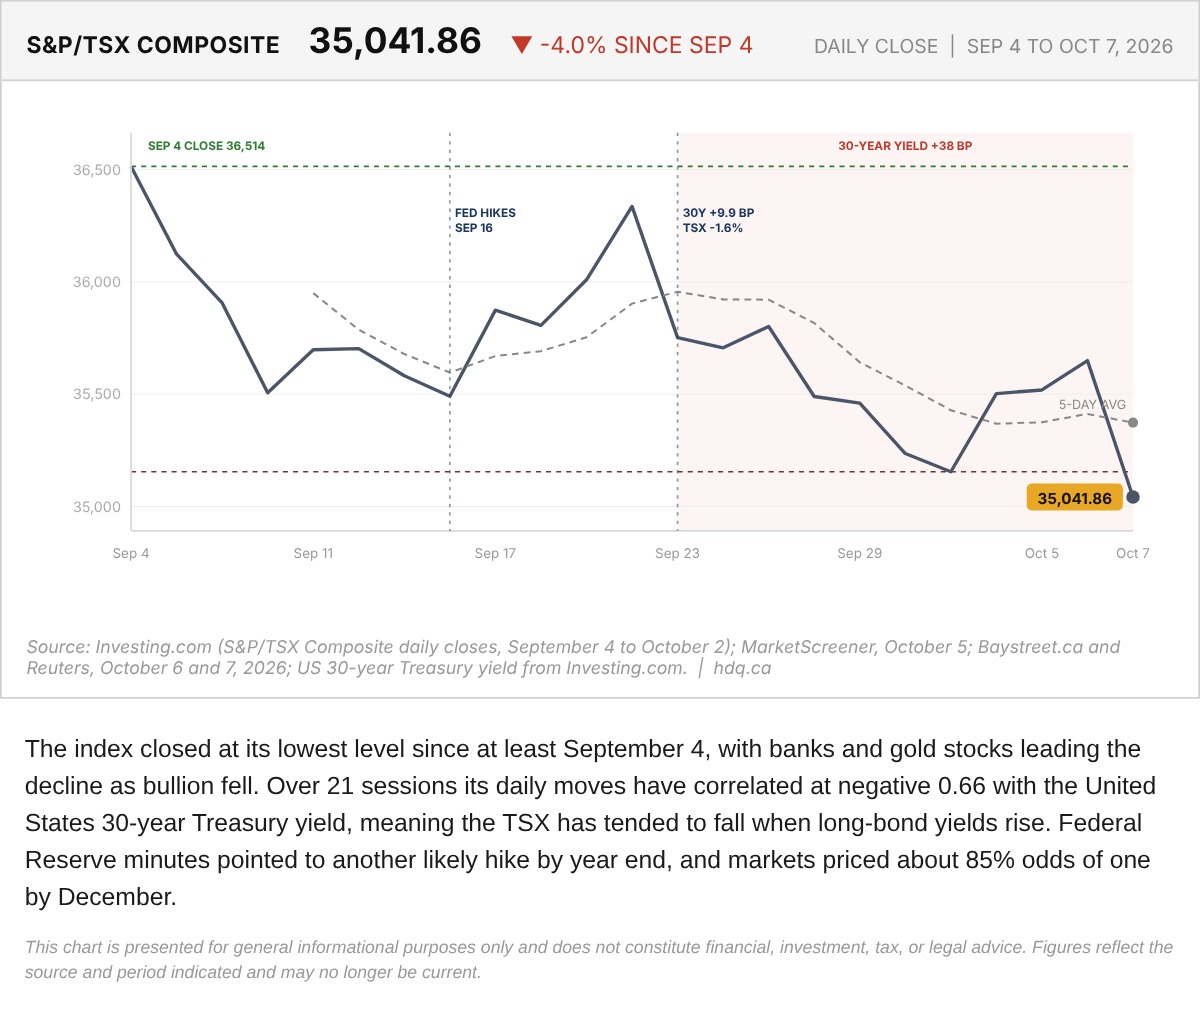
The index closed at its lowest level since at least September 4, with banks and gold stocks leading the decline as bullion fell.
S&P/TSX Composite With Five-Session Average, September 4 to October 7
October 8, 2026
View chart & download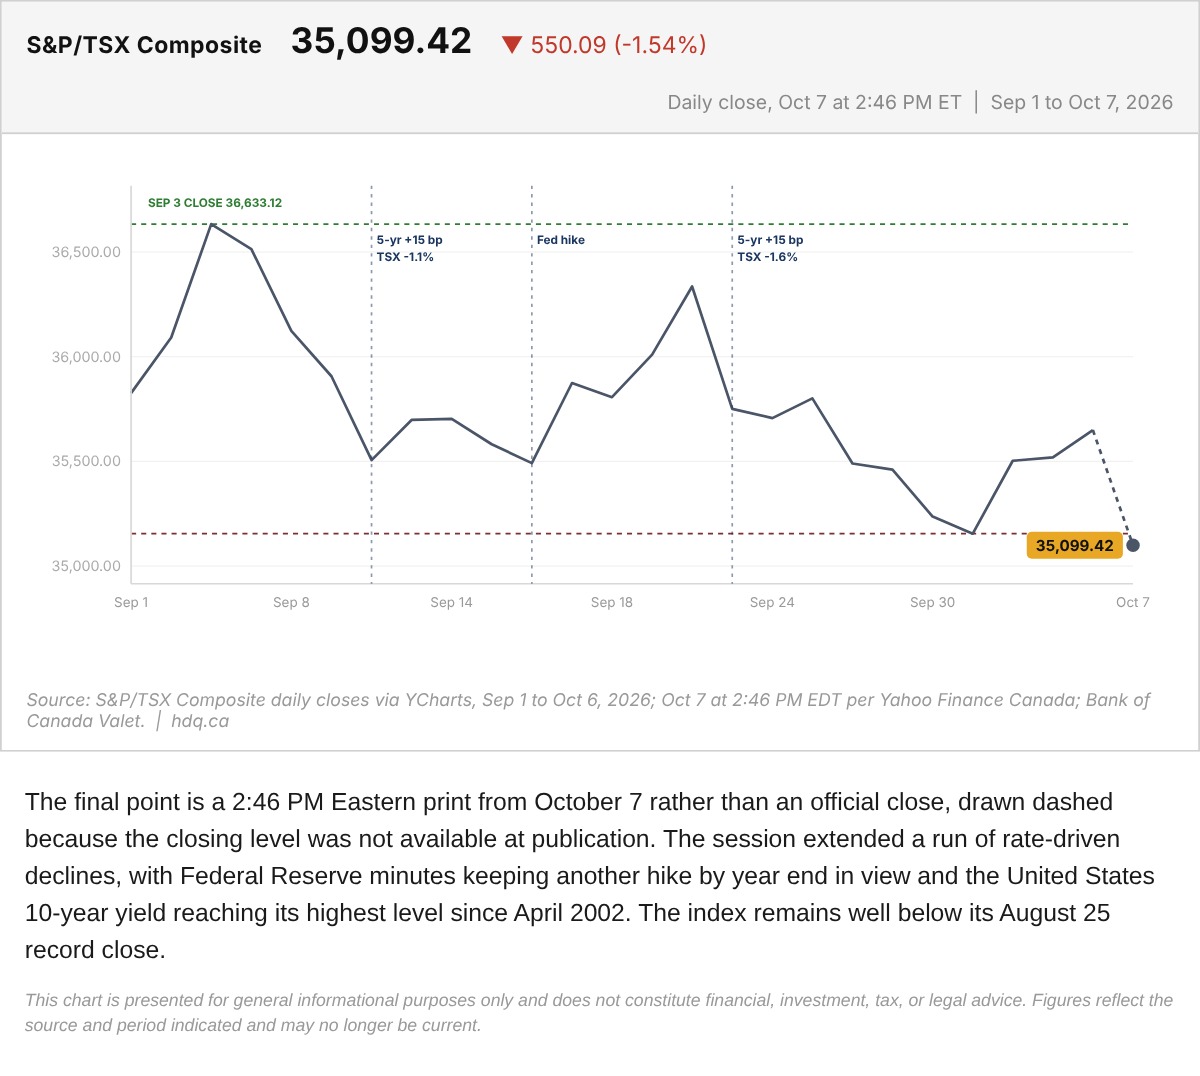
The final point is a 2:46 PM Eastern print from October 7 rather than an official close, drawn dashed because the closing level was not available at publication.
S&P/TSX Composite With the October 7 Midday Print
October 7, 2026
View chart & download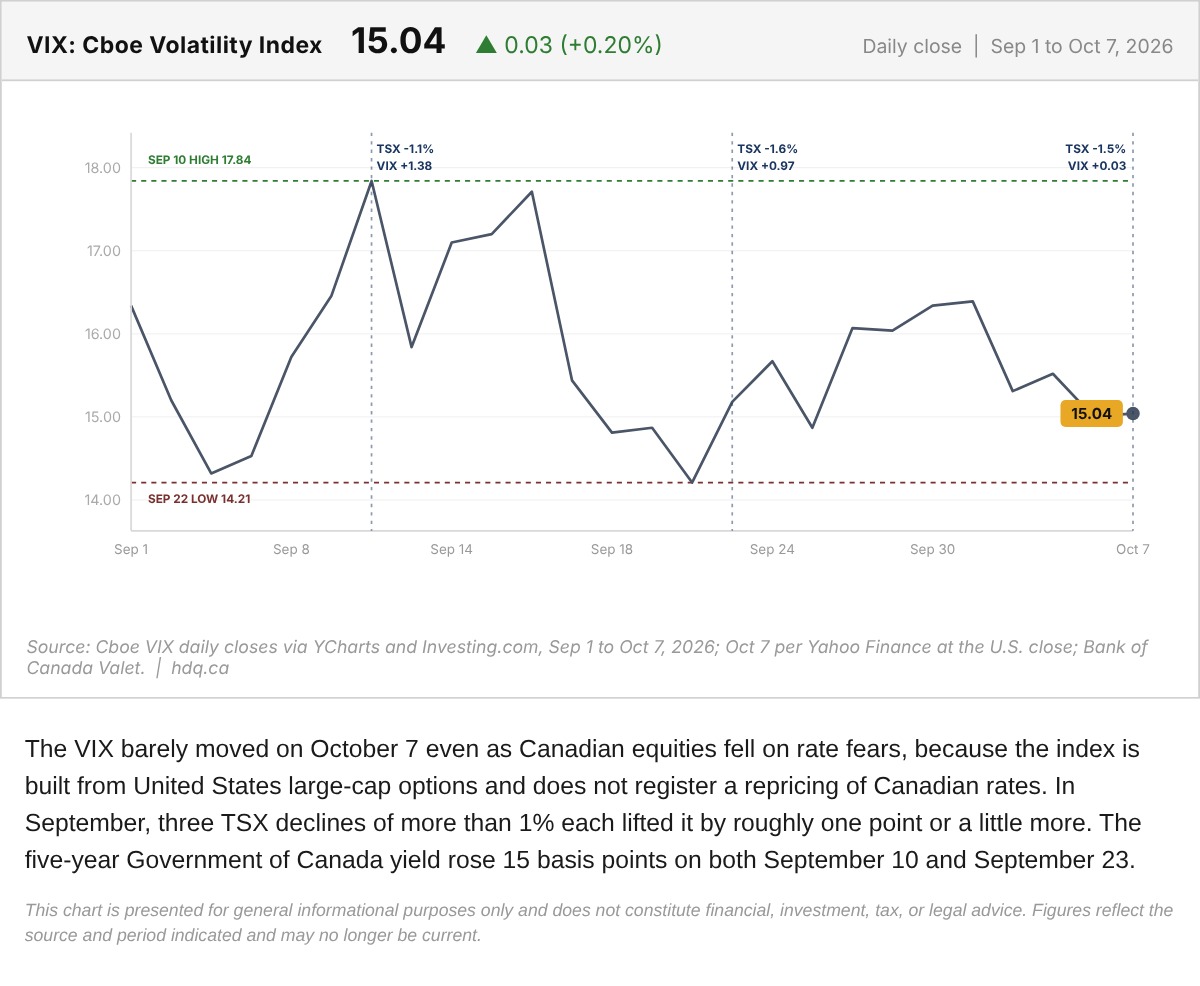
The VIX barely moved on October 7 even as Canadian equities fell on rate fears, because the index is built from United States large-cap…
VIX Daily Close on the Day Rate Fear Hit the TSX
October 7, 2026
View chart & download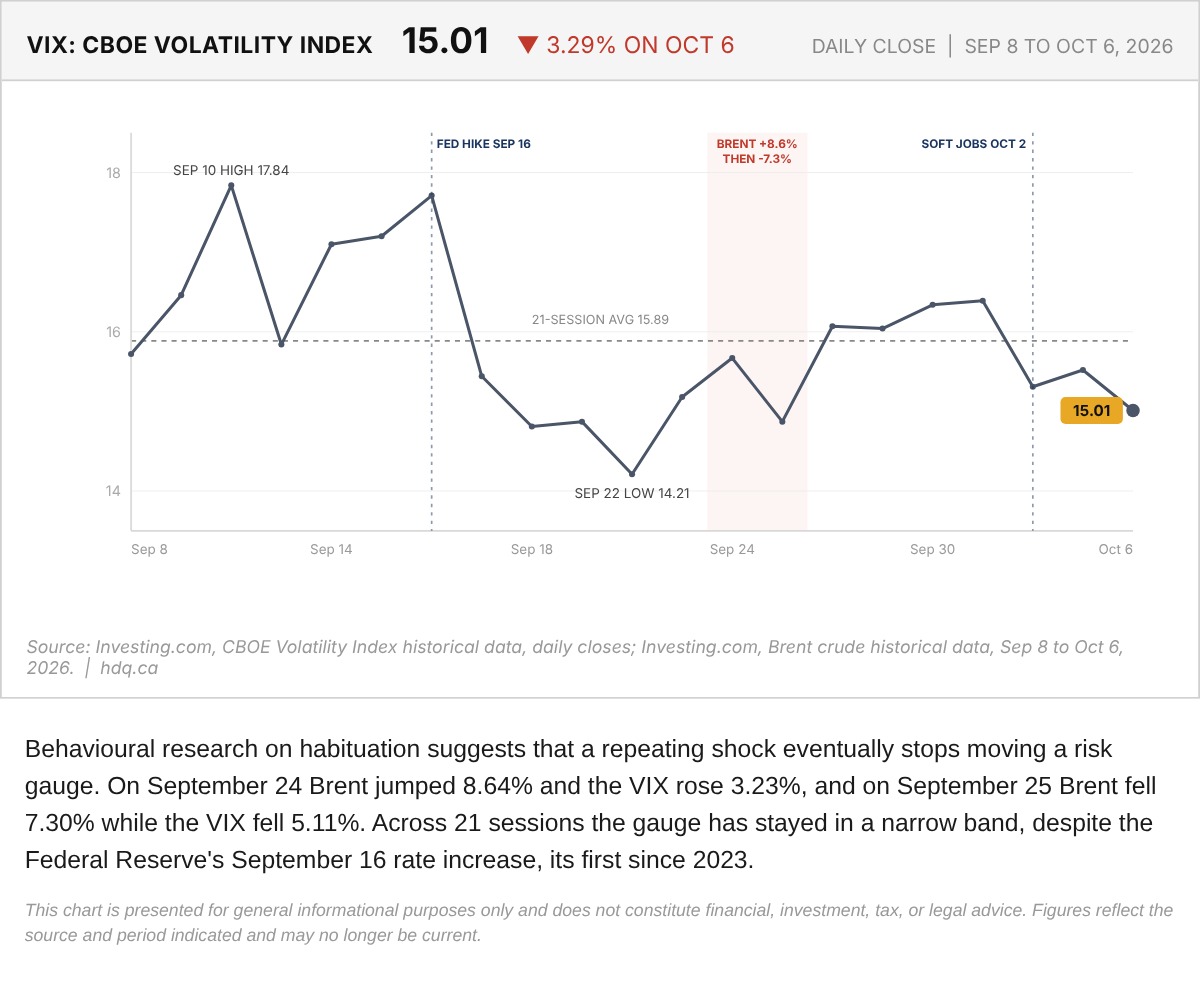
Behavioural research on habituation suggests that a repeating shock eventually stops moving a risk gauge.
VIX Daily Close and Habituation to Oil Shocks, September 8 to October 6
October 7, 2026
View chart & download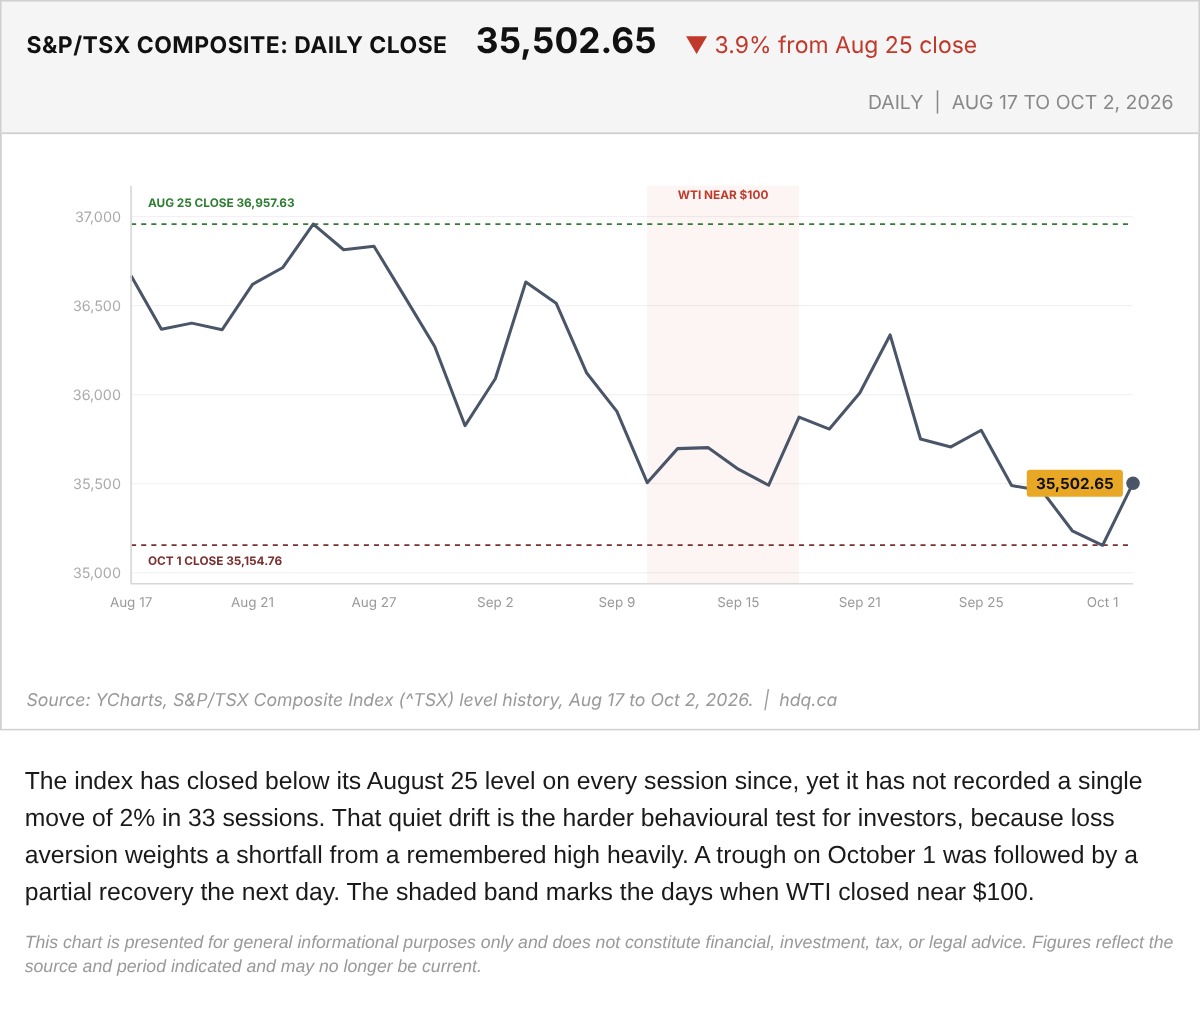
The index has closed below its August 25 level on every session since, yet it has not recorded a single move of 2% in 33 sessions.
S&P/TSX Composite Slide From the August 25 Close, to October 2
October 6, 2026
View chart & download