September 2026
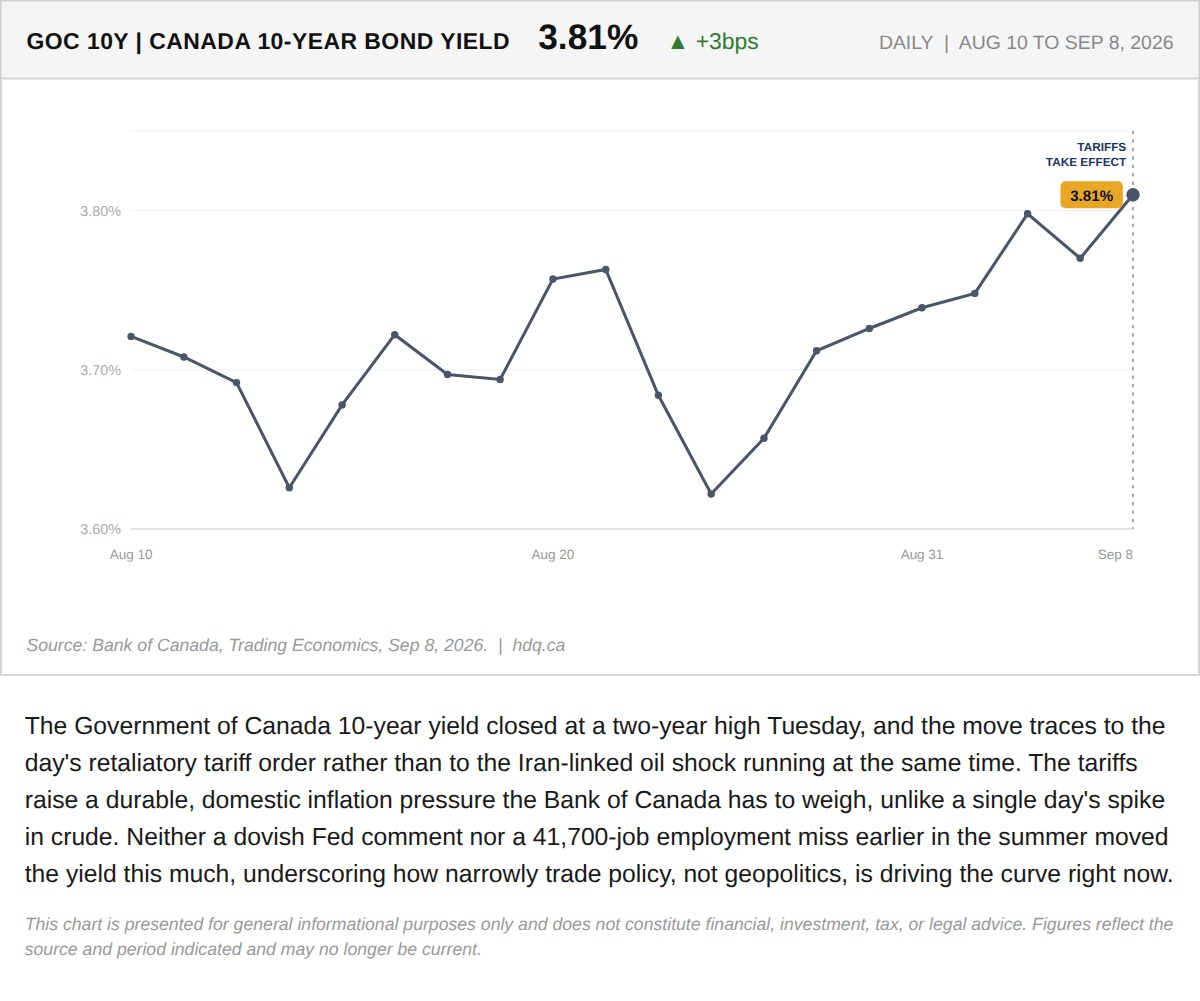
The Government of Canada 10-year yield closed at a two-year high Tuesday, and the move traces to the day's retaliatory tariff order rather…
Canada's Bond Market Shrugged Off a War for Months. A Tariff Order Just Broke It.
September 8, 2026
View chart & download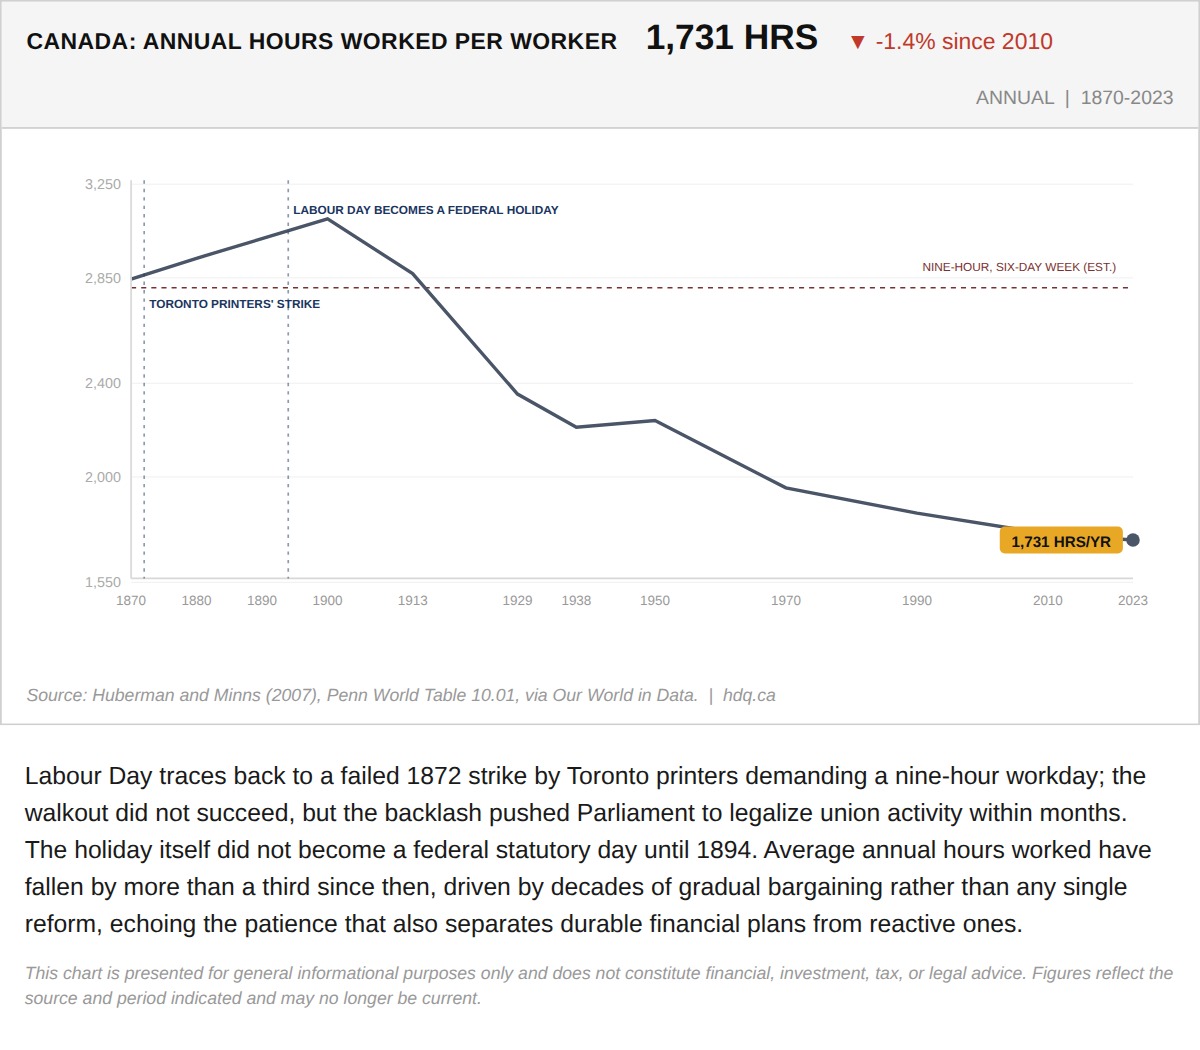
Labour Day traces back to a failed 1872 strike by Toronto printers demanding a nine-hour workday; the walkout did not succeed, but the…
How Canada Decided Its Workers Deserved a Day
September 7, 2026
View chart & download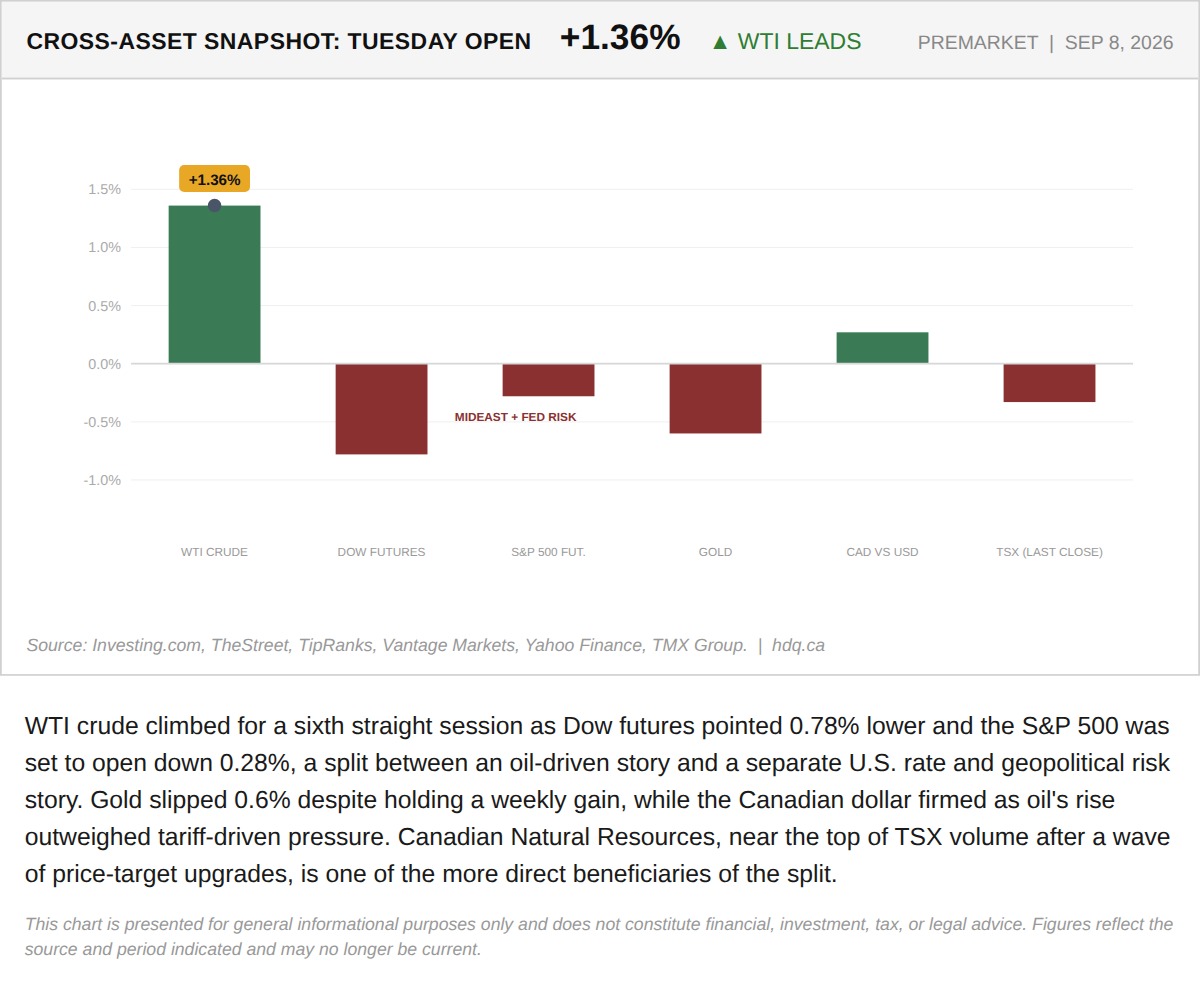
WTI crude climbed for a sixth straight session as Dow futures pointed 0.78% lower and the S&P 500 was set to open down 0.28%, a split between an oil-driven story and a separate U.S.
Dow Futures Fall 0.78% as Oil Climbs Toward $94, and Canadian Energy Is the Beneficiary
September 8, 2026
View chart & download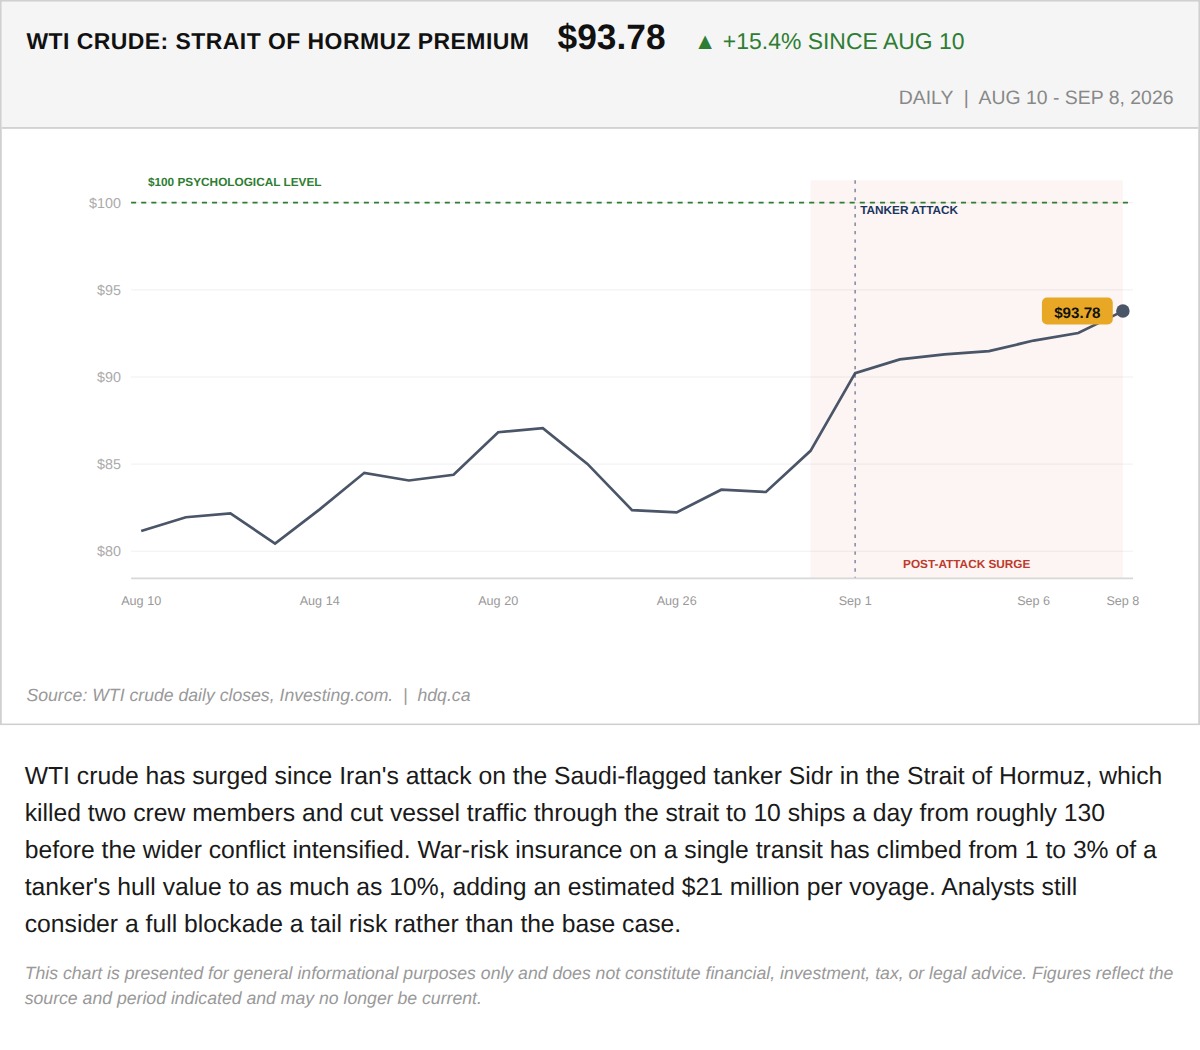
WTI crude has surged since Iran's attack on the Saudi-flagged tanker Sidr in the Strait of Hormuz, which killed two crew members and cut…
The Hormuz Attack That Killed Two Sailors Is Now a Canadian Currency Story
September 8, 2026
View chart & download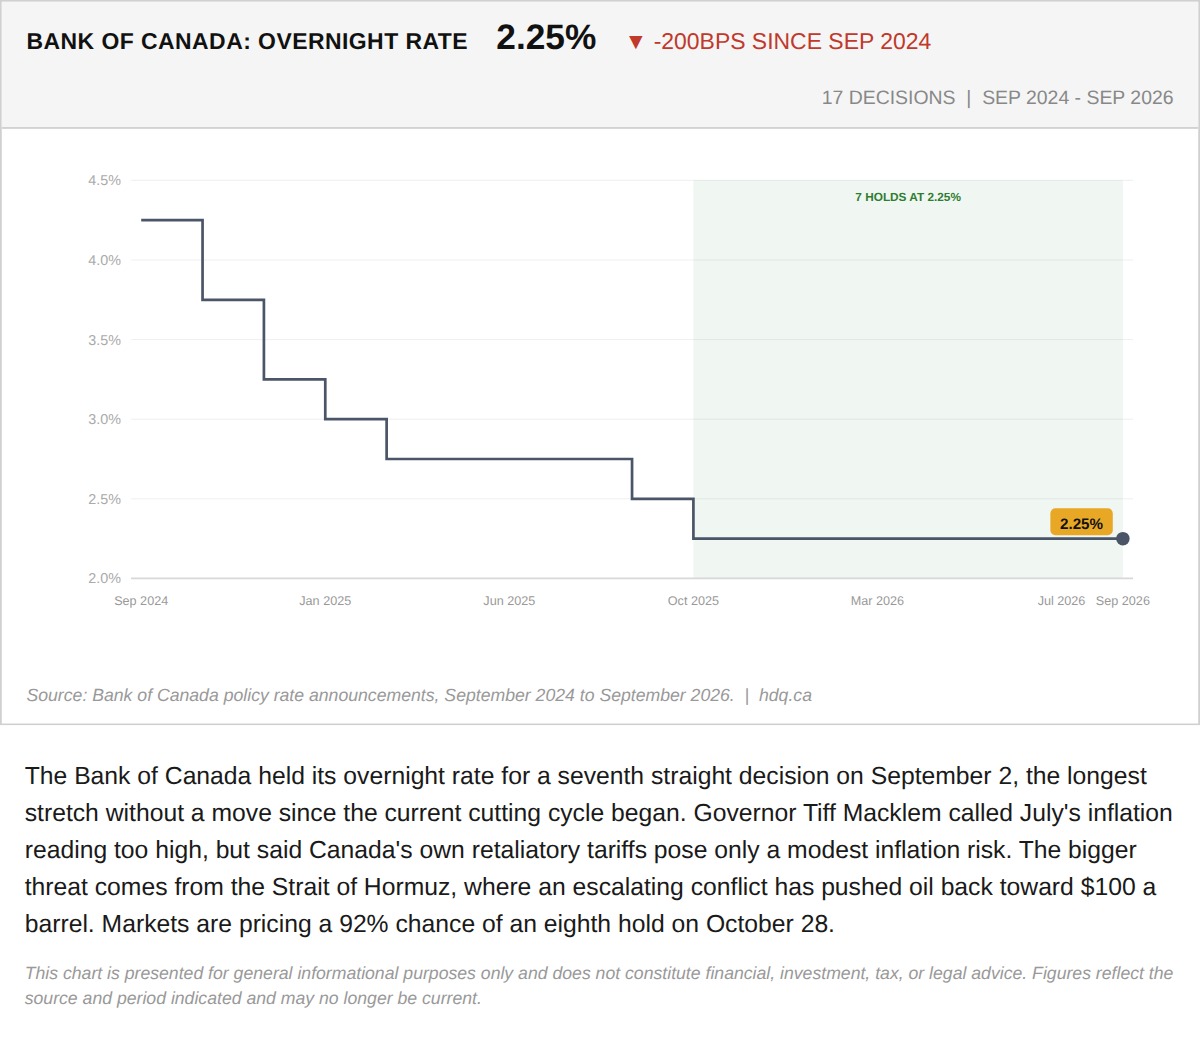
The Bank of Canada held its overnight rate for a seventh straight decision on September 2, the longest stretch without a move since the current cutting cycle began.
The Bank of Canada Has Held for Seven Straight Decisions, and Inflation Just Made the Eighth Harder
September 8, 2026
View chart & download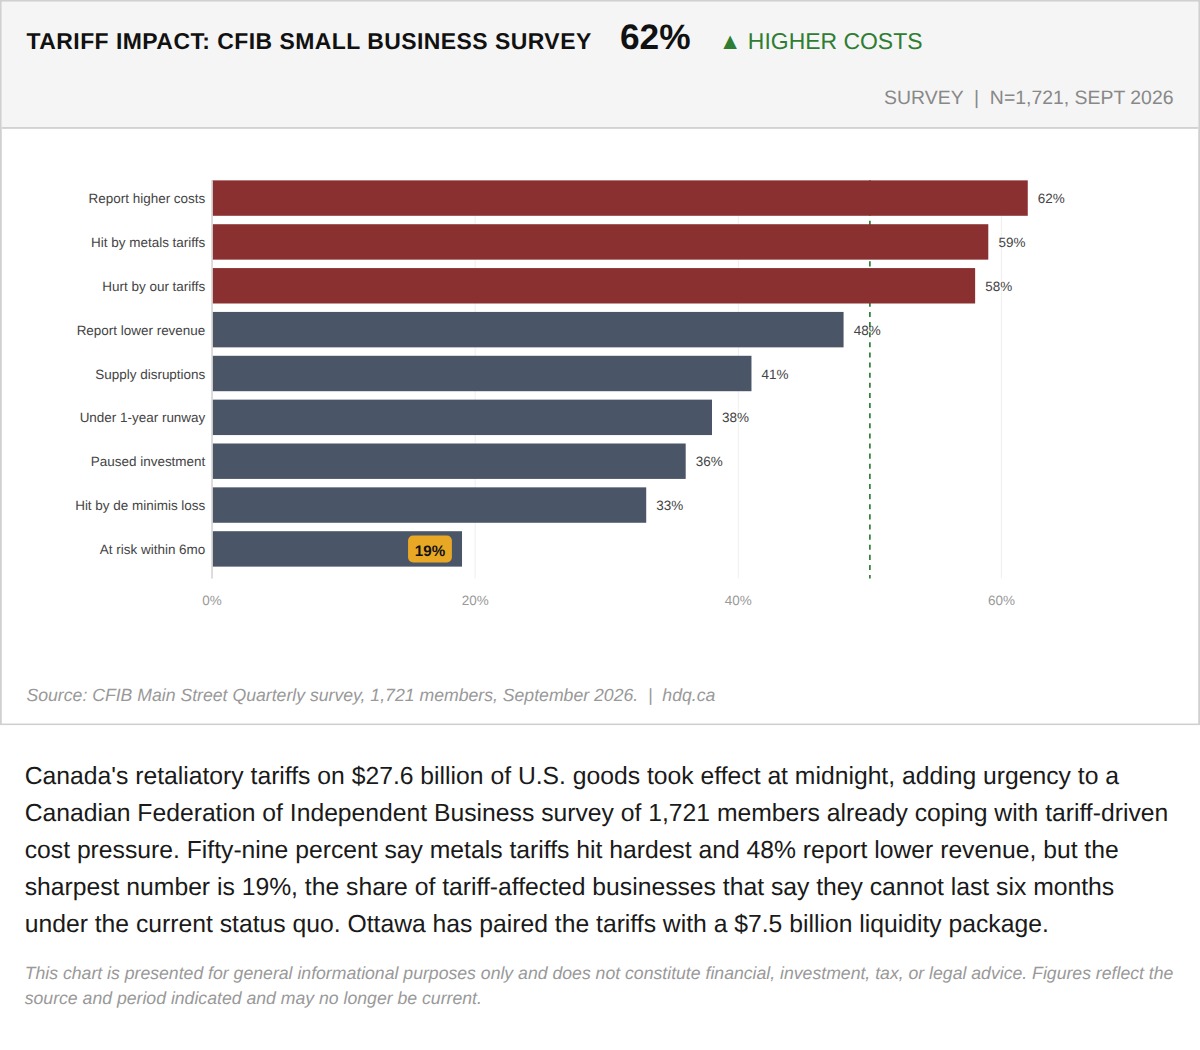
Canada's retaliatory tariffs on $27.6 billion of U.S.
Retaliatory Tariffs Took Effect Today, and One in Five Affected Businesses Say They Have Six Months
September 8, 2026
View chart & download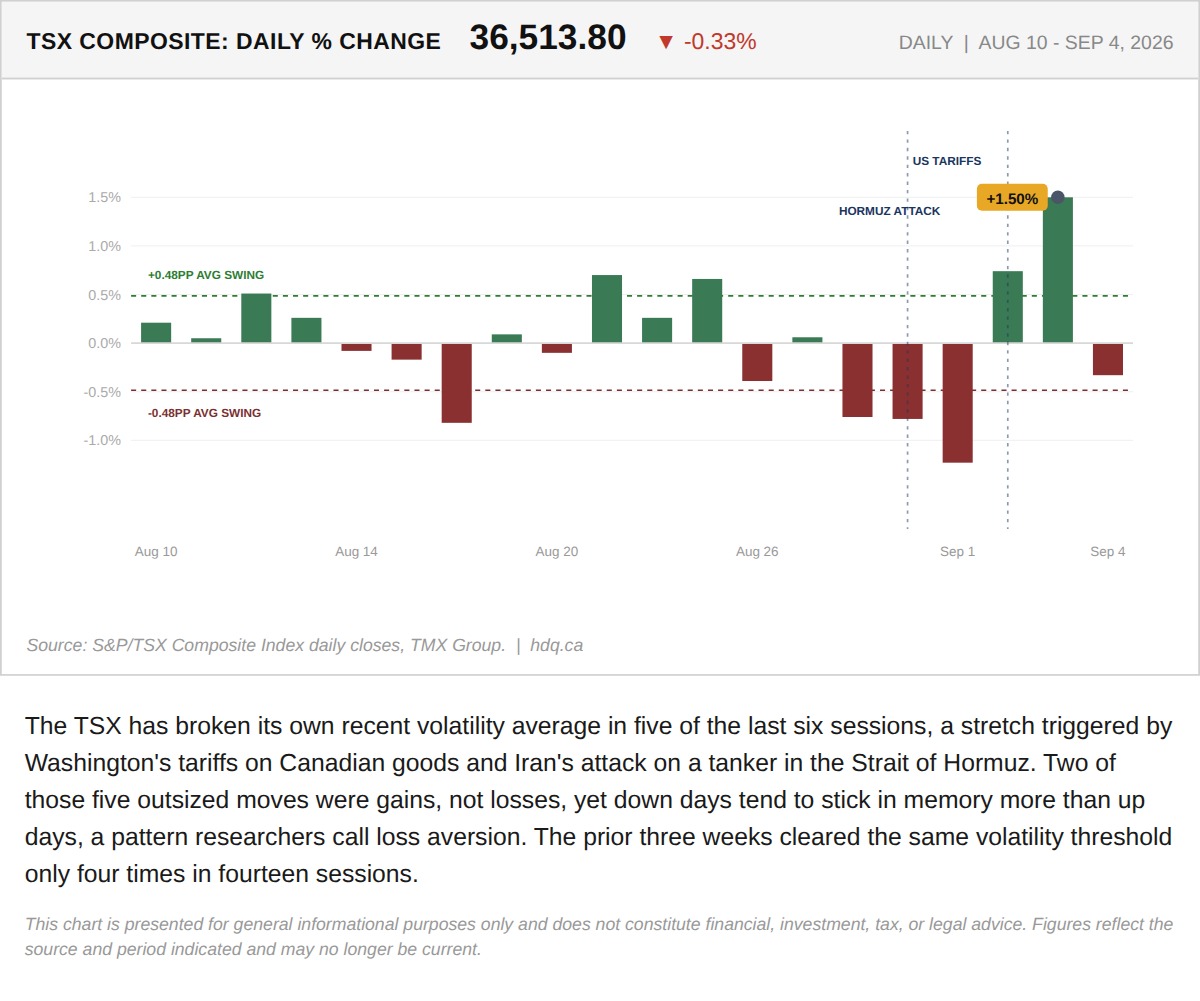
The TSX has broken its own recent volatility average in five of the last six sessions, a stretch triggered by Washington's tariffs on…
Why This Week Feels Worse Than the TSX Actually Performed
September 8, 2026
View chart & download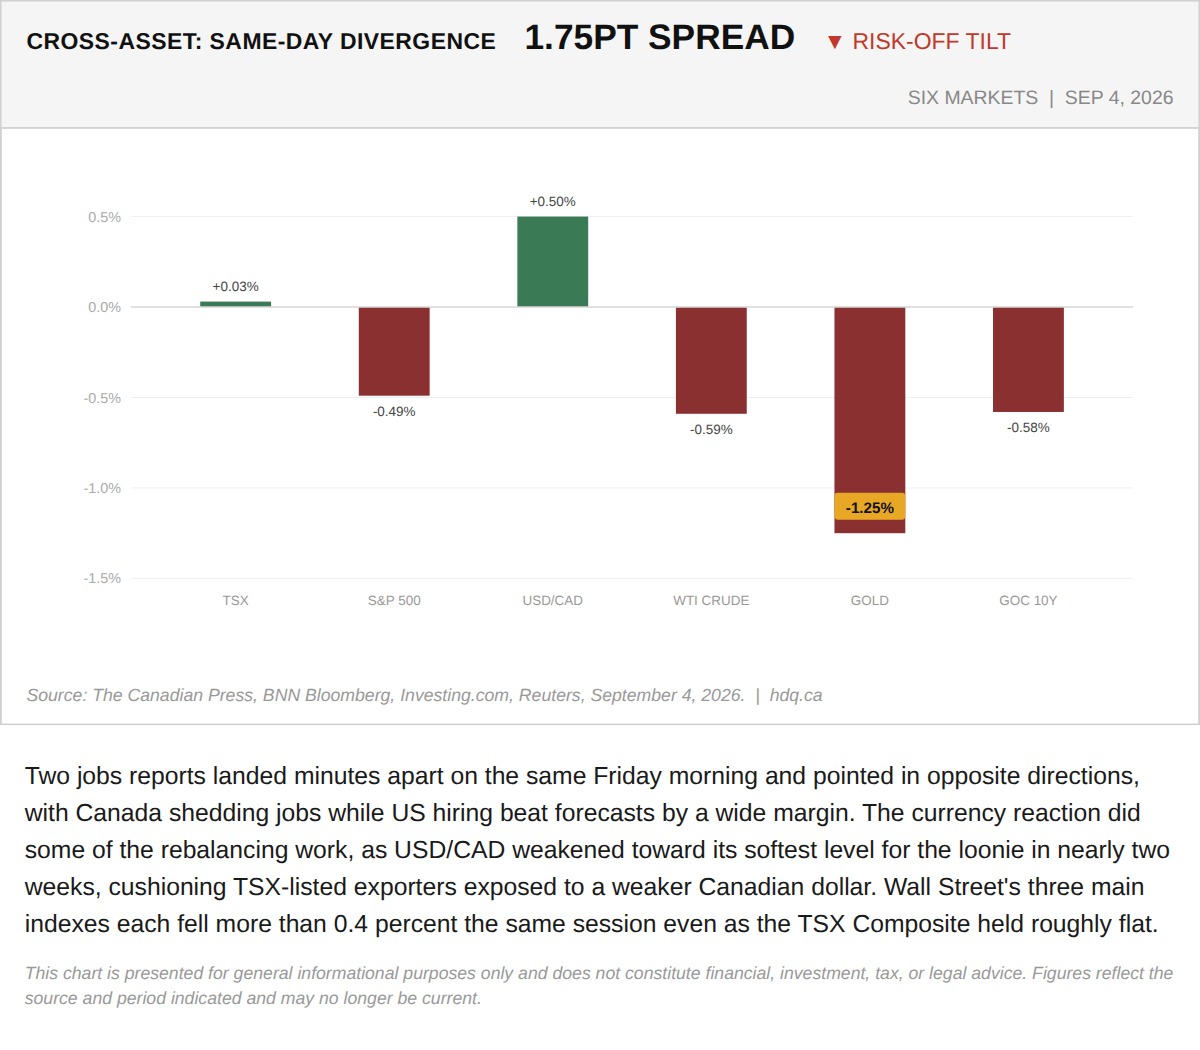
Two jobs reports landed minutes apart on the same Friday morning and pointed in opposite directions, with Canada shedding jobs while US hiring beat forecasts by a wide margin.
Six Markets Diverge in the Same Session as Canada and US Jobs Data Split
September 4, 2026
View chart & download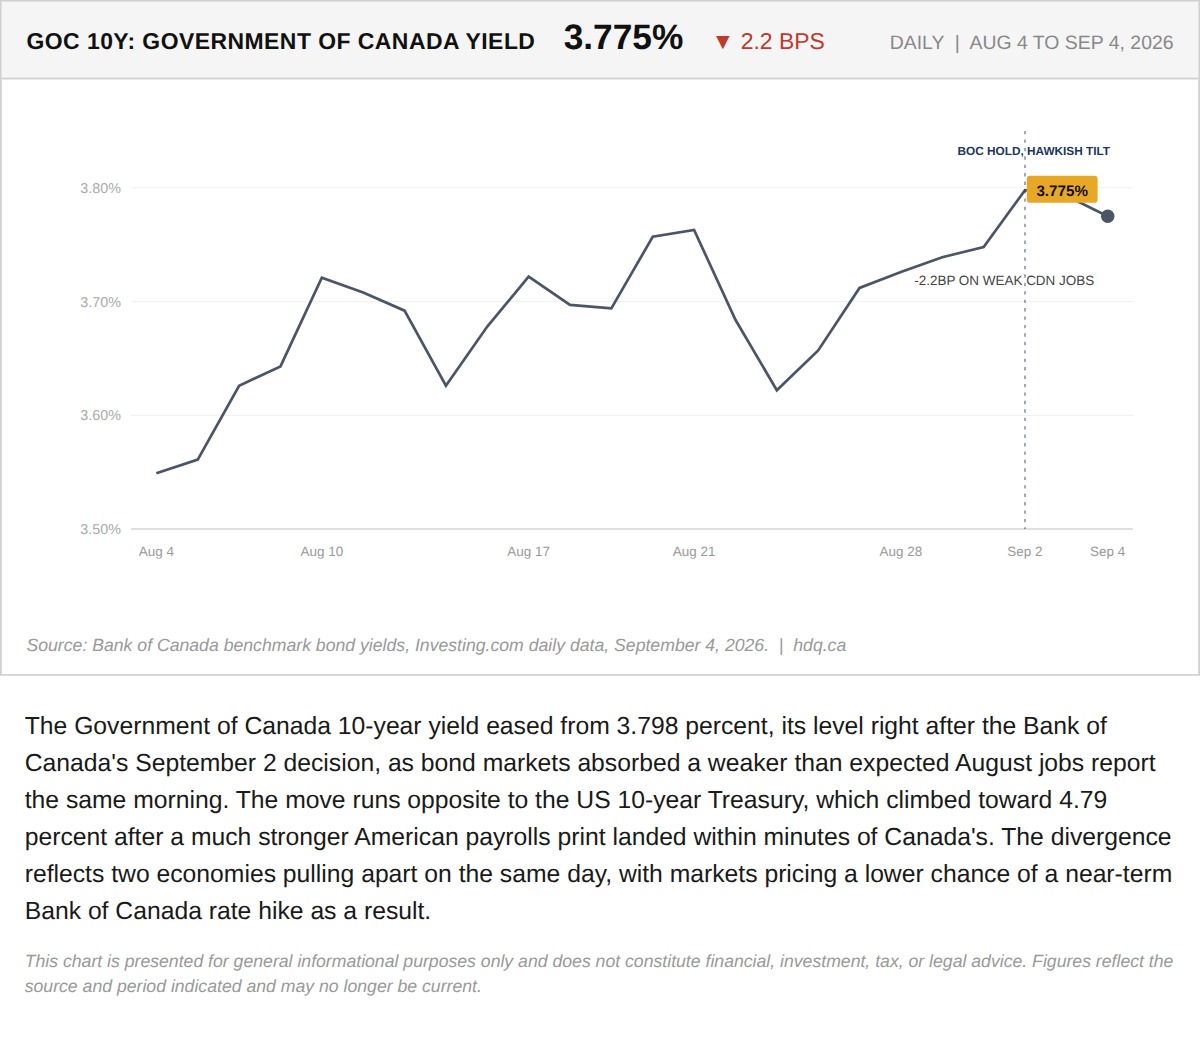
The Government of Canada 10-year yield eased from 3.798 percent, its level right after the Bank of Canada's September 2 decision, as bond…
Government of Canada 10-Year Yield Eases to 3.775% After August Jobs Miss
September 4, 2026
View chart & download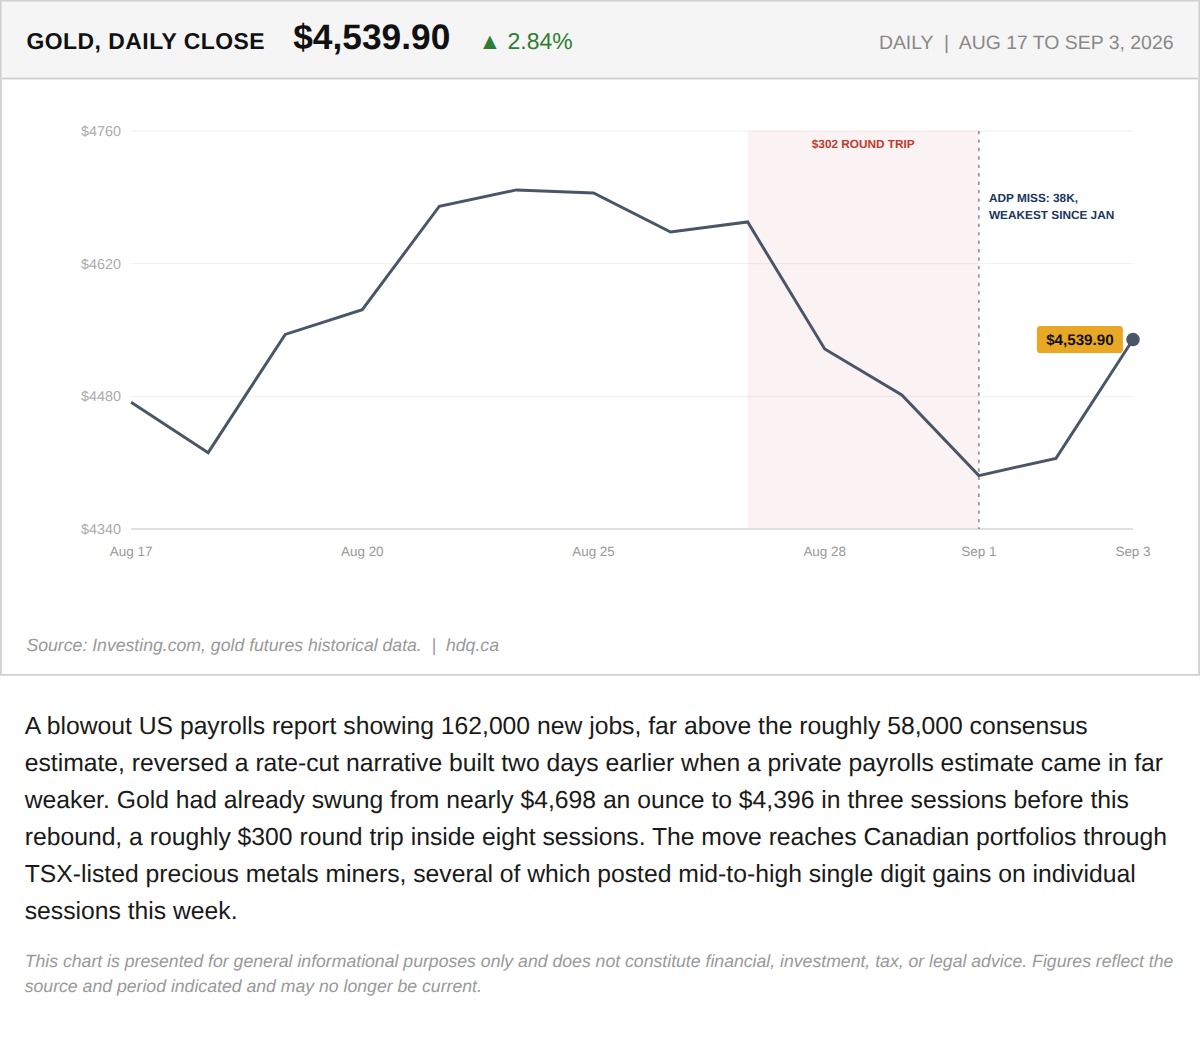
A blowout US payrolls report showing 162,000 new jobs, far above the roughly 58,000 consensus estimate, reversed a rate-cut narrative built…
September 4, 2026
View chart & download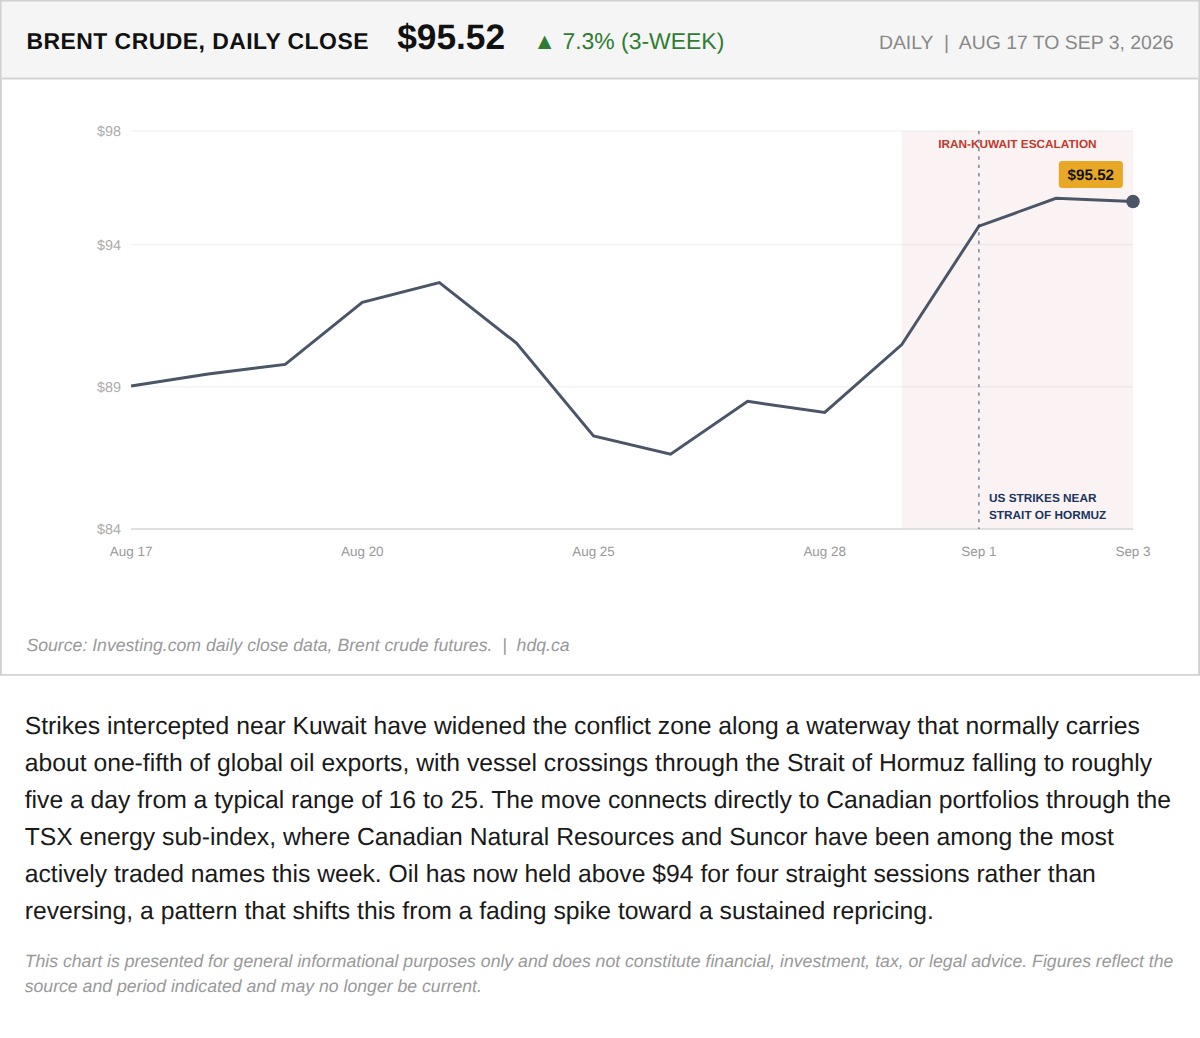
Strikes intercepted near Kuwait have widened the conflict zone along a waterway that normally carries about one-fifth of global oil…
September 4, 2026
View chart & download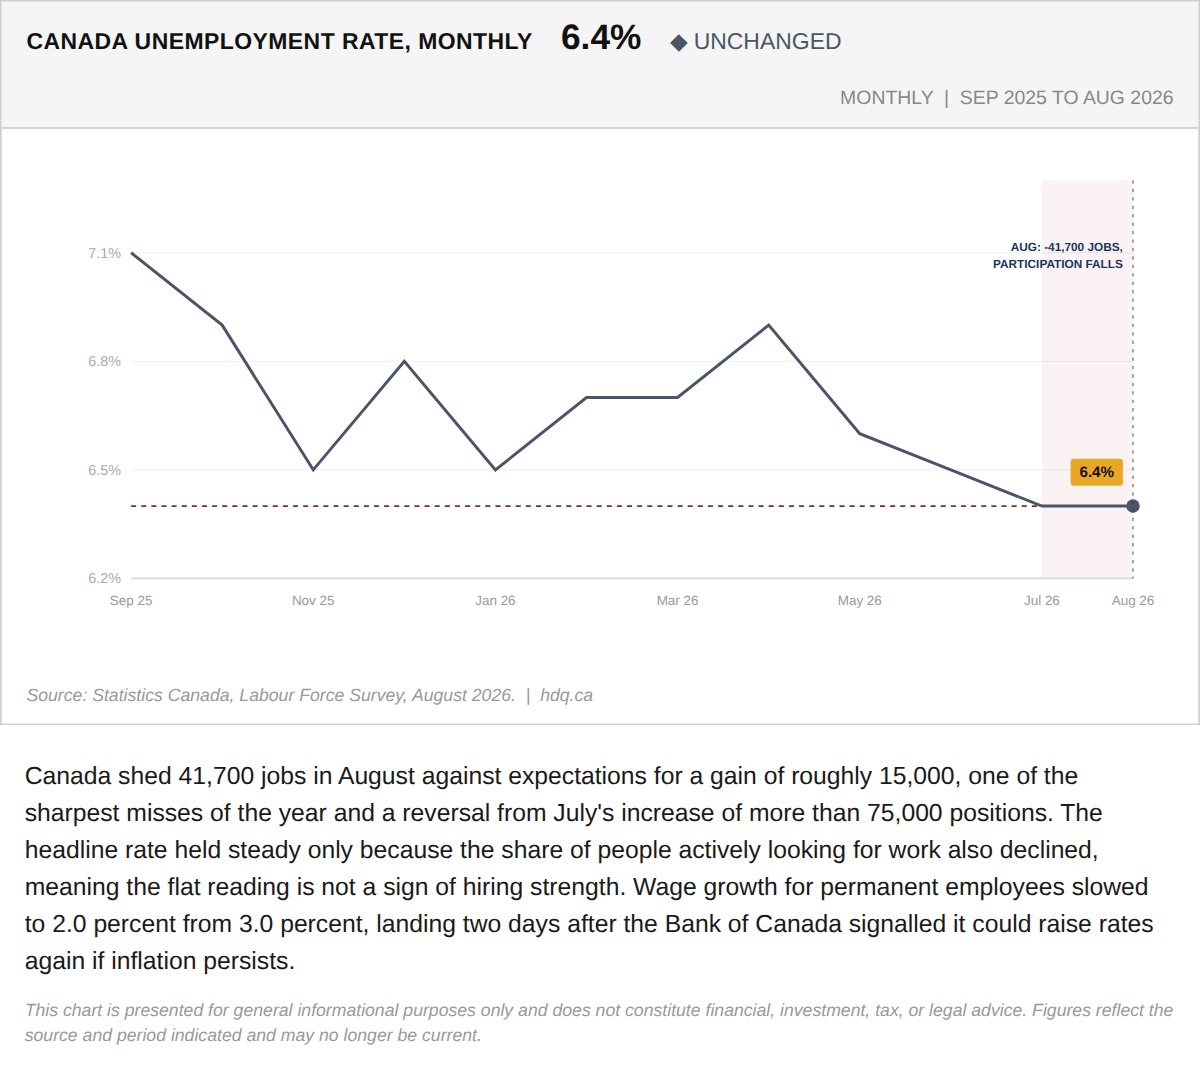
Canada shed 41,700 jobs in August against expectations for a gain of roughly 15,000, one of the sharpest misses of the year and a reversal…
Canada Lost 41,700 Jobs in August, Two Days After the Bank of Canada Signalled It Might Hike
September 4, 2026
View chart & download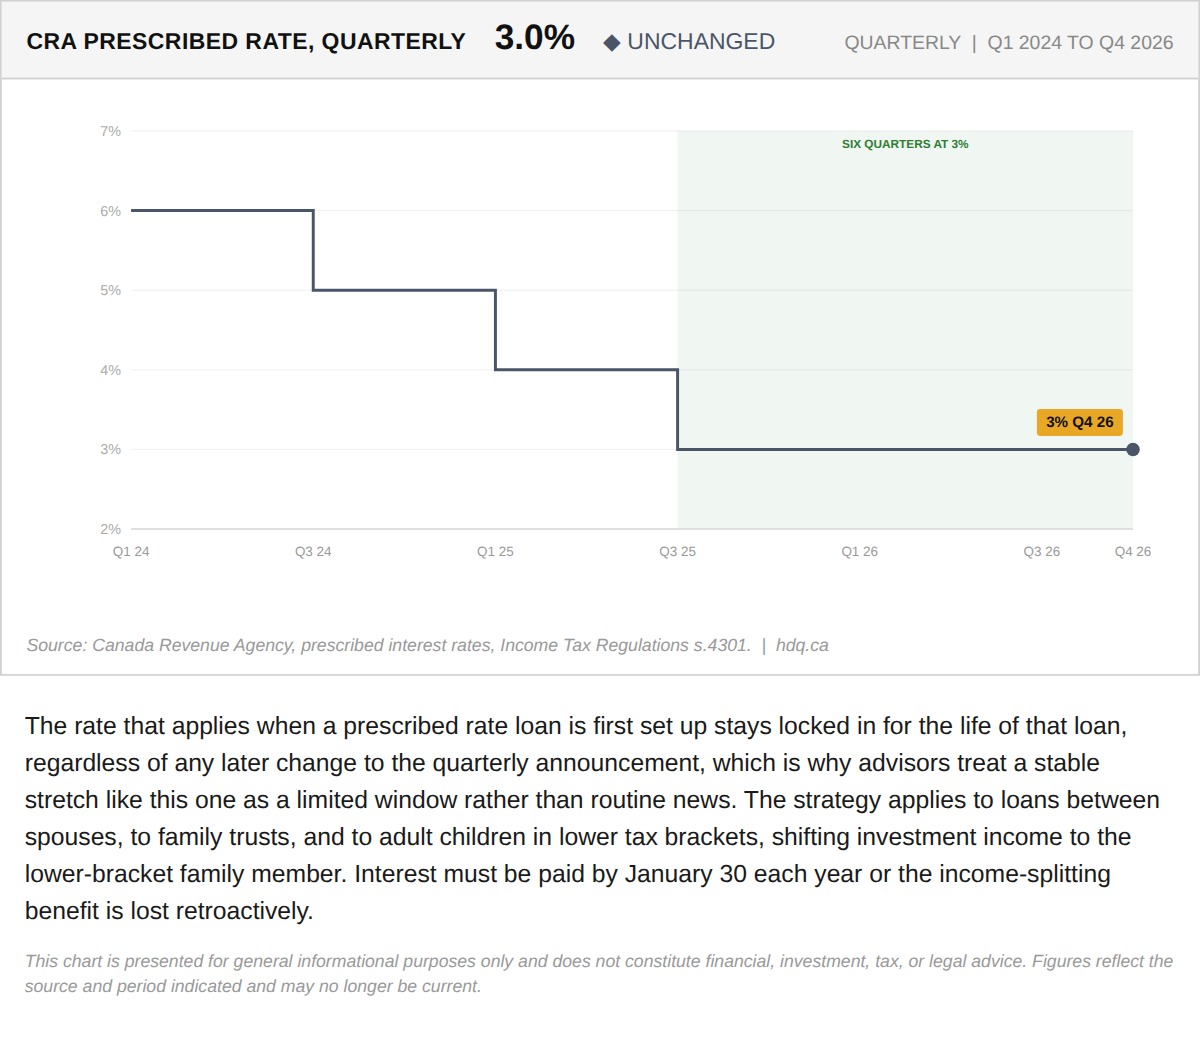
The rate that applies when a prescribed rate loan is first set up stays locked in for the life of that loan, regardless of any later change…
The Prescribed Rate Holds at 3% for a Sixth Straight Quarter, and the Window to Lock It In Is Now
September 4, 2026
View chart & download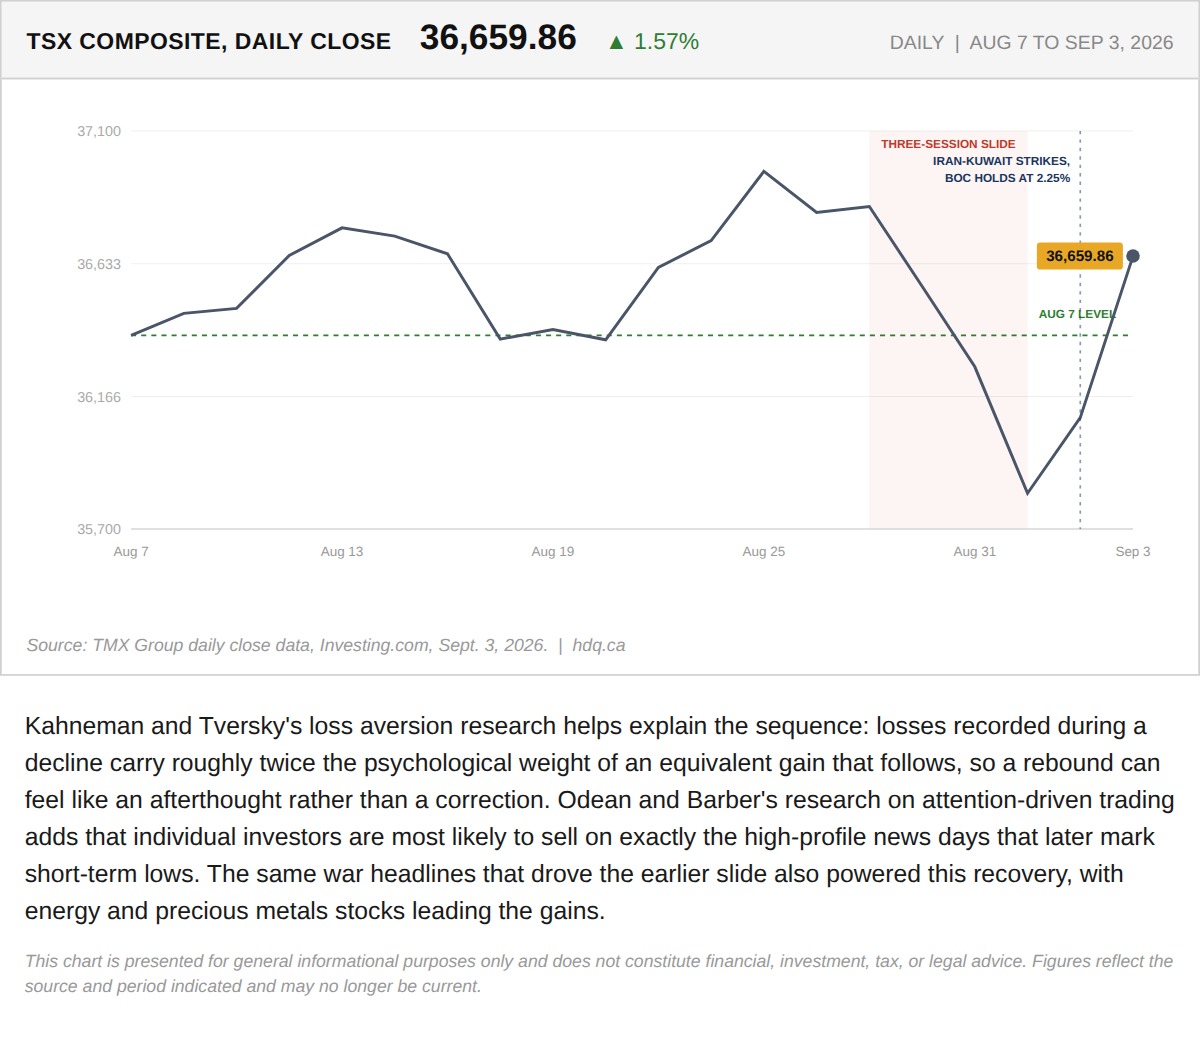
Kahneman and Tversky's loss aversion research helps explain the sequence: losses recorded during a decline carry roughly twice the…
Why the TSX's Two-Day Rebound Is the Most Dangerous Data Point on the Chart
September 4, 2026
View chart & download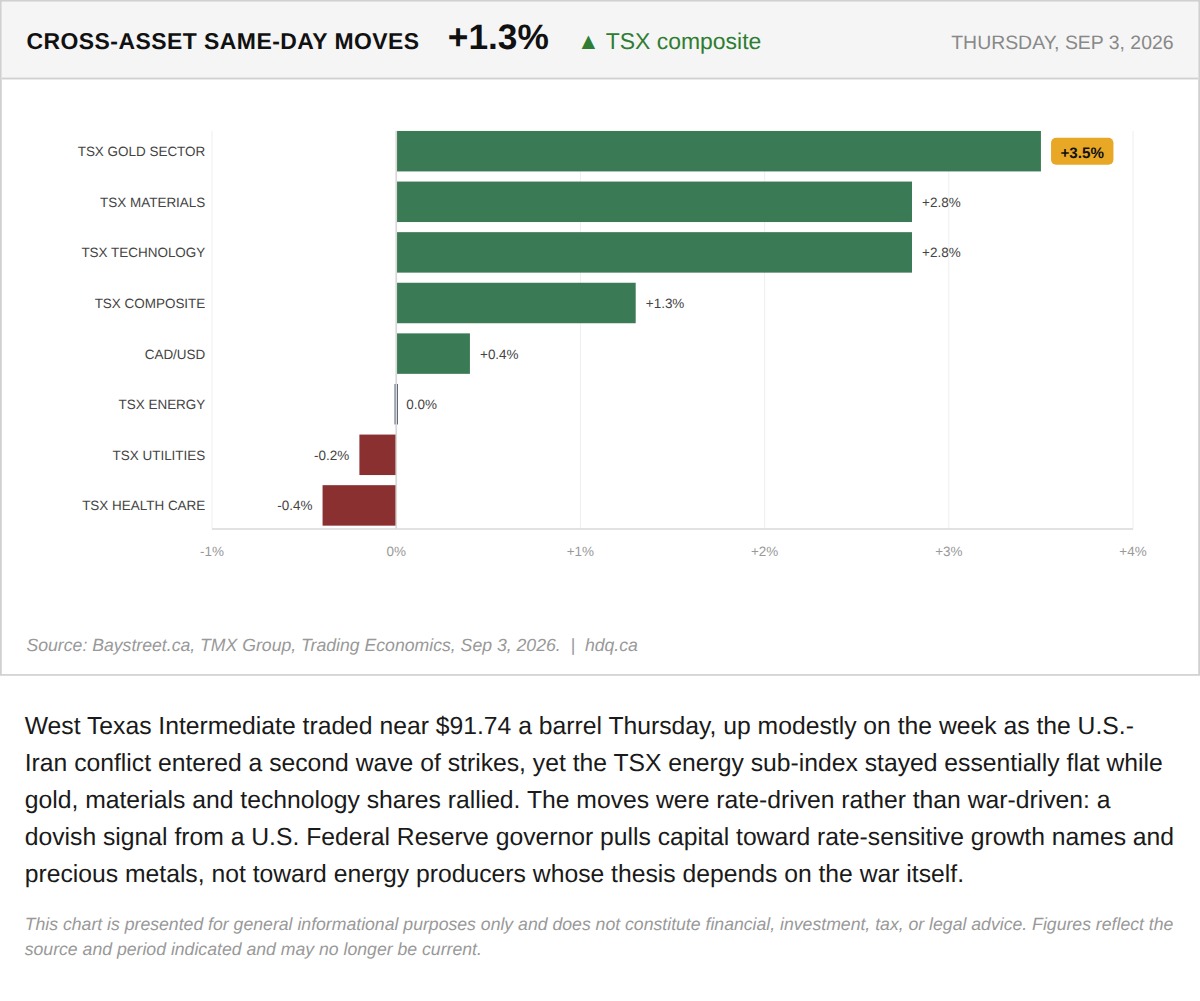
West Texas Intermediate traded near $91.74 a barrel Thursday, up modestly on the week as the U.S.-Iran conflict entered a second wave of…
Gold and Tech Led Thursday's TSX Rally While Energy Sat Out the Oil Rally
September 3, 2026
View chart & download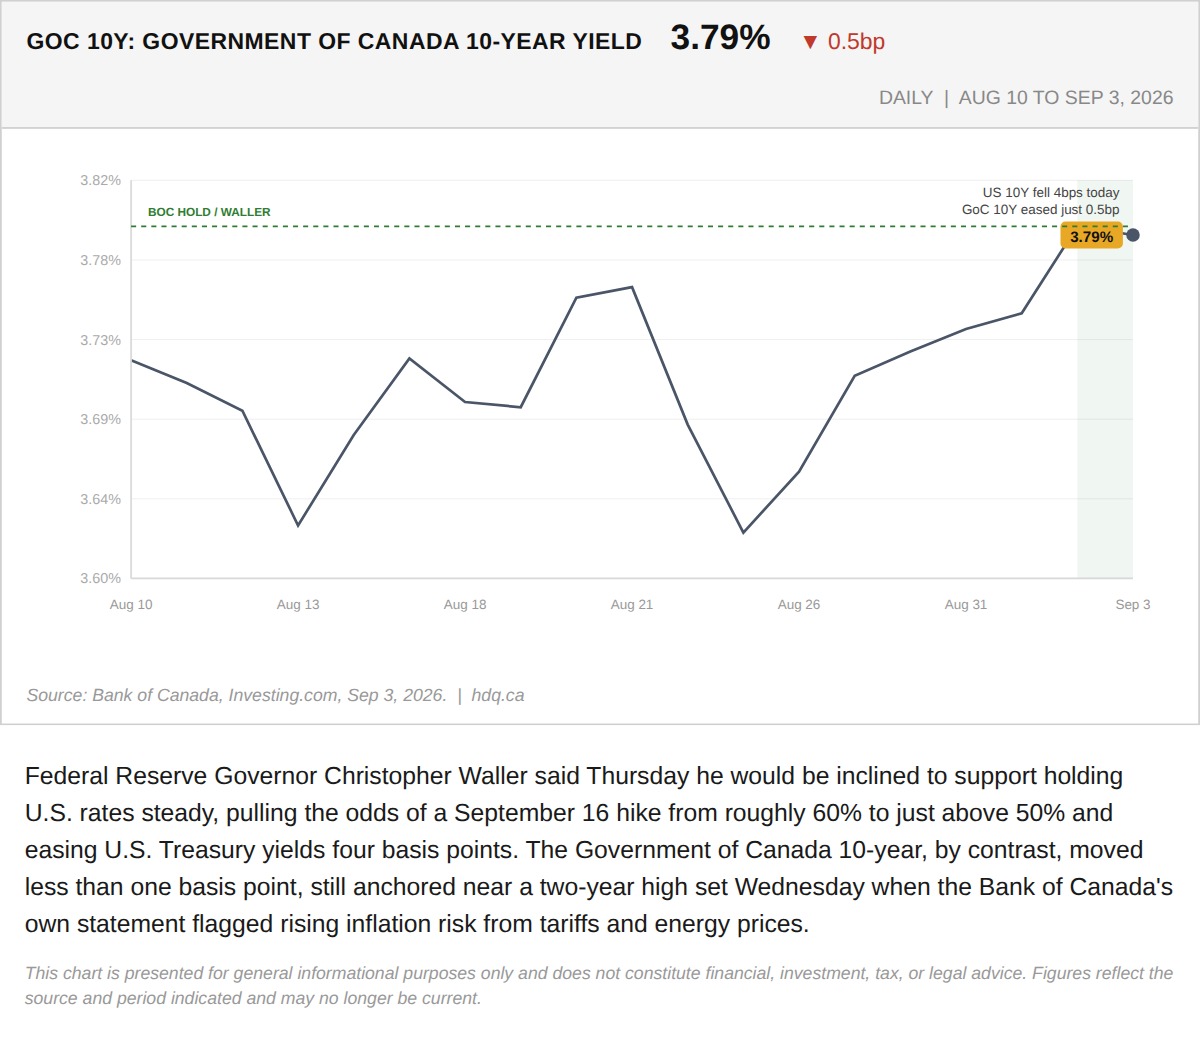
Federal Reserve Governor Christopher Waller said Thursday he would be inclined to support holding U.S.
Canada's 10-Year Bond Yield Barely Moved on the Fed's Dovish Signal
September 3, 2026
View chart & download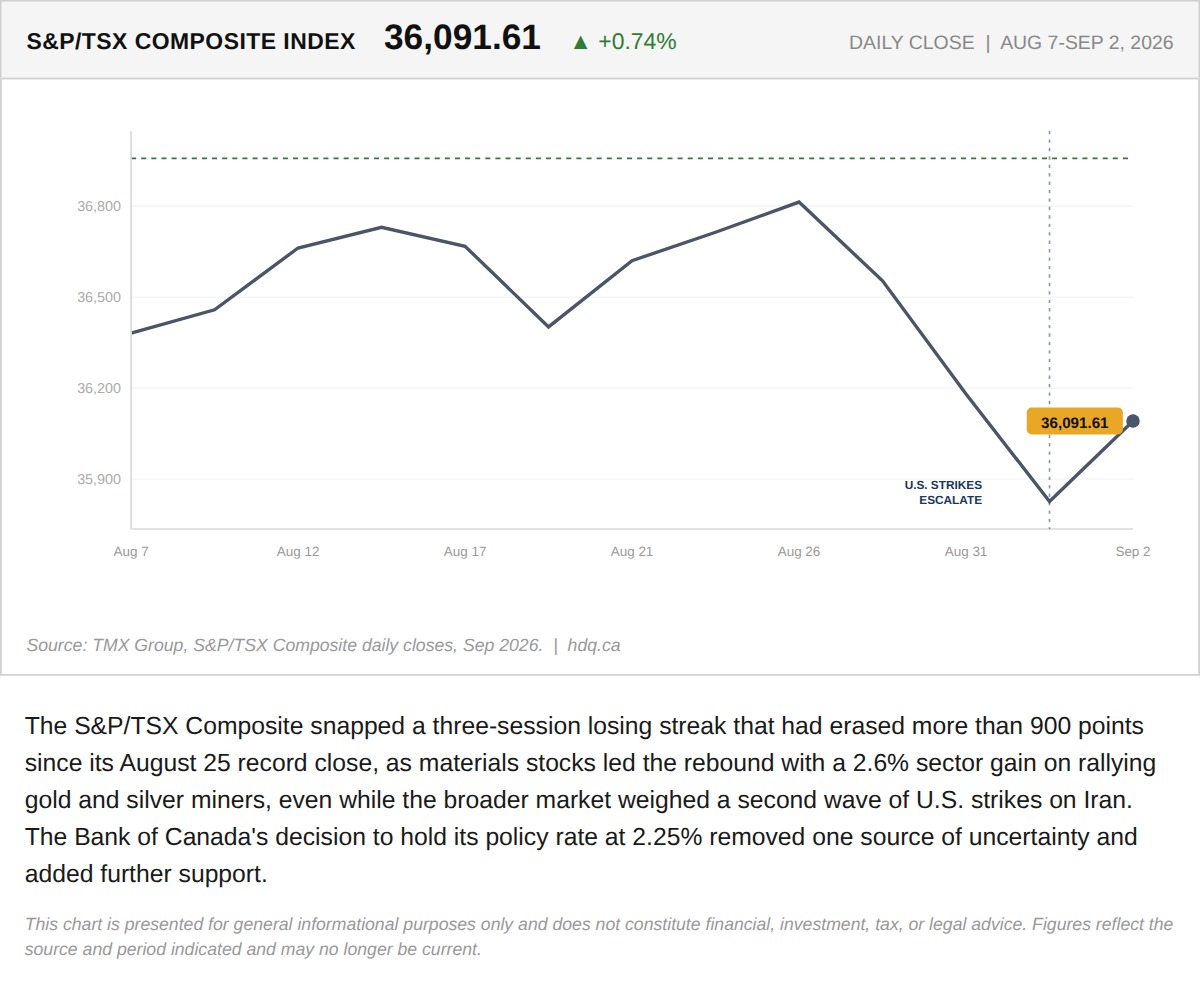
The S&P/TSX Composite snapped a three-session losing streak that had erased more than 900 points since its August 25 record close, as…
The TSX Snapped a Three-Day Slide the Same Day the Bank of Canada Held
September 3, 2026
View chart & download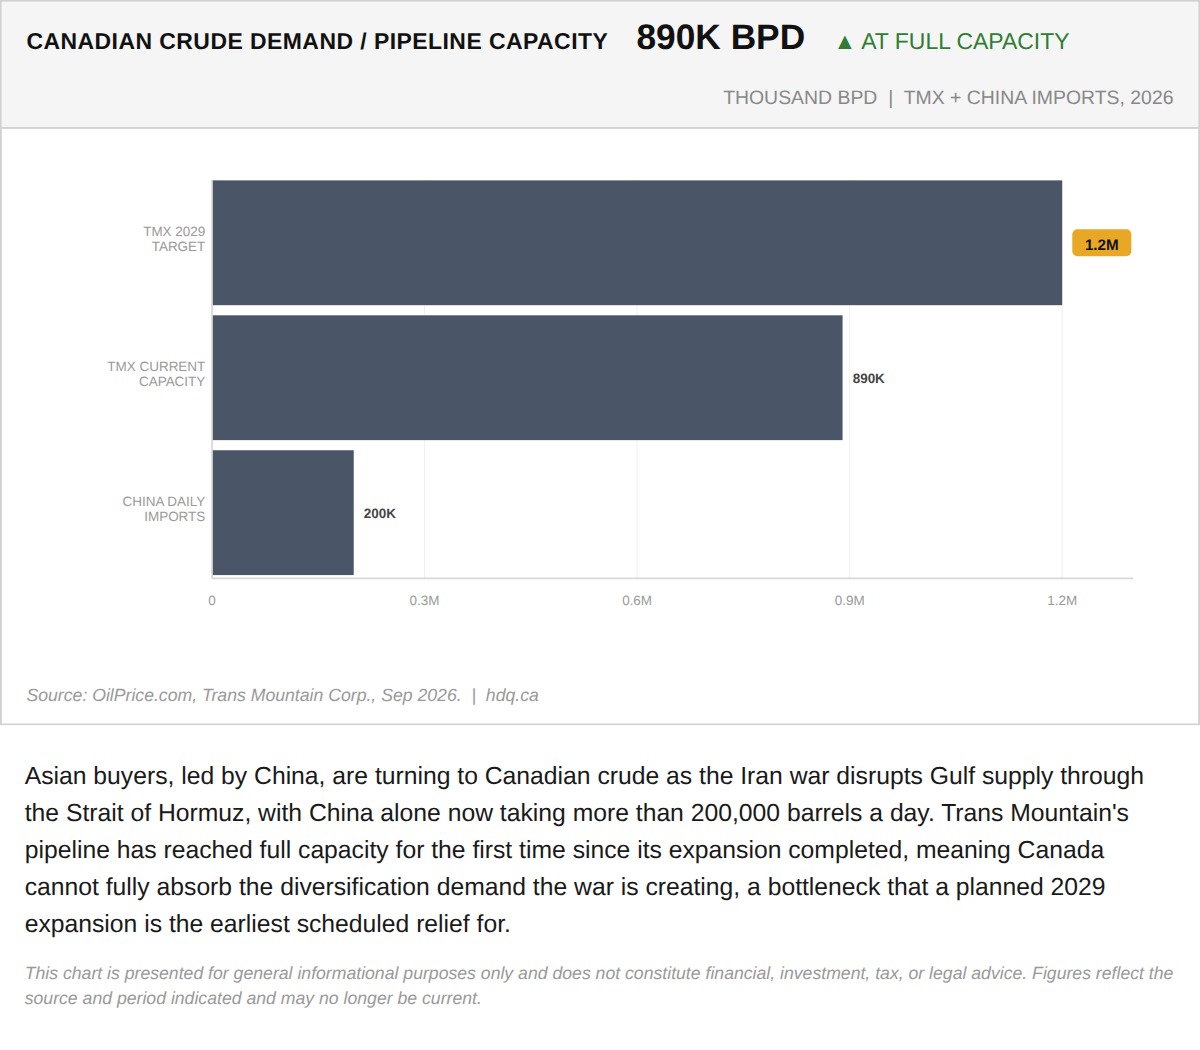
Asian buyers, led by China, are turning to Canadian crude as the Iran war disrupts Gulf supply through the Strait of Hormuz, with China…
The Iran War Is Rerouting Asian Oil Demand to Canada, But the Pipe Is Already Full
September 3, 2026
View chart & download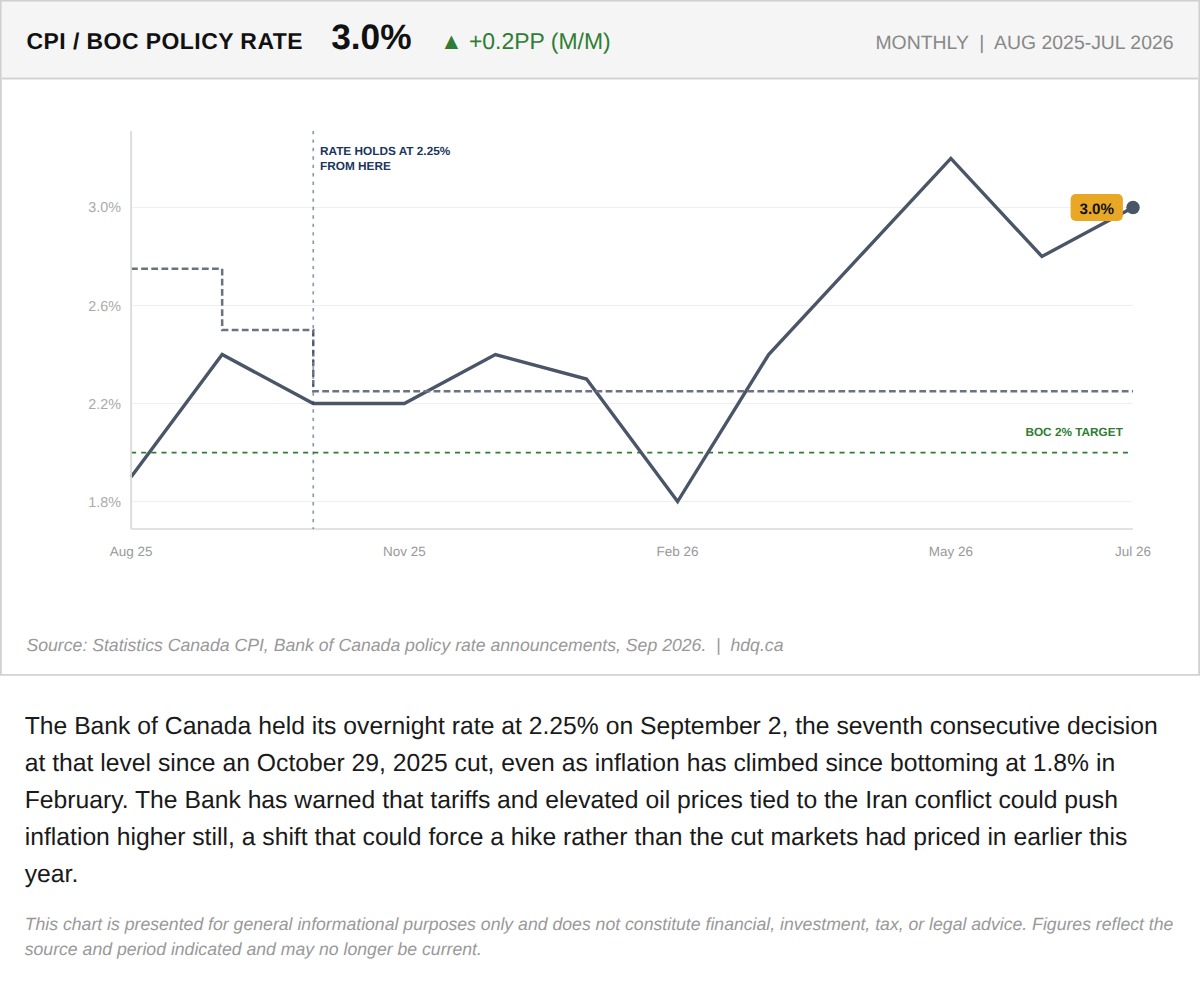
The Bank of Canada held its overnight rate at 2.25% on September 2, the seventh consecutive decision at that level since an October 29,…
The Bank of Canada Has Held Seven Times, and Its Inflation Cushion Is Nearly Gone
September 3, 2026
View chart & download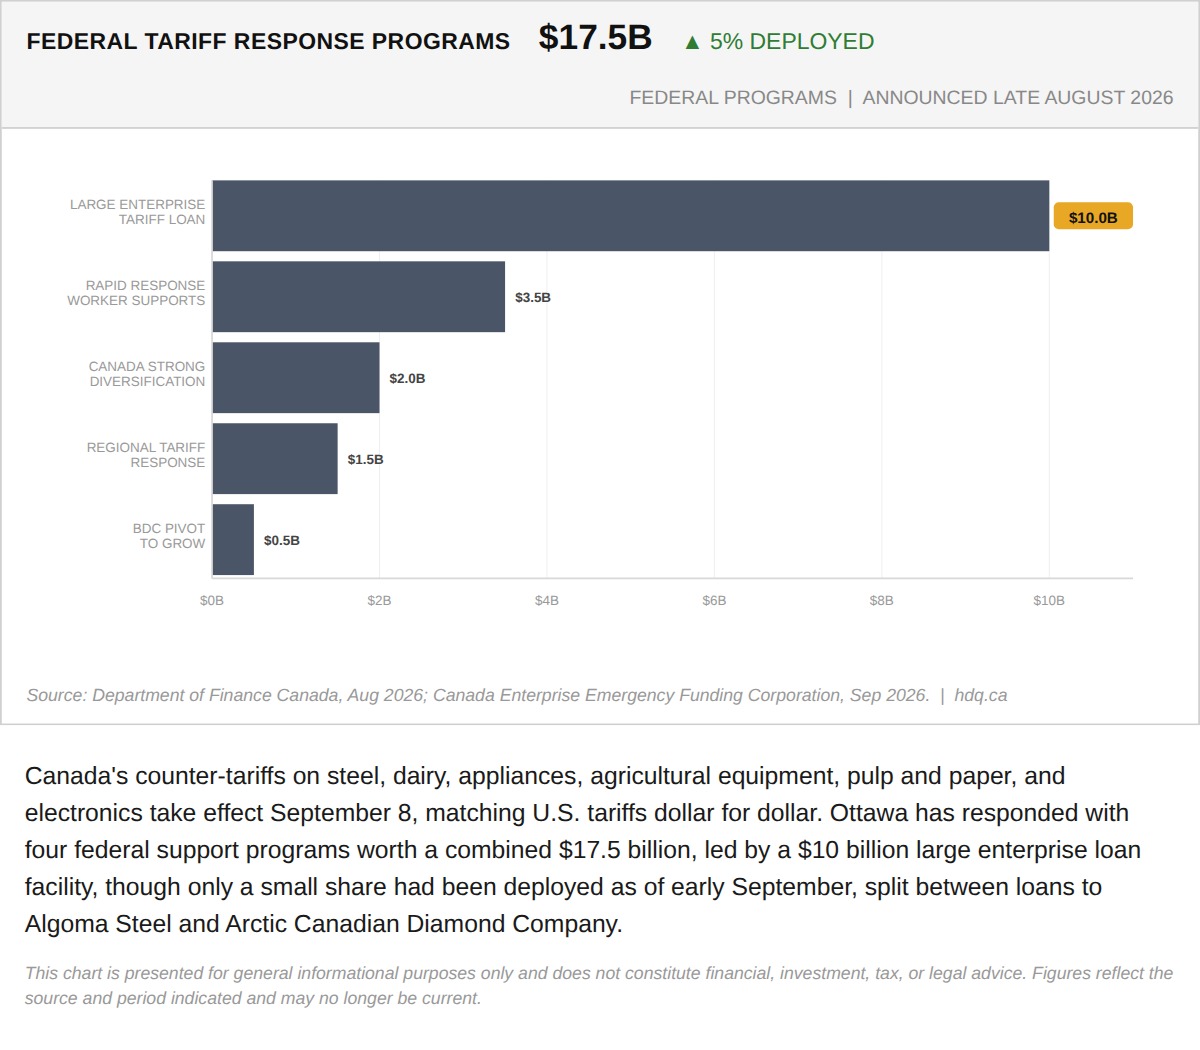
Canada's counter-tariffs on steel, dairy, appliances, agricultural equipment, pulp and paper, and electronics take effect September 8, matching U.S.
Federal Tariff Response Programs Reach $17.5 Billion in Commitments
September 3, 2026
View chart & download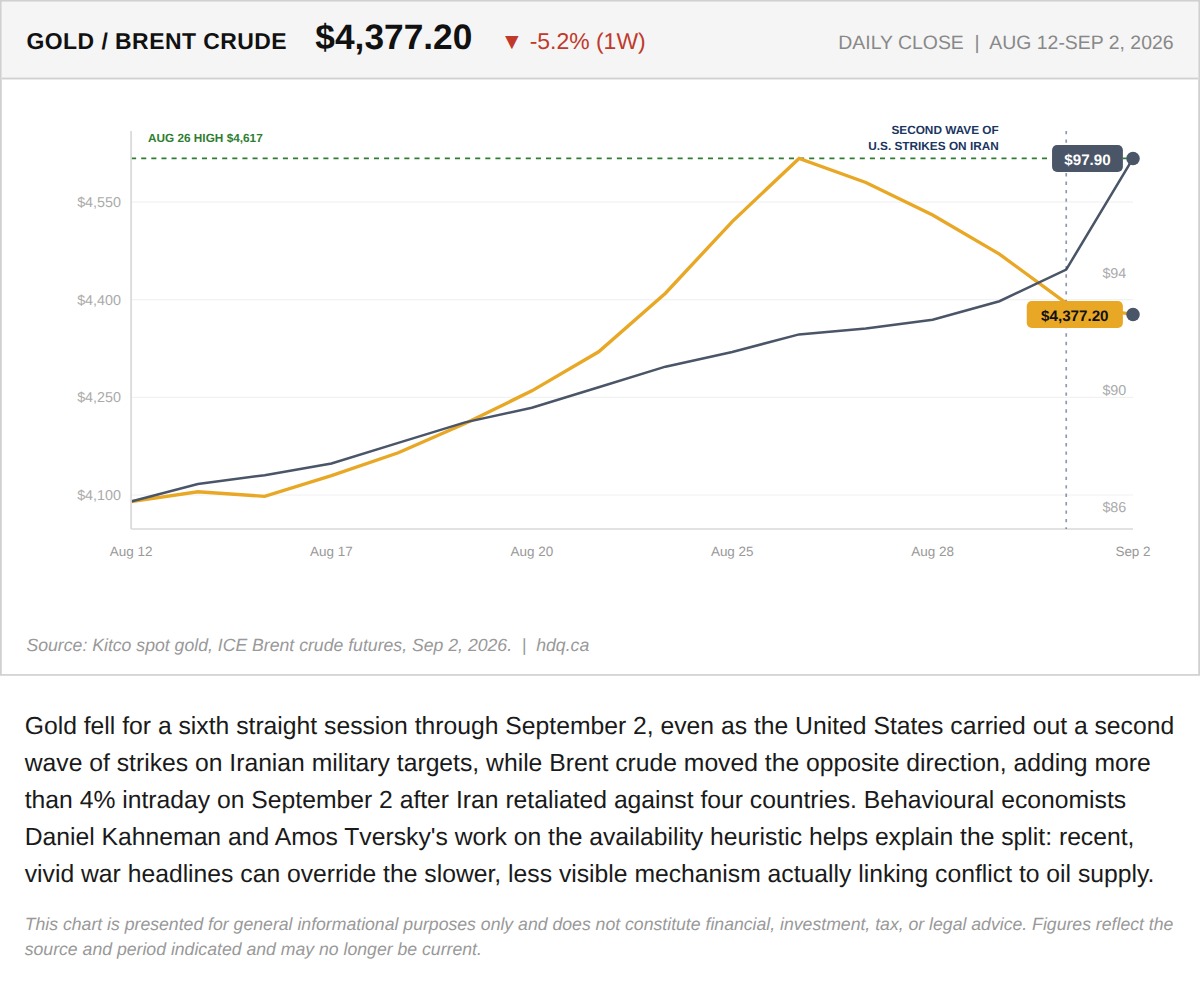
Gold fell for a sixth straight session through September 2, even as the United States carried out a second wave of strikes on Iranian…
Gold's War Premium Is Cracking as the Conflict Widens
September 3, 2026
View chart & download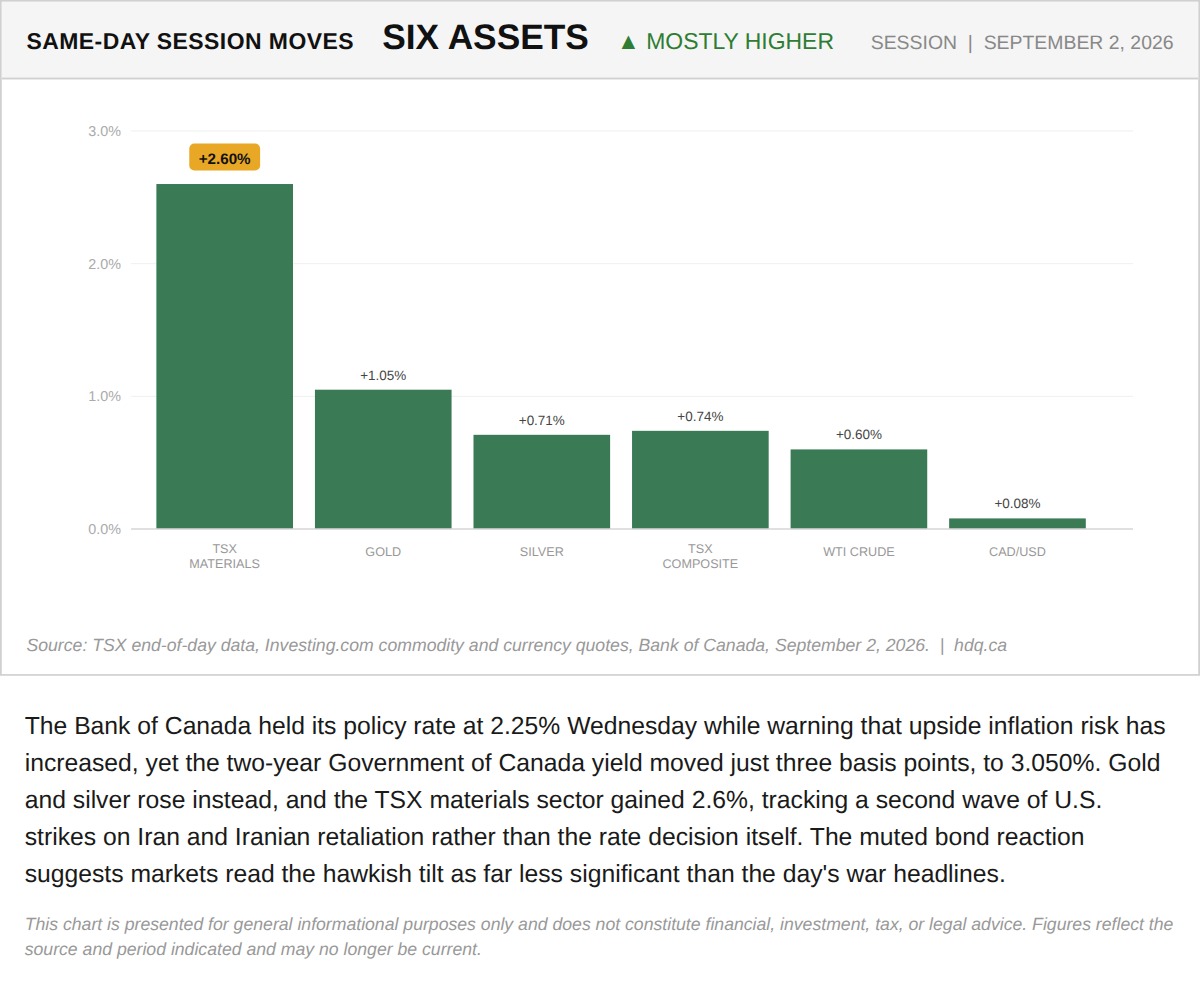
The Bank of Canada held its policy rate at 2.25% Wednesday while warning that upside inflation risk has increased, yet the two-year…
TSX Materials, Gold and Silver Lead a Broad Same-Day Rally Across Six Assets
September 2, 2026
View chart & download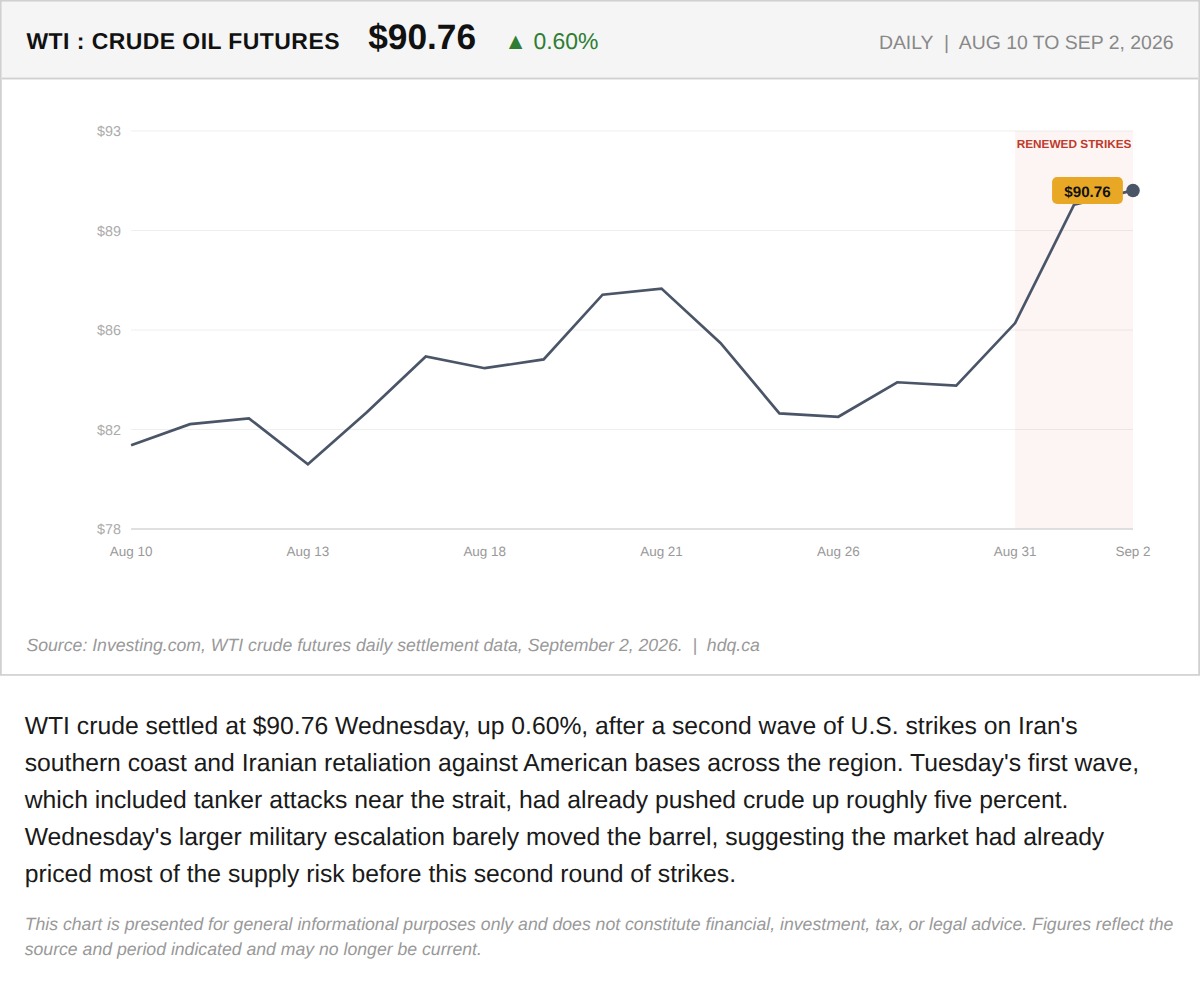
WTI crude settled at $90.76 Wednesday, up 0.60%, after a second wave of U.S.
WTI Crude Adds 0.60% as a Second Wave of Strikes Near Iran Barely Moves the Barrel
September 2, 2026
View chart & download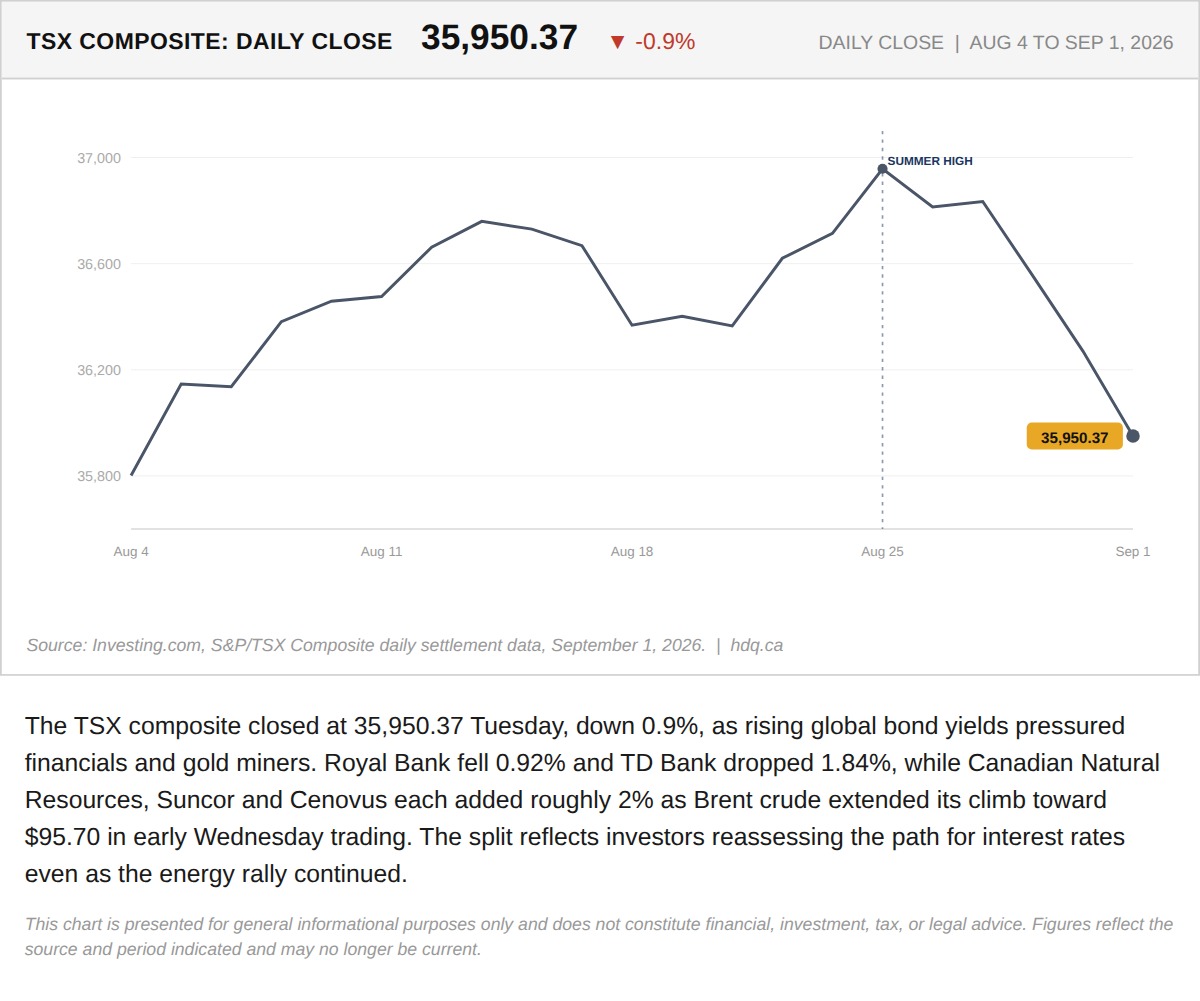
The TSX composite closed at 35,950.37 Tuesday, down 0.9%, as rising global bond yields pressured financials and gold miners.
TSX Composite Falls 0.9% as Energy Rallies and Financials Retreat
September 2, 2026
View chart & download