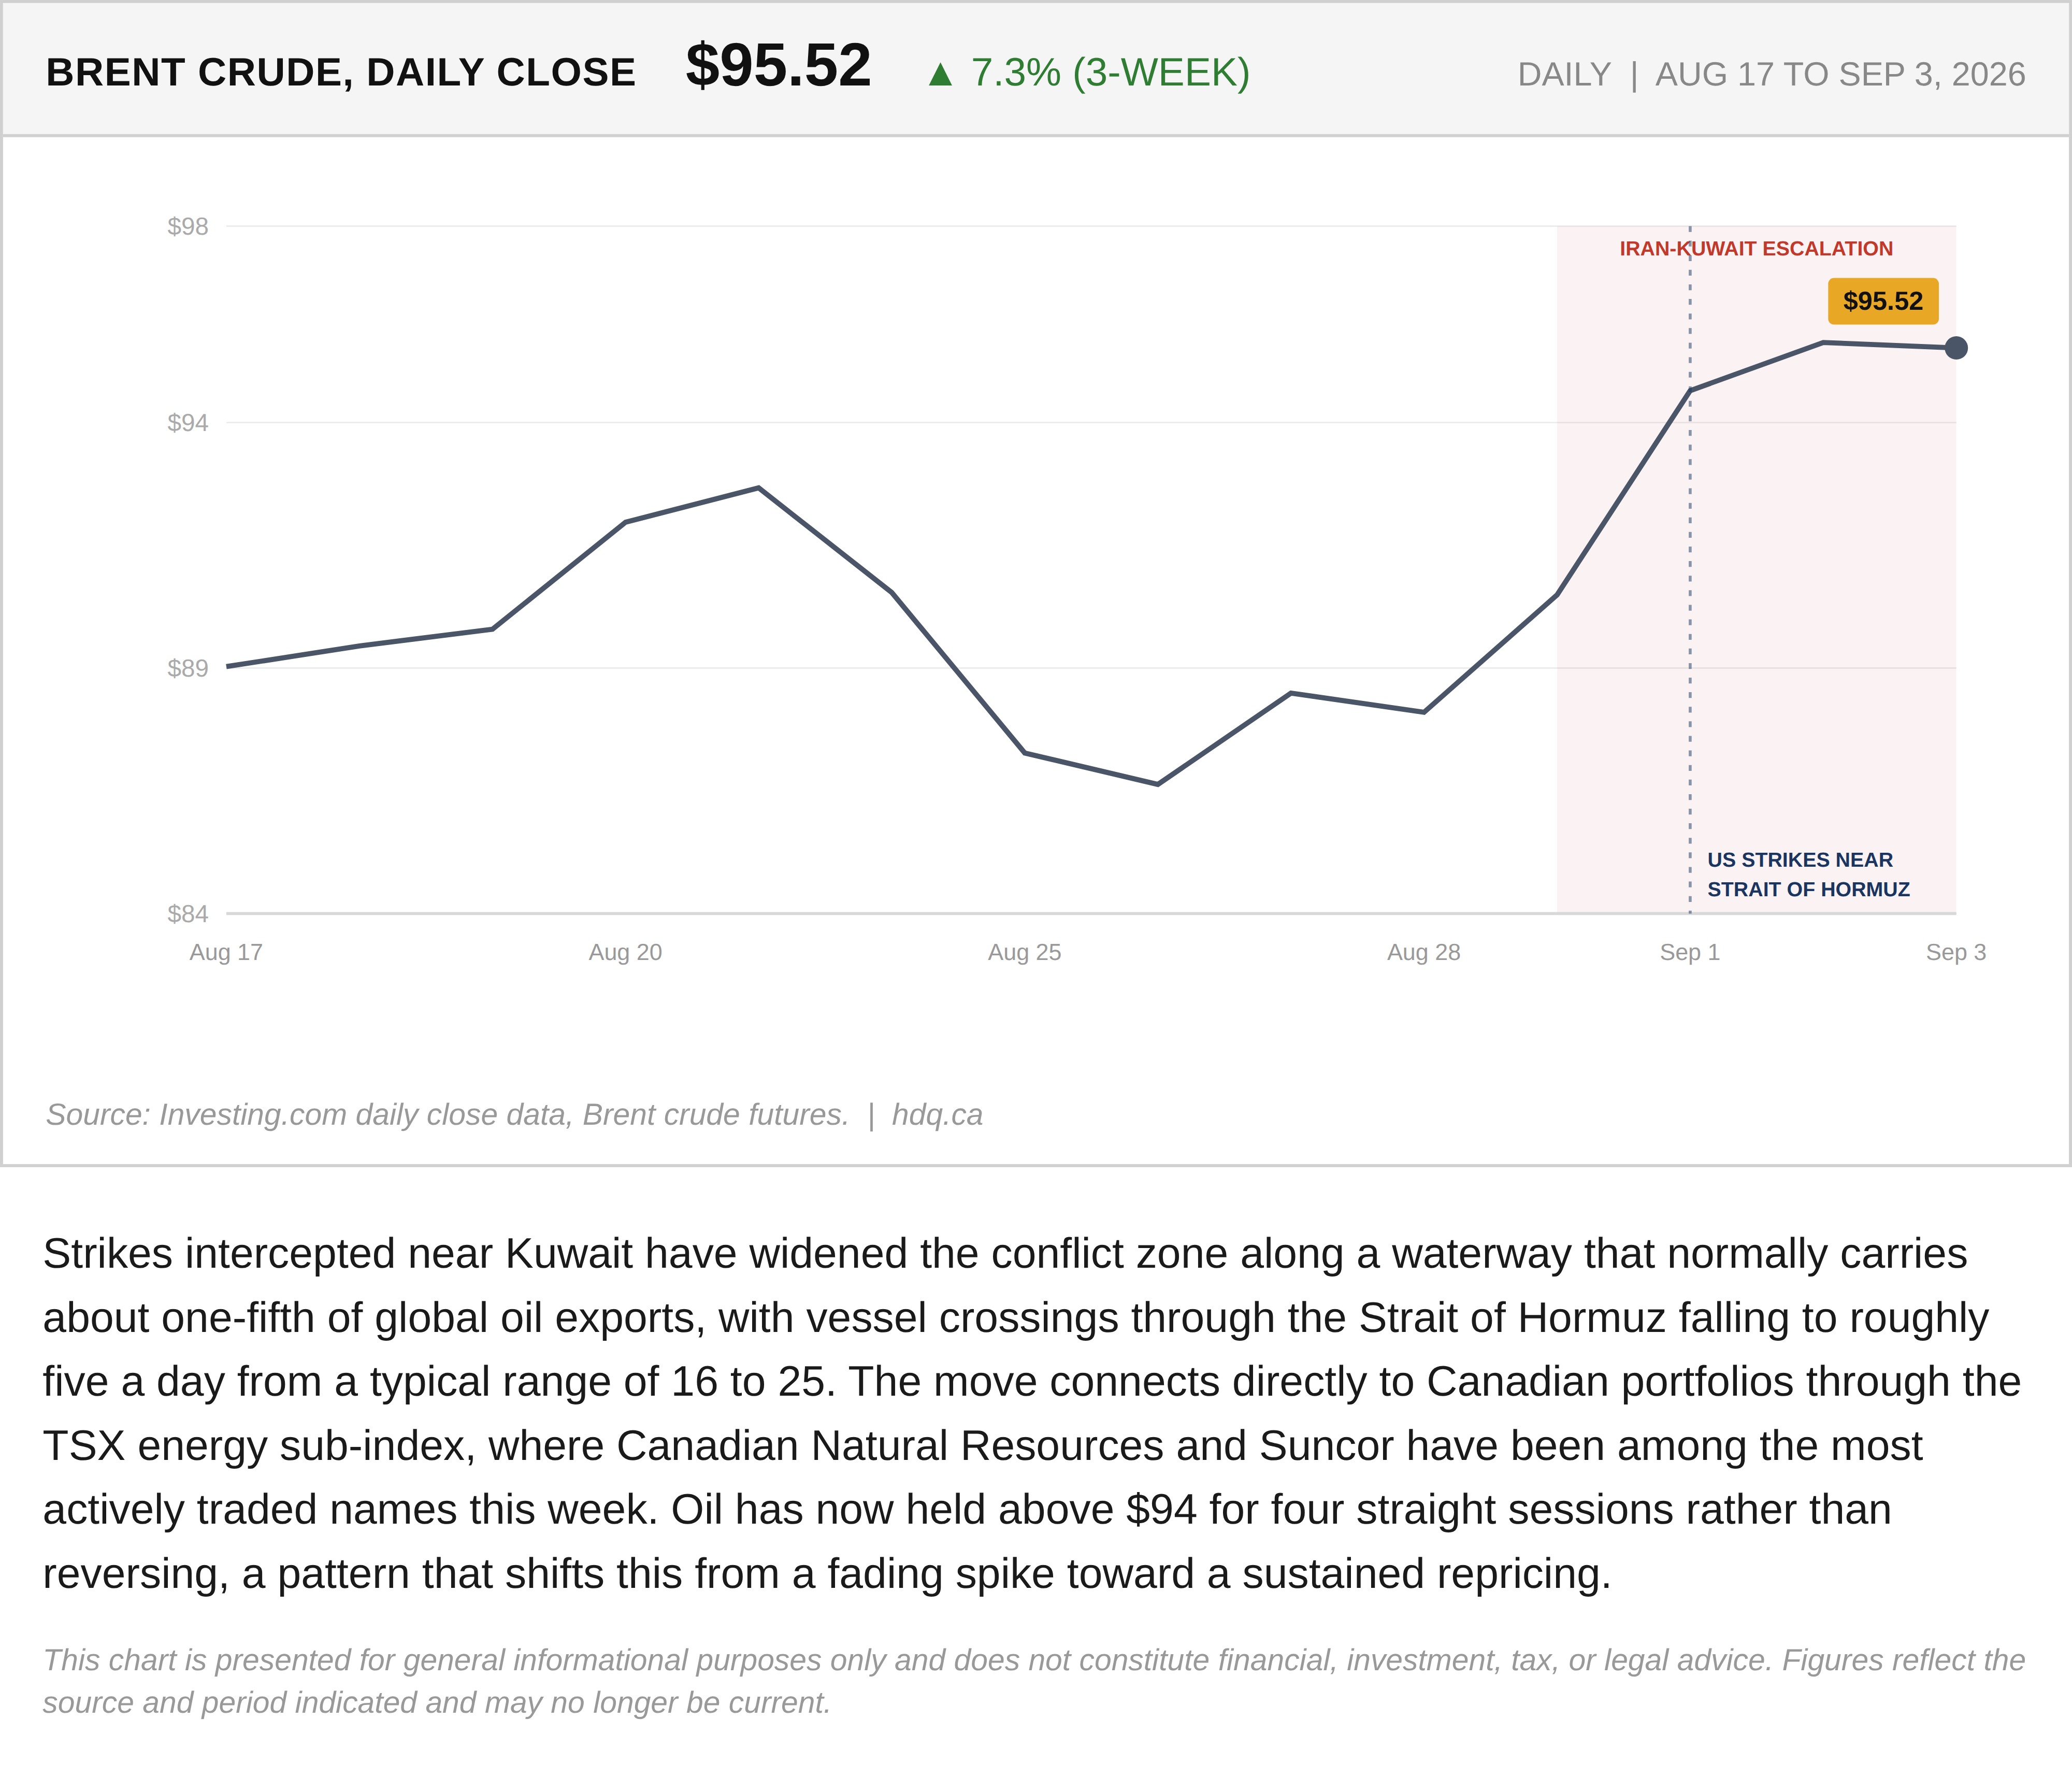
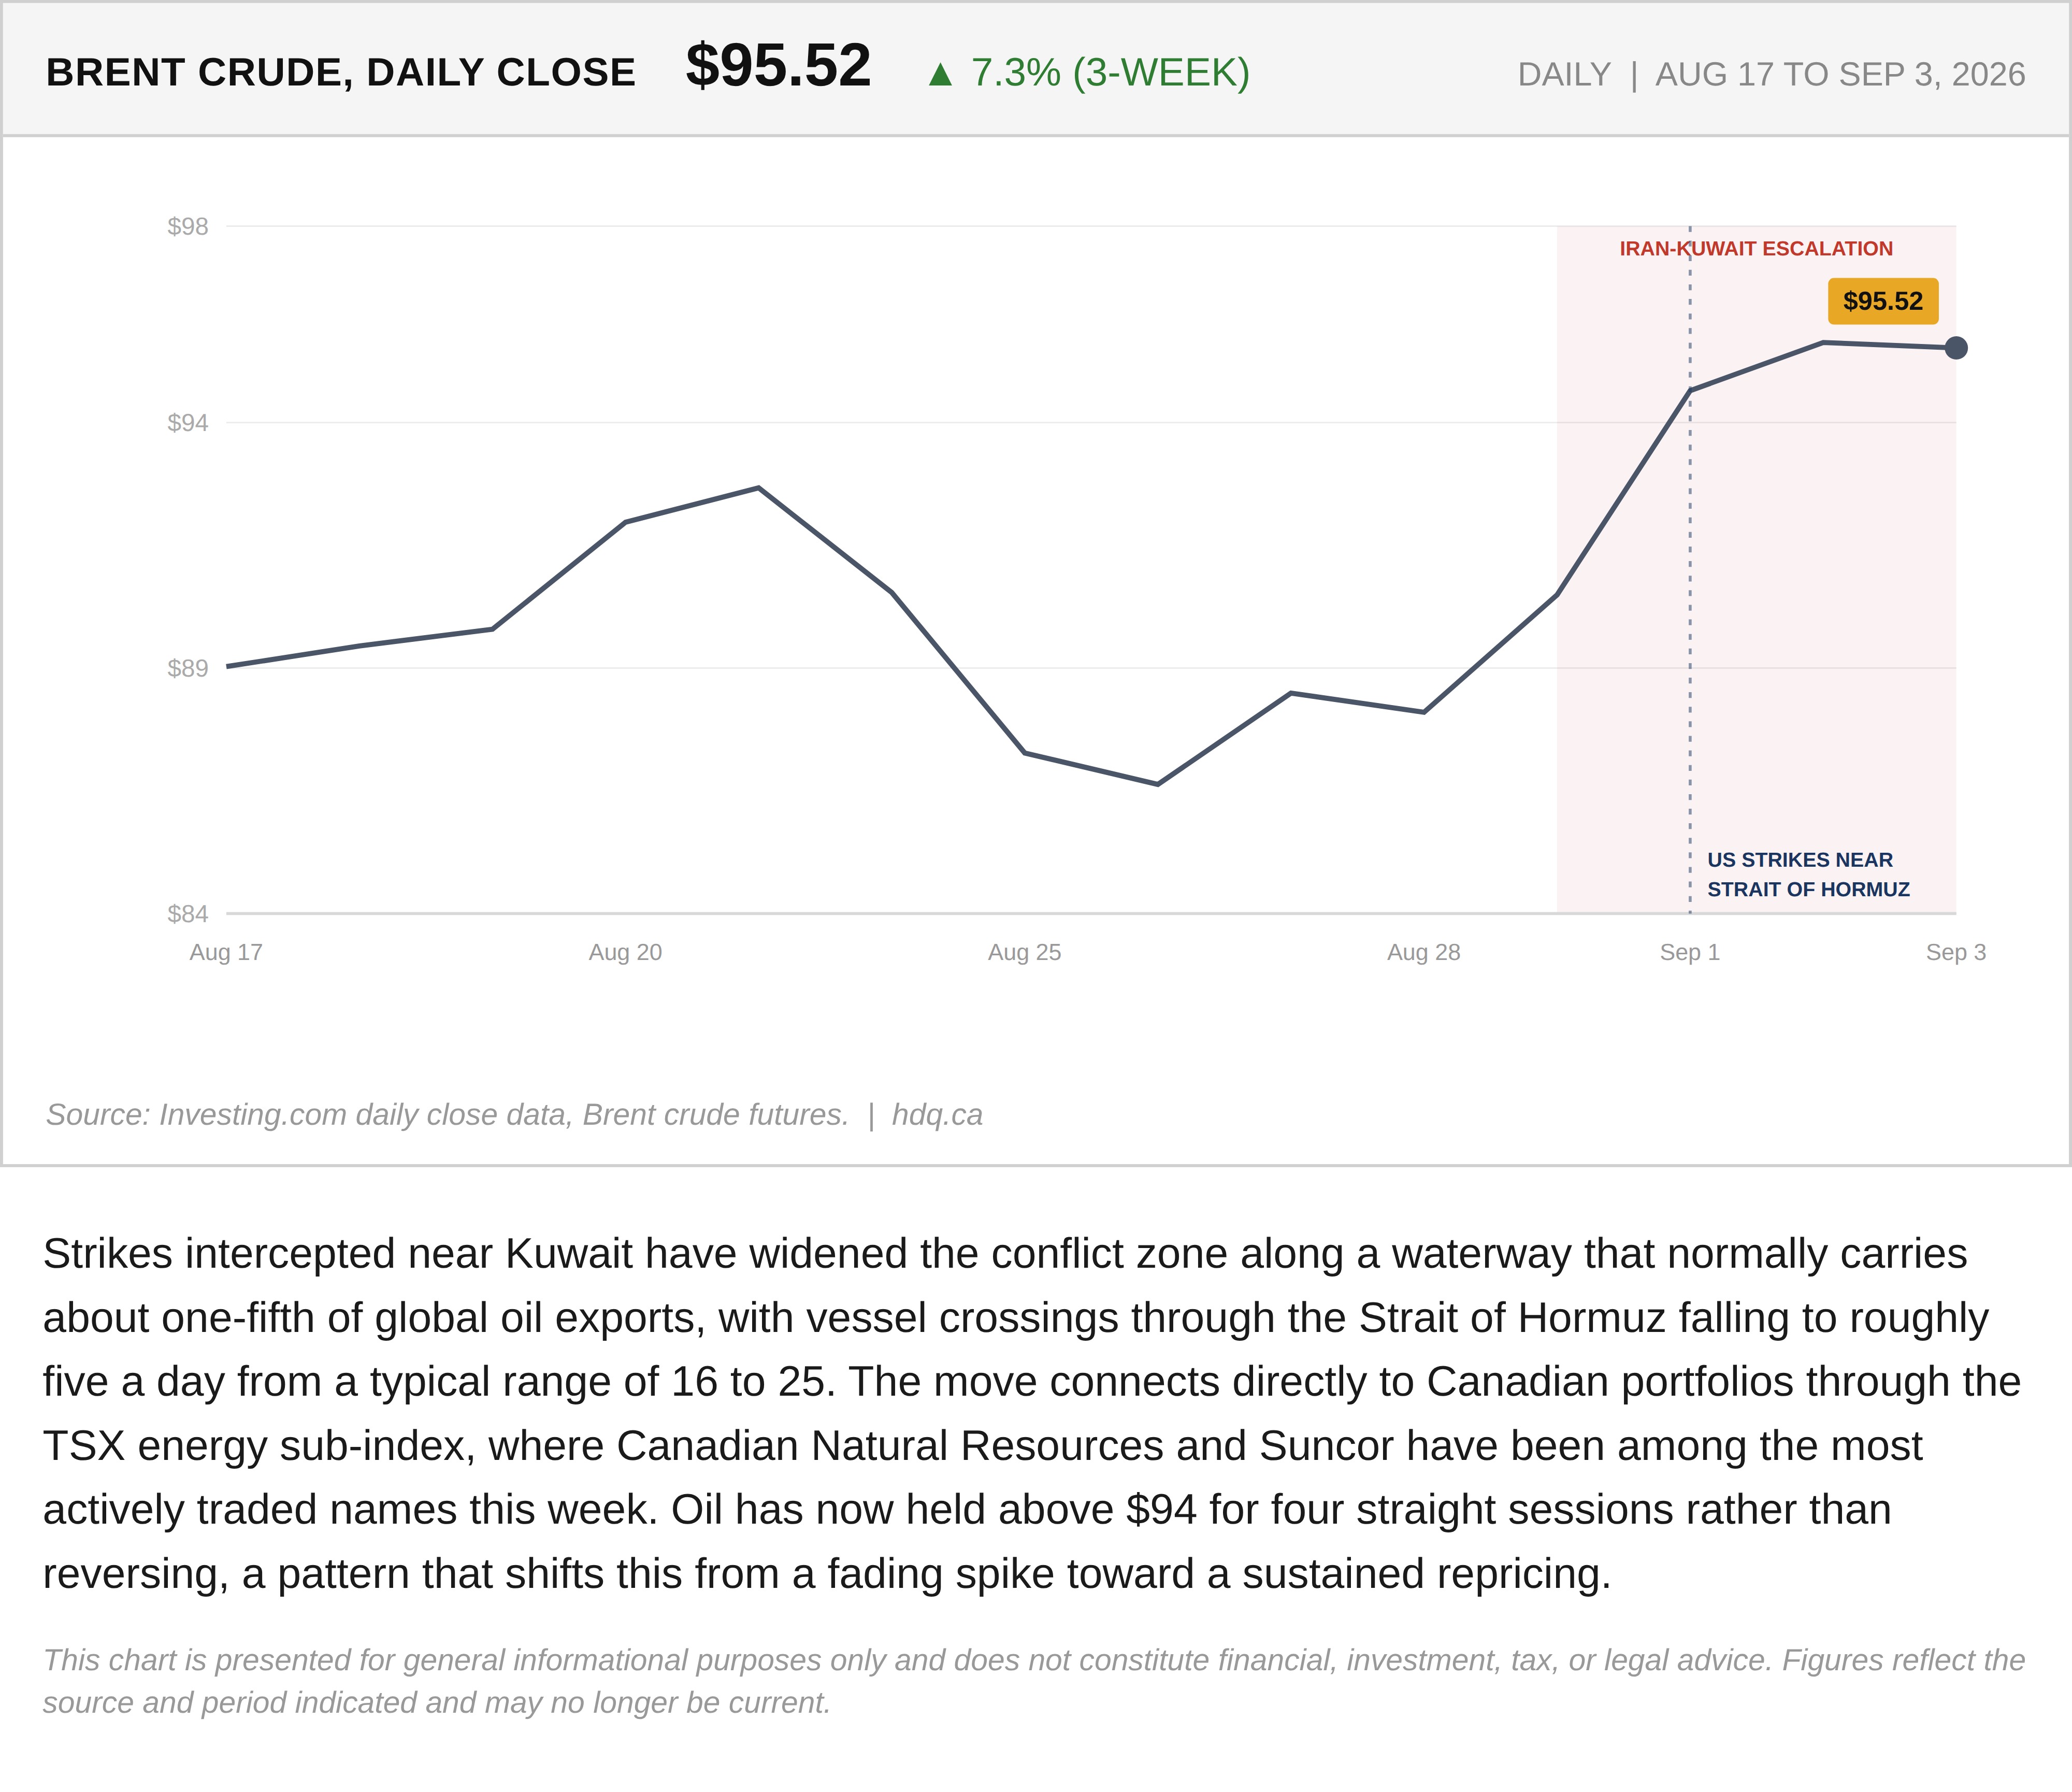
Strikes intercepted near Kuwait have widened the conflict zone along a waterway that normally carries about one-fifth of global oil exports, with vessel crossings through the Strait of Hormuz falling to roughly five a day from a typical range of 16 to 25. The move connects directly to Canadian portfolios through the TSX energy sub-index, where Canadian Natural Resources and Suncor have been among the most actively traded names this week. Oil has now held above $94 for four straight sessions rather than reversing, a pattern that shifts this from a fading spike toward a sustained repricing.
This chart is presented for general informational purposes only and does not constitute financial, investment, tax, or legal advice. Figures reflect the source and period indicated and may no longer be current.
Related charts
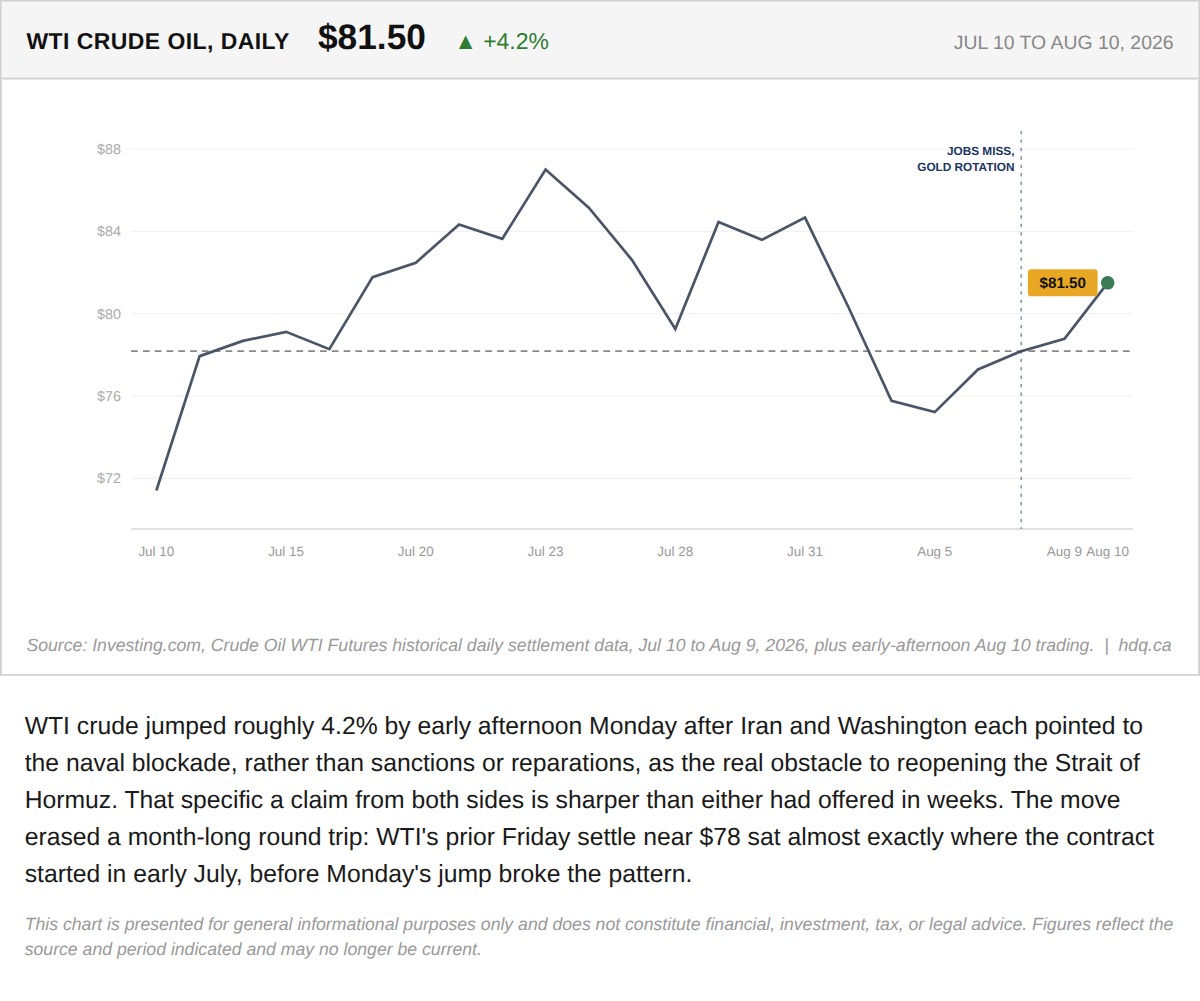
WTI crude jumped roughly 4.2% by early afternoon Monday after Iran and Washington each pointed to the naval blockade, rather than sanctions…
WTI Crude Oil Jumps as Hormuz Naval Blockade Named the Real Sticking Point
August 10, 2026
View chart & download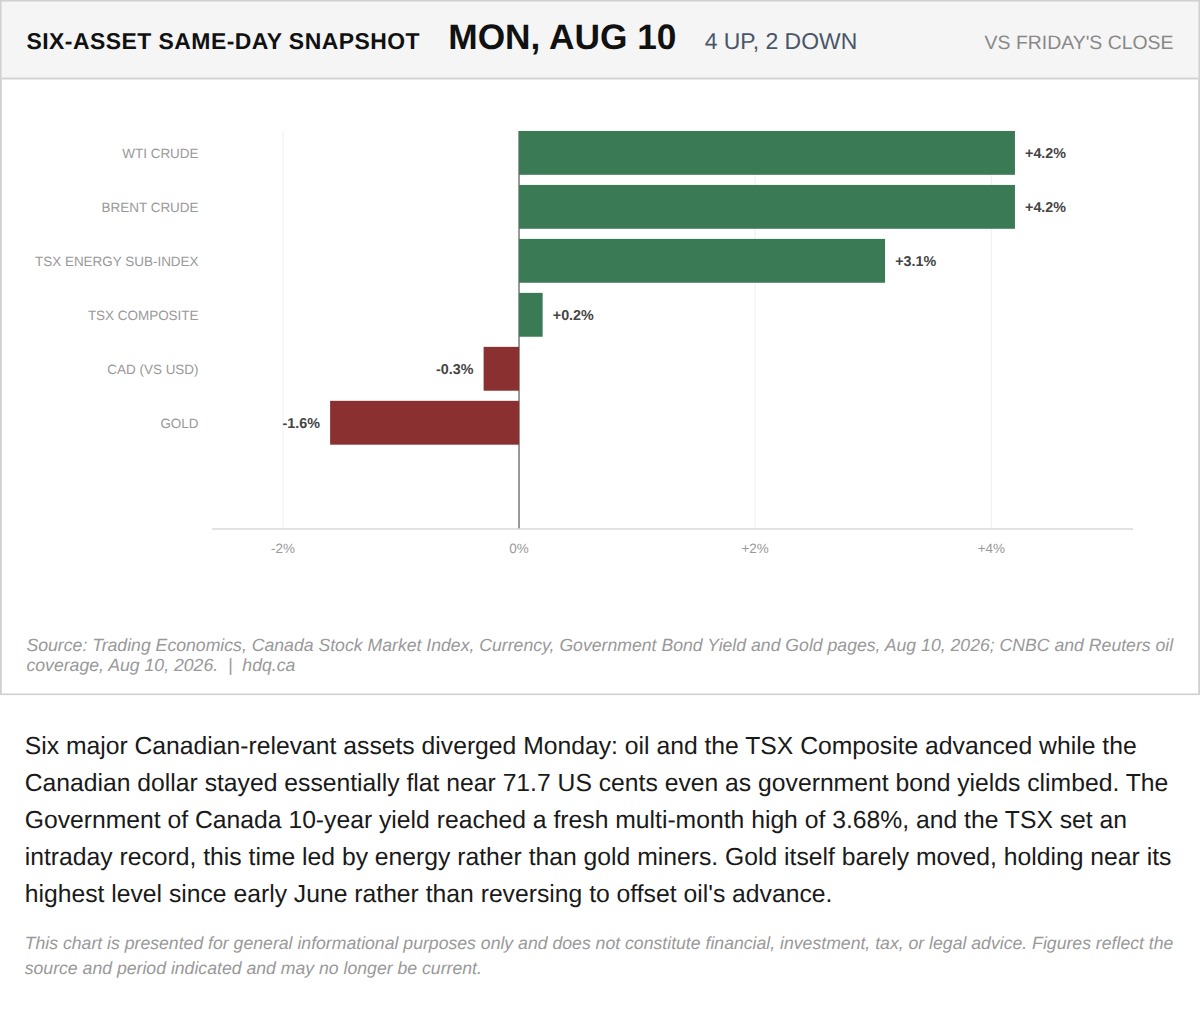
Six major Canadian-relevant assets diverged Monday: oil and the TSX Composite advanced while the Canadian dollar stayed essentially flat…
Six Assets, One Session: Oil and the TSX Rally While the Loonie and Gold Stay Flat
August 10, 2026
View chart & download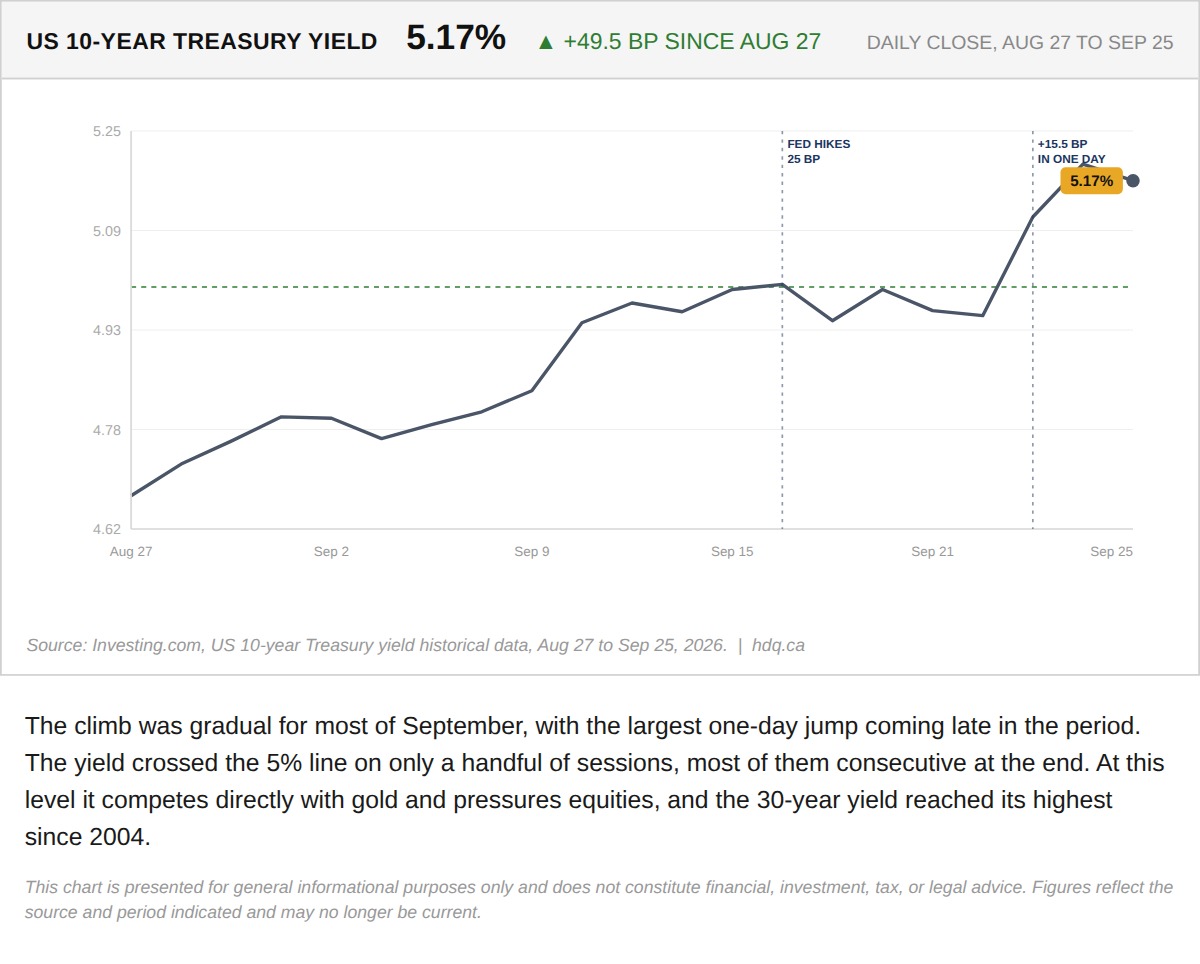
The climb was gradual for most of September, with the largest one-day jump coming late in the period.
US 10-Year Treasury Yield Rises Steadily Through September
September 28, 2026
View chart & download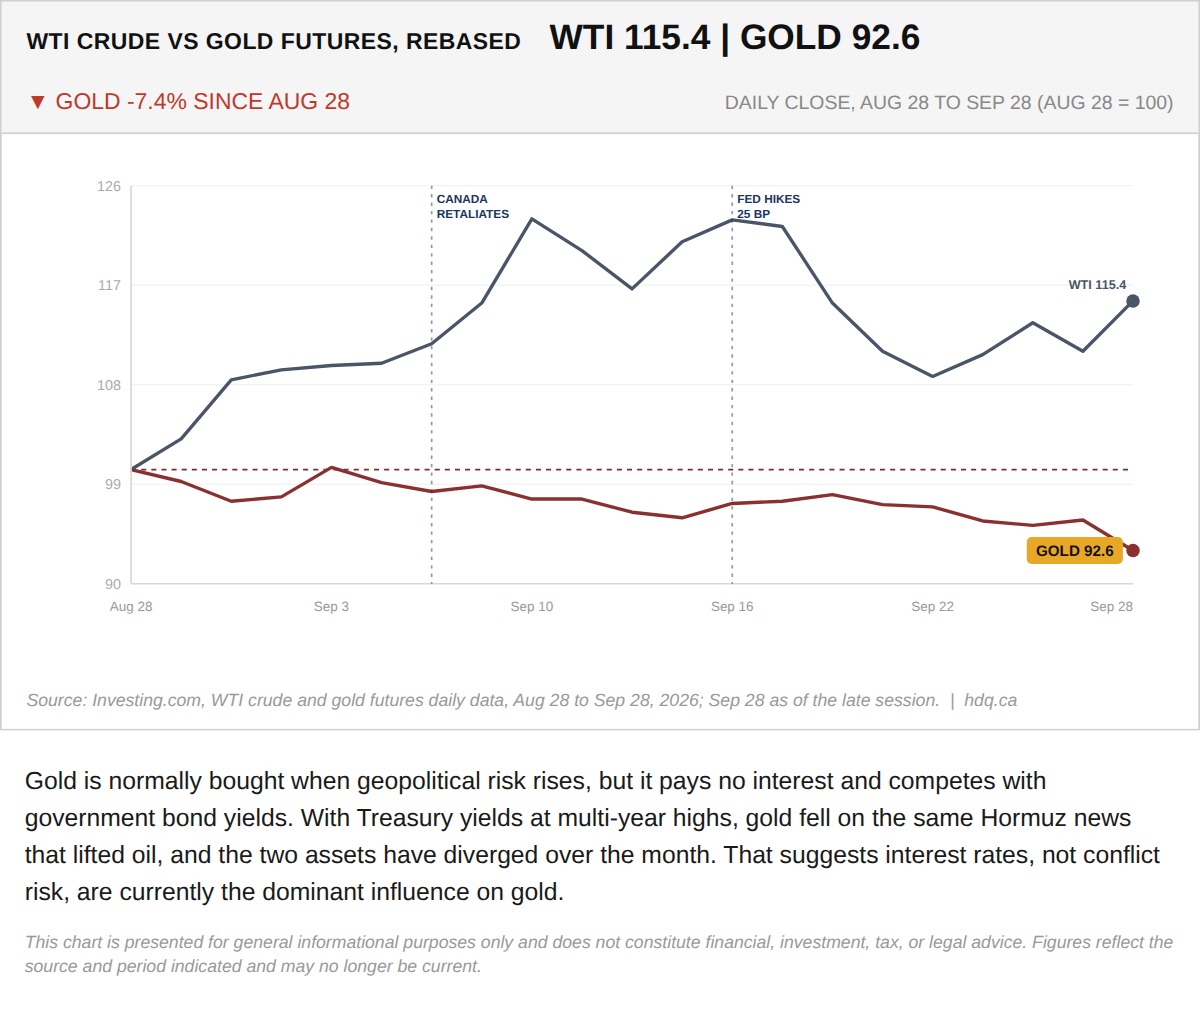
Gold is normally bought when geopolitical risk rises, but it pays no interest and competes with government bond yields.
Gold Falls While Oil Rises as Hormuz Talks Stall
September 28, 2026
View chart & download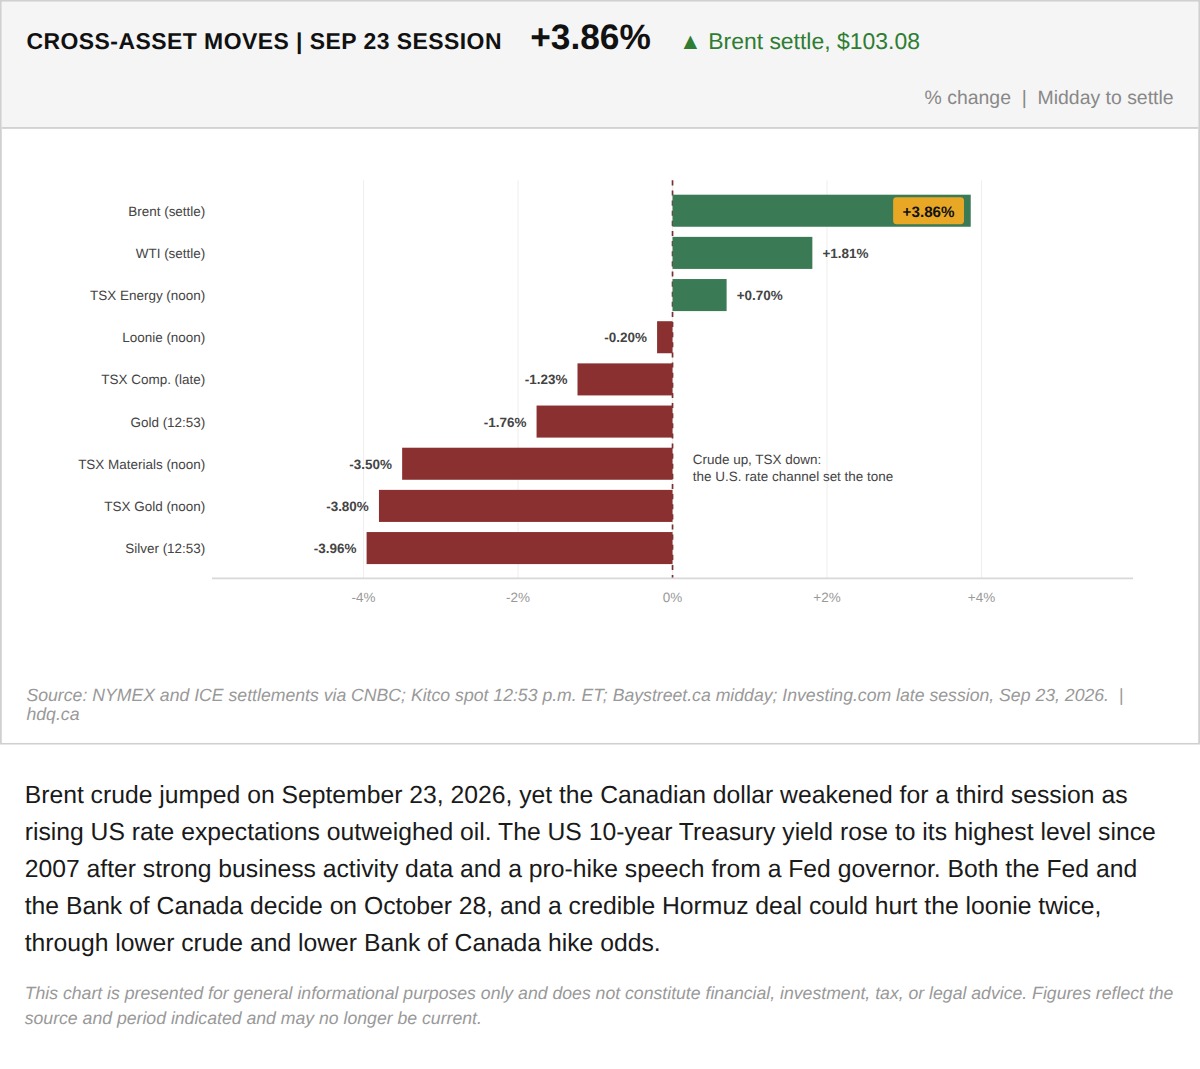
Brent crude jumped on September 23, 2026, yet the Canadian dollar weakened for a third session as rising US rate expectations outweighed oil.
Brent Jumps While the Canadian Dollar and TSX Fall in the September 23 Session
September 23, 2026
View chart & download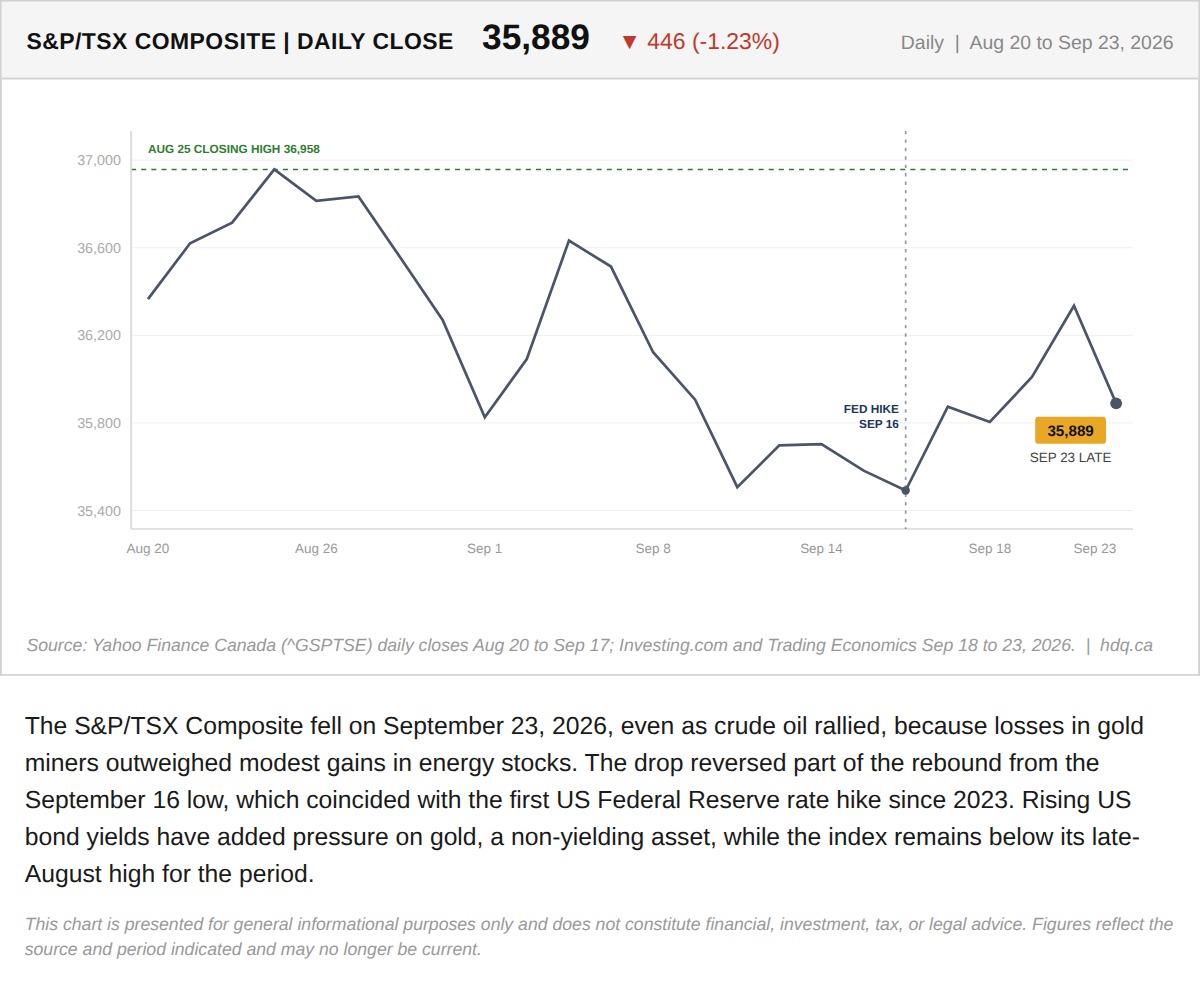
The S&P/TSX Composite fell on September 23, 2026, even as crude oil rallied, because losses in gold miners outweighed modest gains in energy stocks.
TSX Composite Falls Despite an Oil Rally as Gold Stocks Slide
September 23, 2026
View chart & download