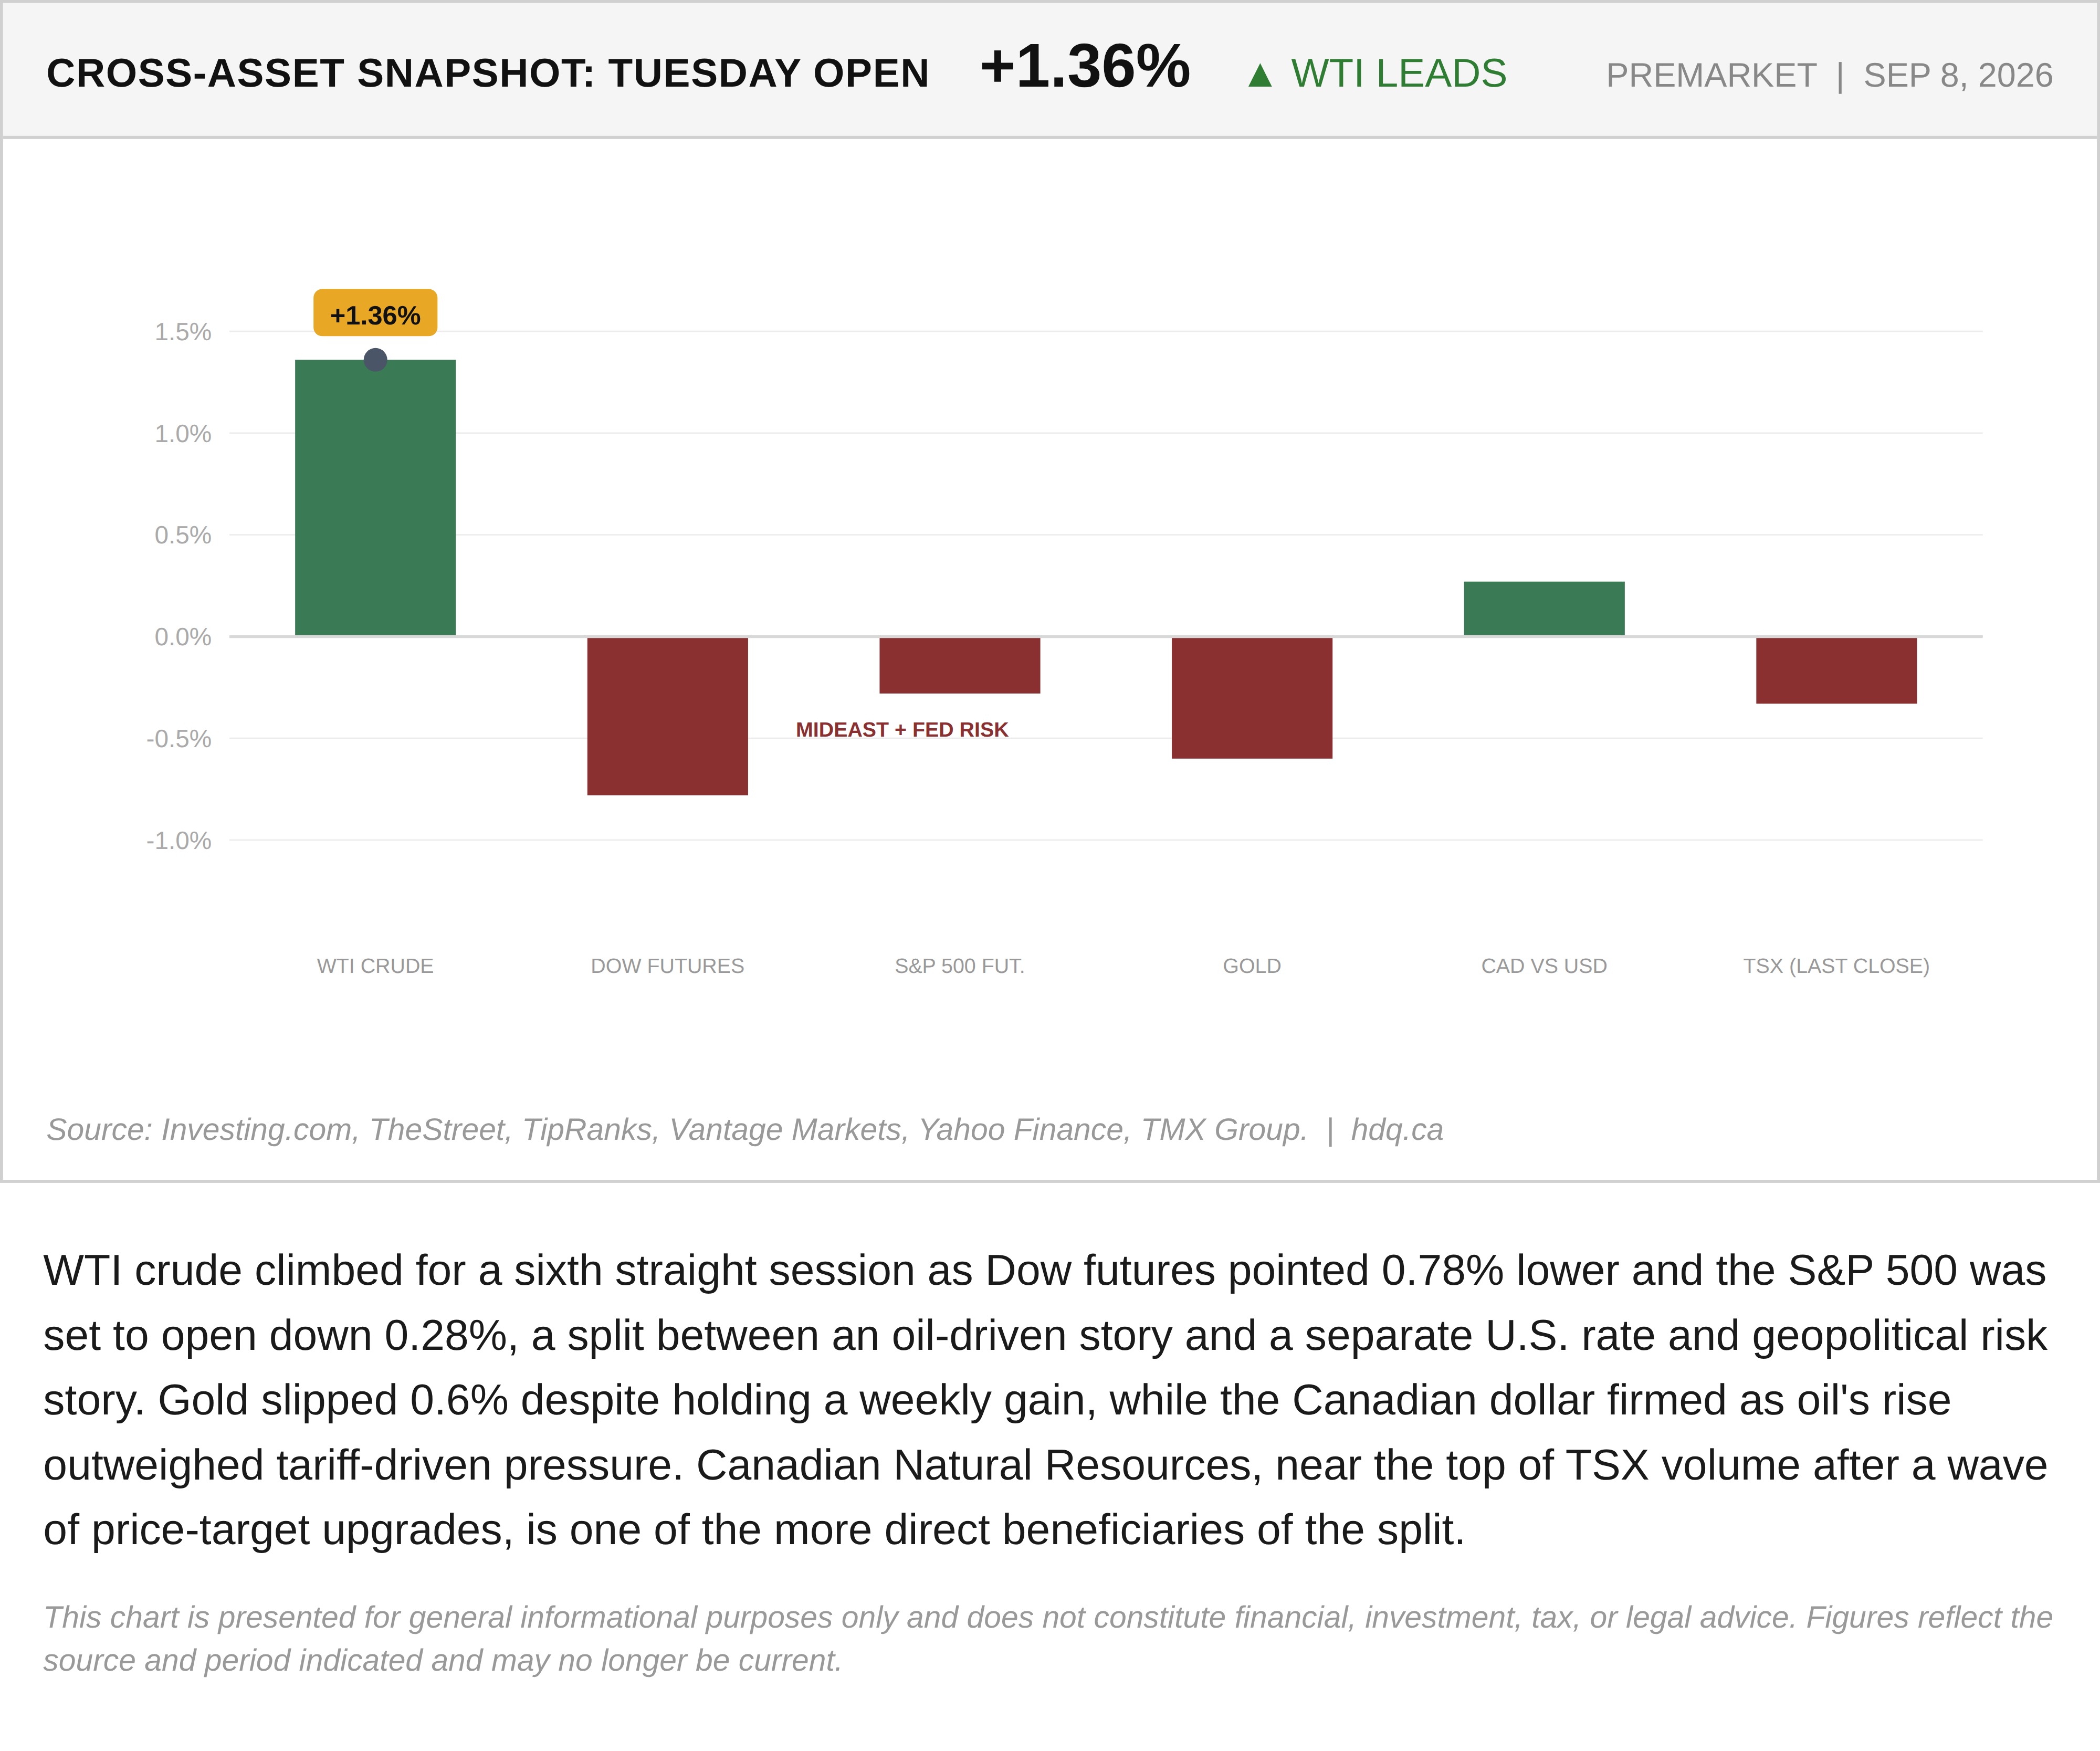
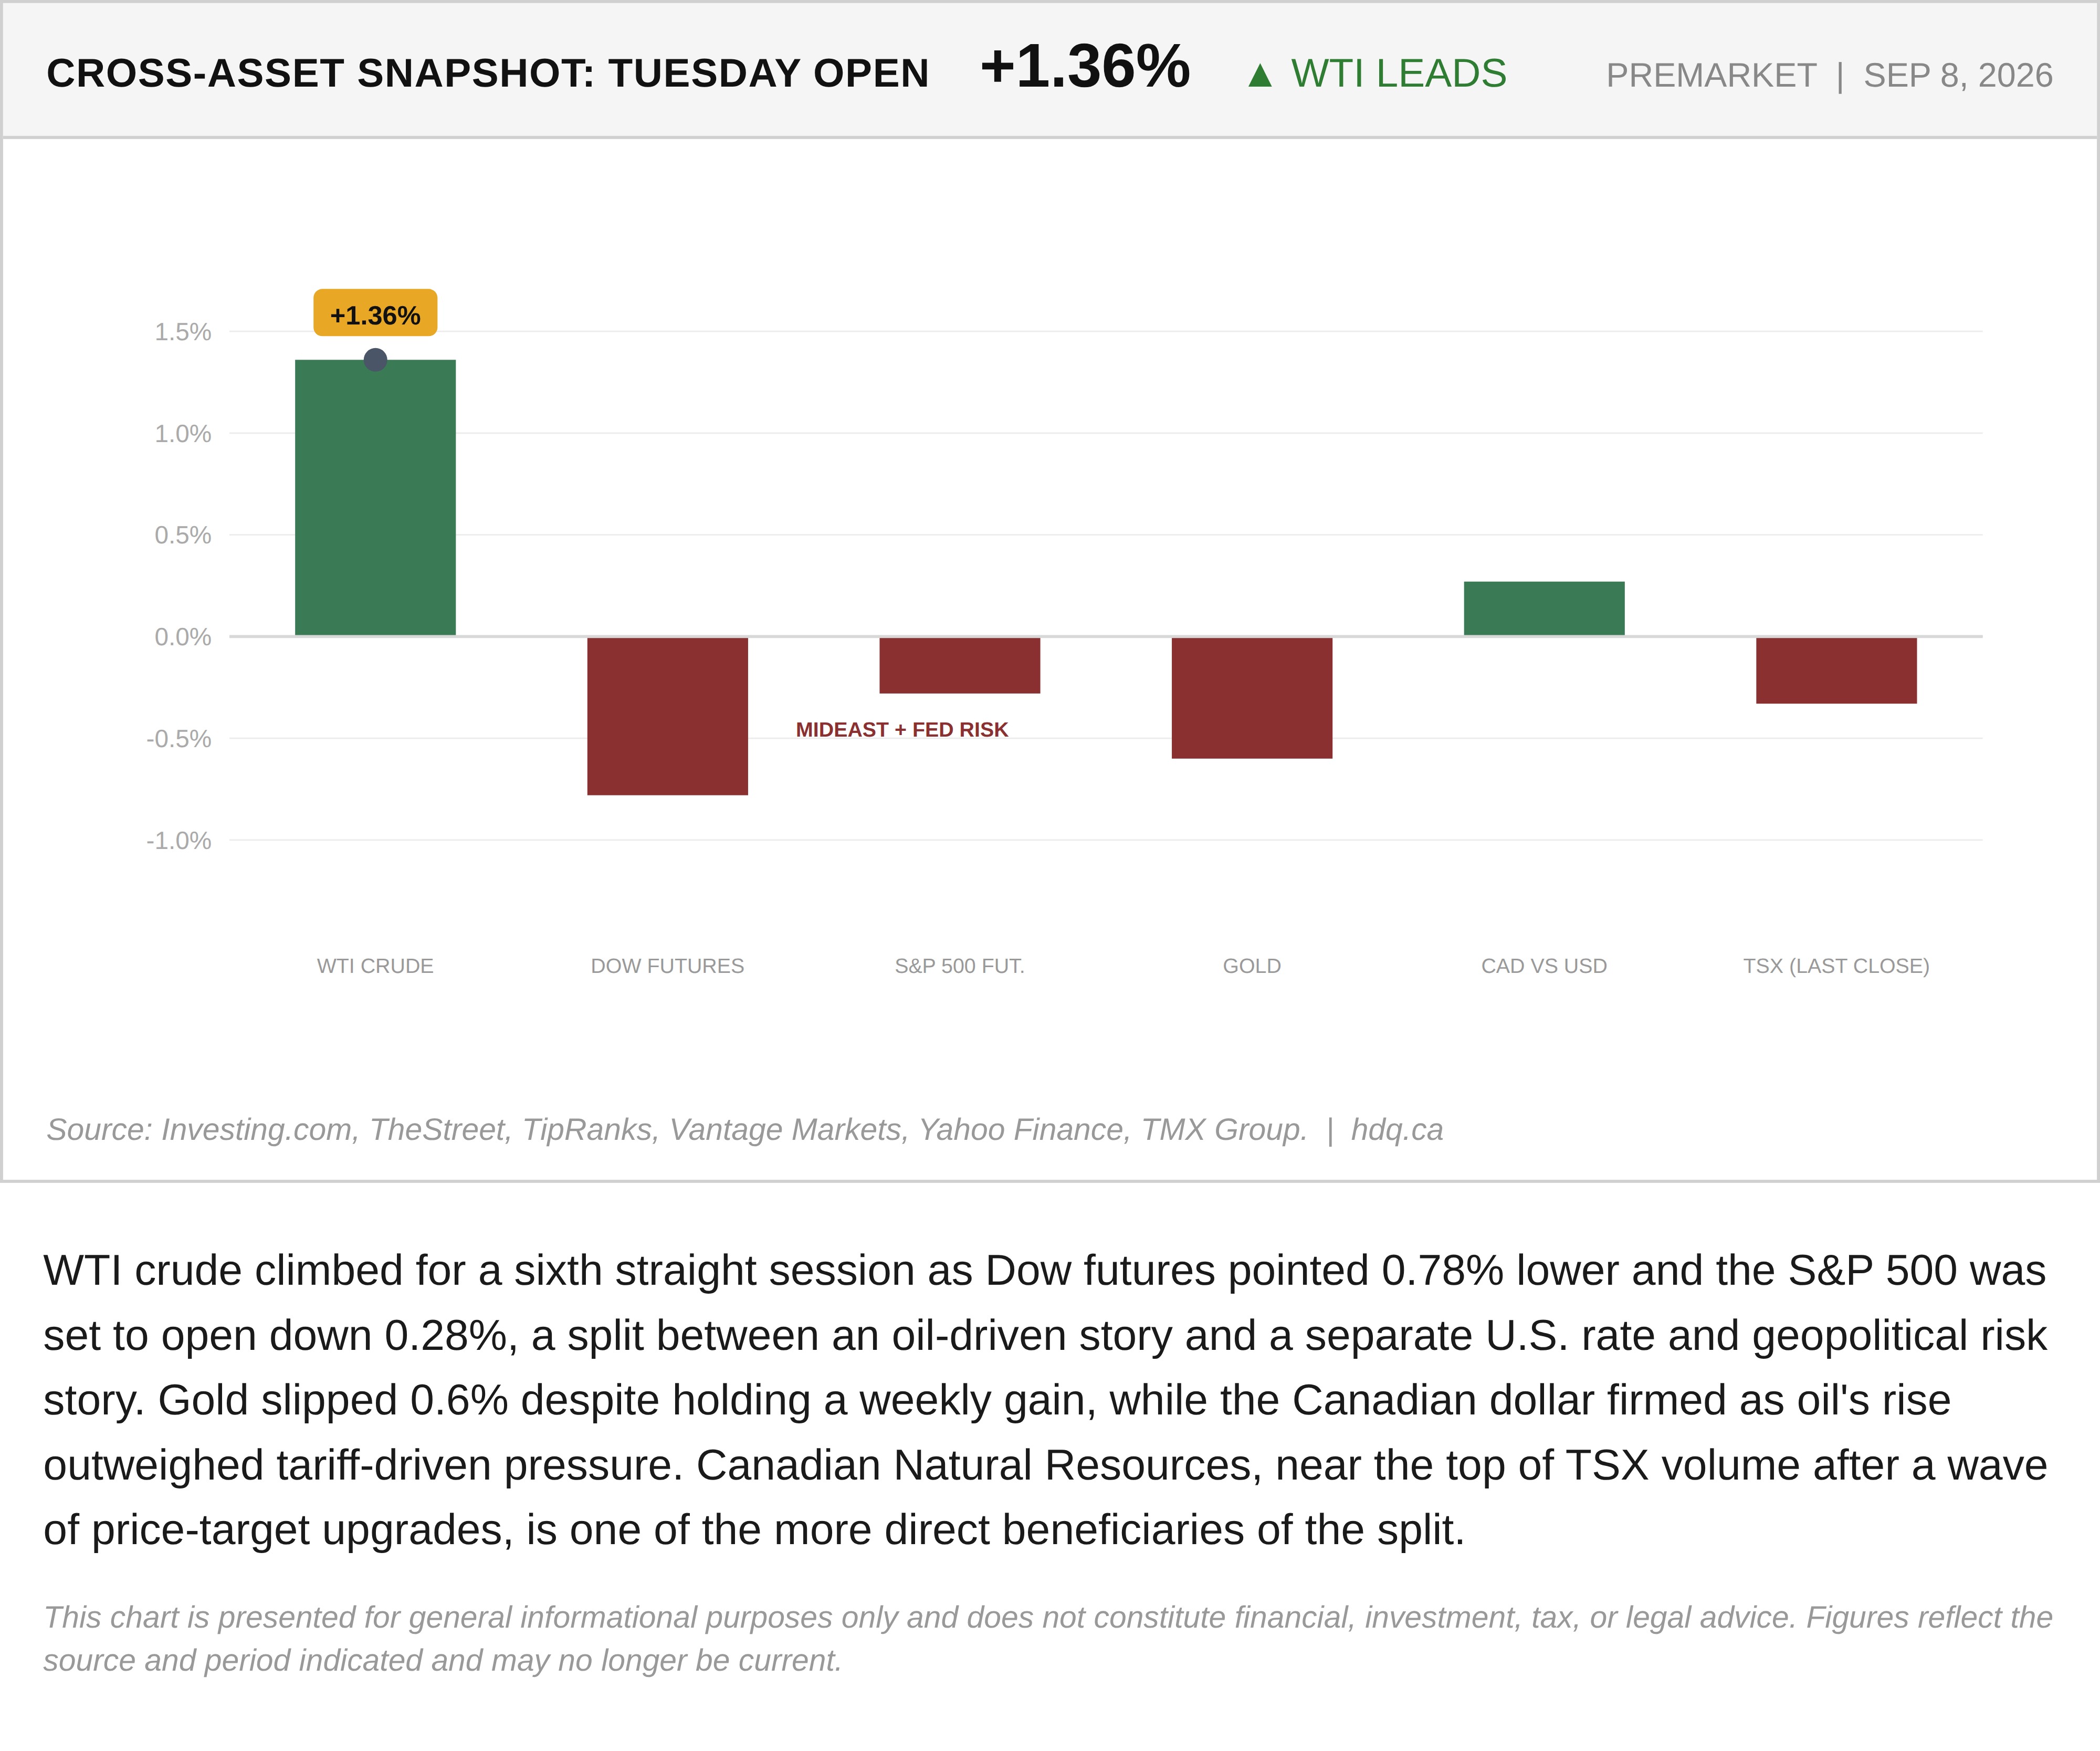
WTI crude climbed for a sixth straight session as Dow futures pointed 0.78% lower and the S&P 500 was set to open down 0.28%, a split between an oil-driven story and a separate U.S. rate and geopolitical risk story. Gold slipped 0.6% despite holding a weekly gain, while the Canadian dollar firmed as oil's rise outweighed tariff-driven pressure. Canadian Natural Resources, near the top of TSX volume after a wave of price-target upgrades, is one of the more direct beneficiaries of the split.
This chart is presented for general informational purposes only and does not constitute financial, investment, tax, or legal advice. Figures reflect the source and period indicated and may no longer be current.
Related charts
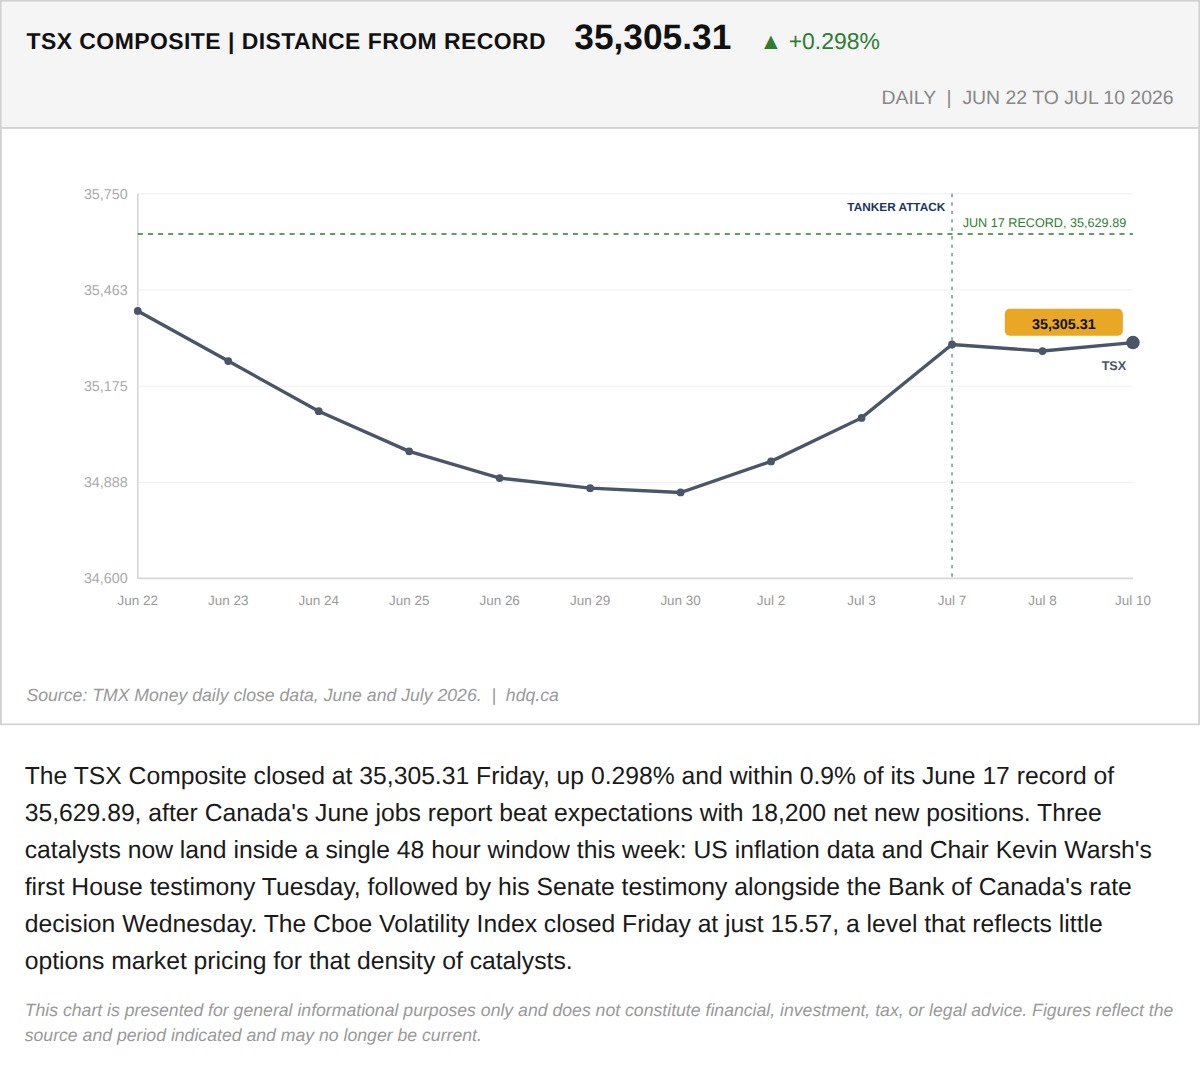
The TSX Composite closed at 35,305.31 Friday, up 0.298% and within 0.9% of its June 17 record of 35,629.89, after Canada's June jobs report…
324 Points From a Record, the TSX Heads Into Its Busiest 48 Hours of the Summer
July 13, 2026
View chart & download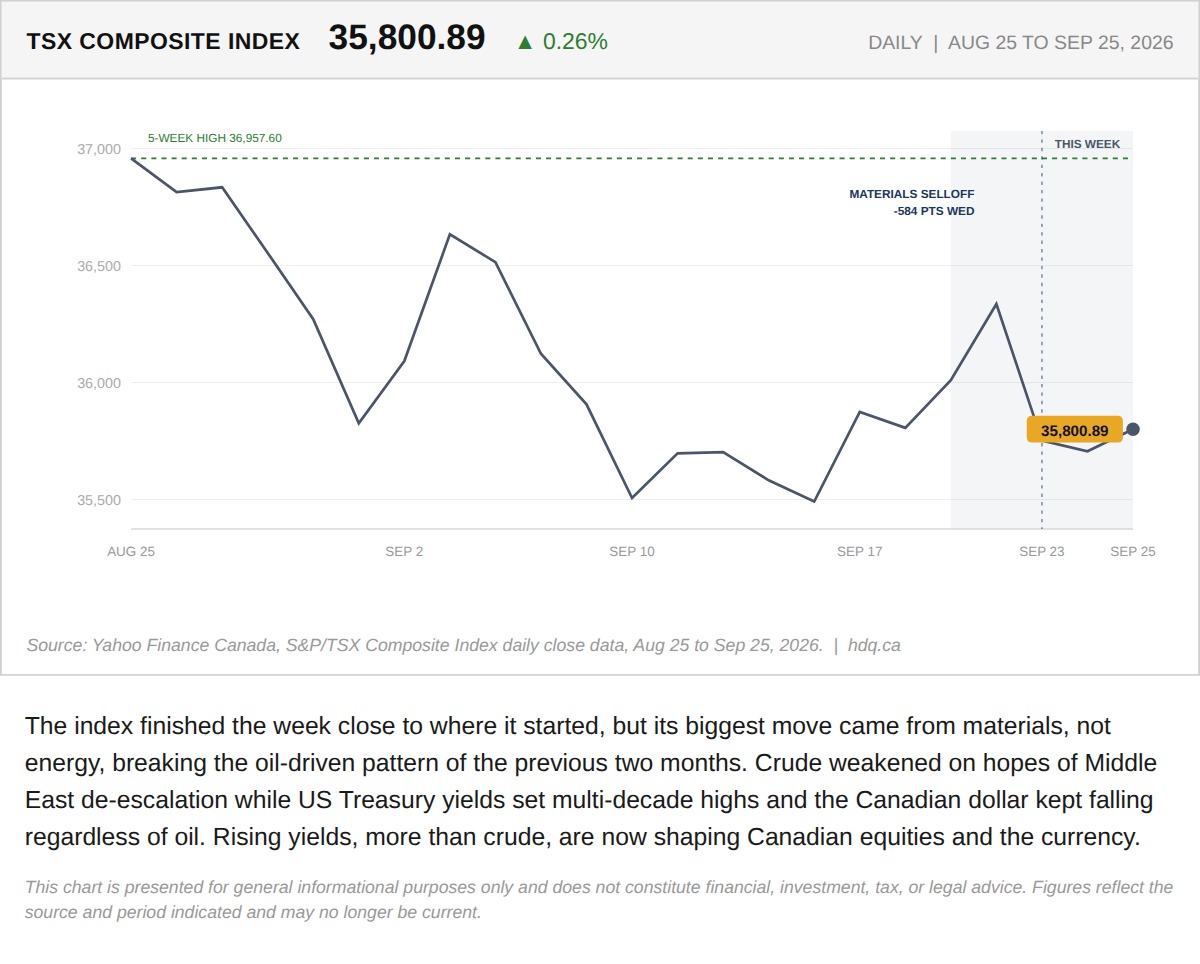
The index finished the week close to where it started, but its biggest move came from materials, not energy, breaking the oil-driven pattern of the previous two months.
TSX Ends the Week Flat as Oil Loses Its Grip
September 26, 2026
View chart & download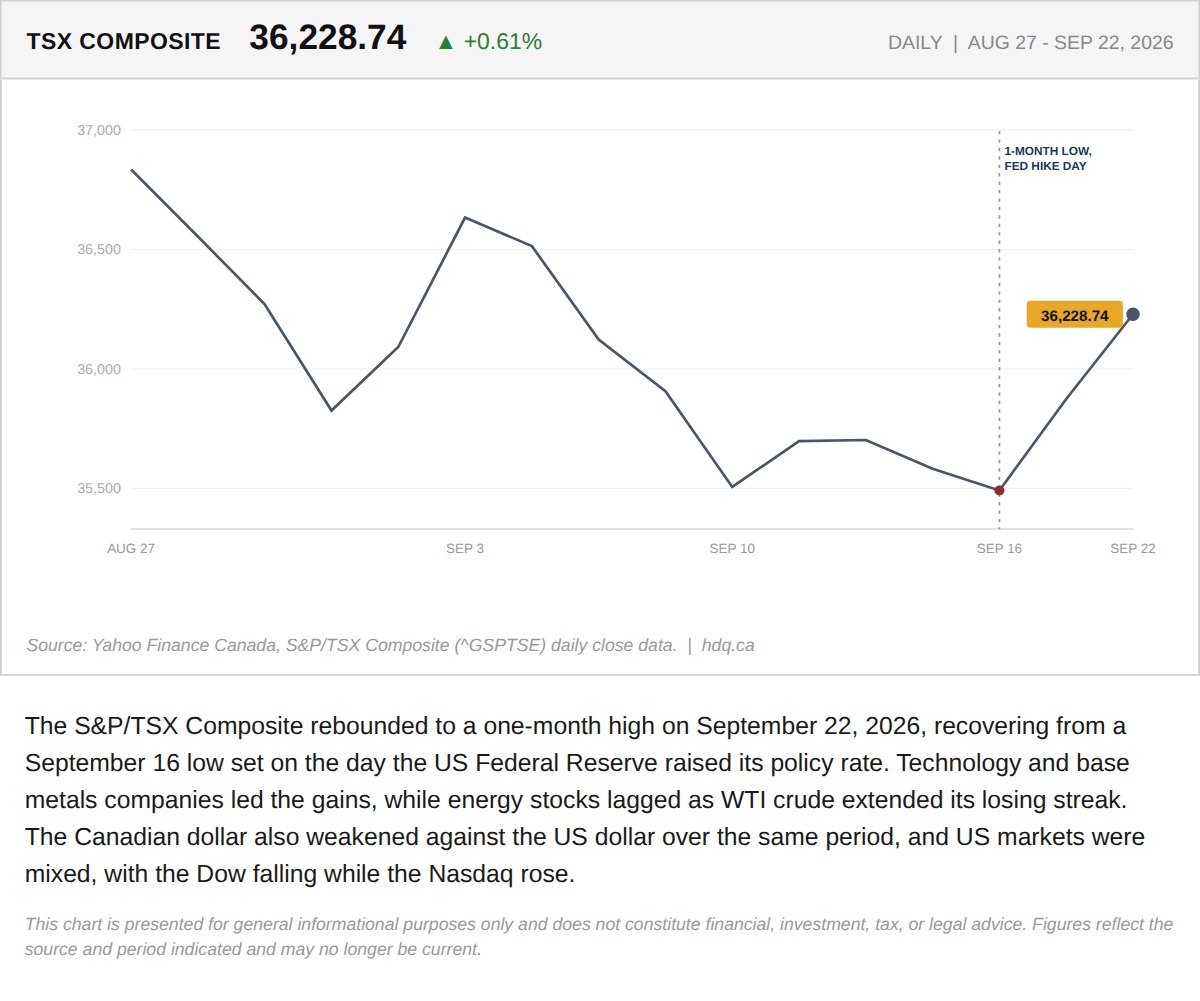
The S&P/TSX Composite rebounded to a one-month high on September 22, 2026, recovering from a September 16 low set on the day the US Federal Reserve raised its policy rate.
The TSX Hit a One-Month High on Tech and Base Metals While Energy Keeps Falling
September 23, 2026
View chart & download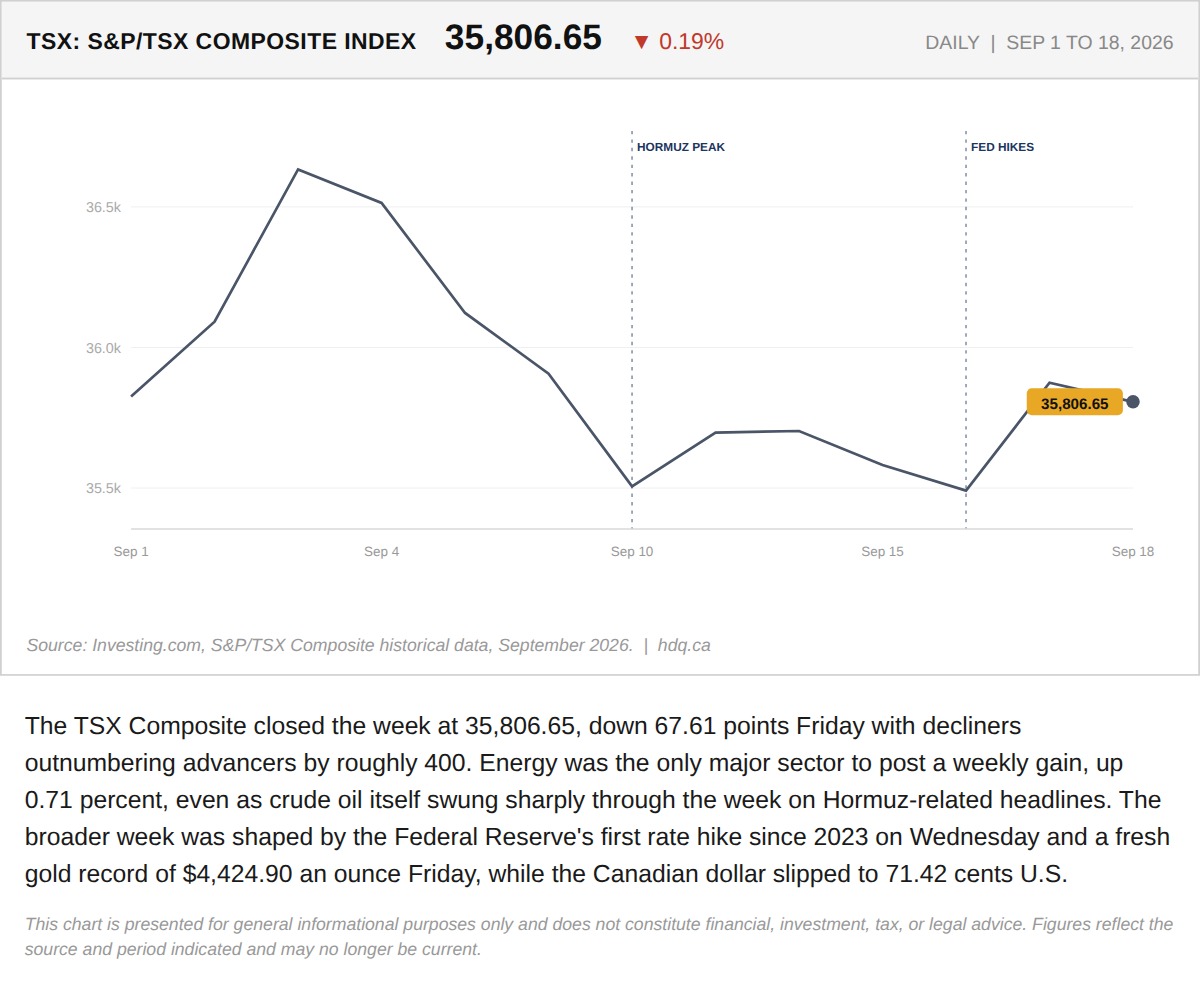
The TSX Composite closed the week at 35,806.65, down 67.61 points Friday with decliners outnumbering advancers by roughly 400.
The TSX Closed a Volatile Week at 35,806.65. Energy Was the Only Sector That Actually Held.
September 21, 2026
View chart & download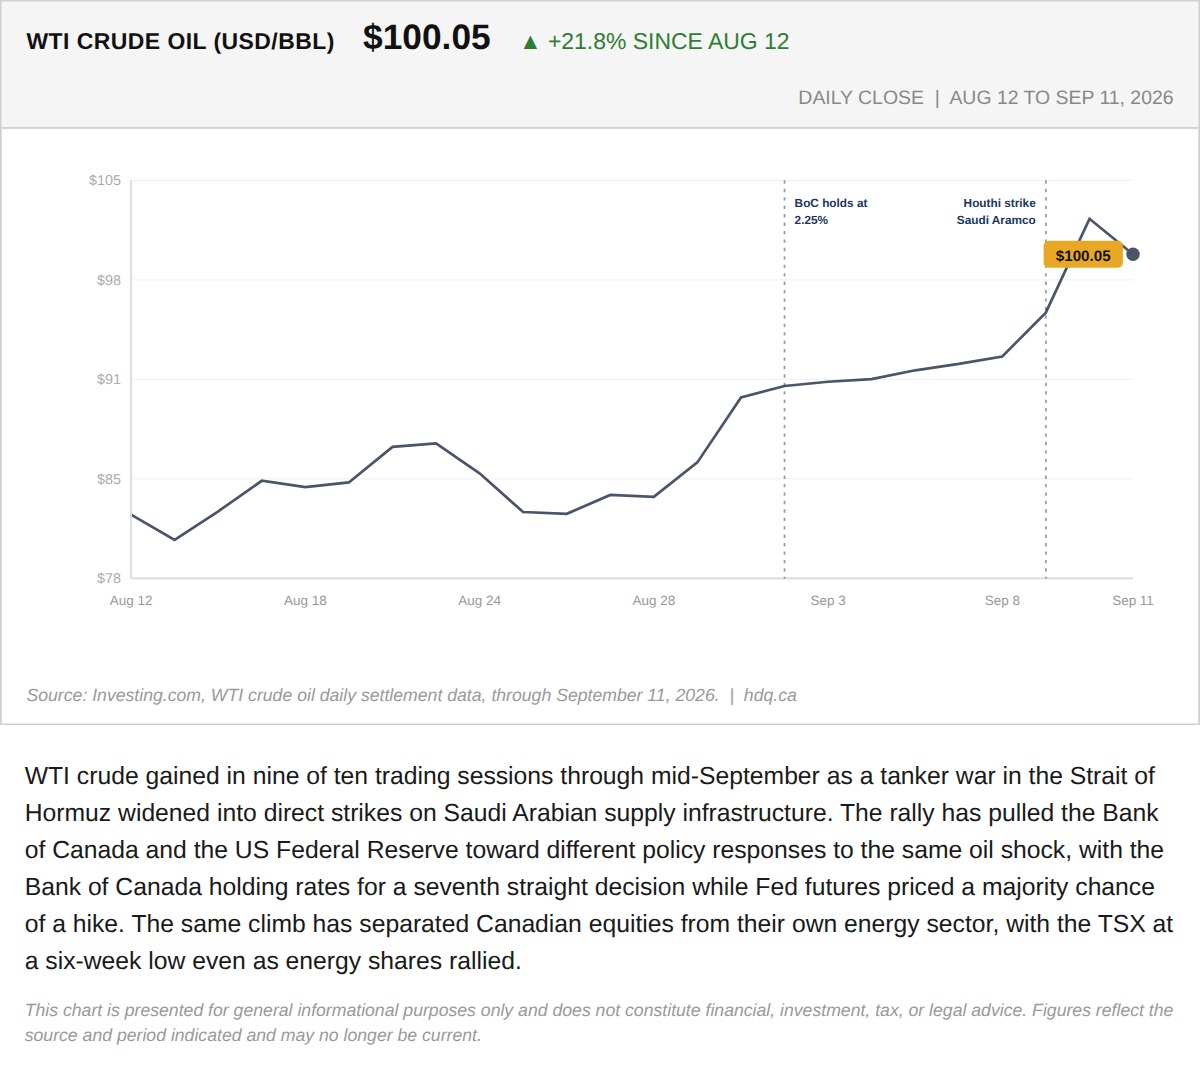
WTI crude gained in nine of ten trading sessions through mid-September as a tanker war in the Strait of Hormuz widened into direct strikes on Saudi Arabian supply infrastructure.
The Week the Same Barrel of Oil Split the BoC From the Fed and the TSX From Its Own Energy Sector
September 12, 2026
View chart & download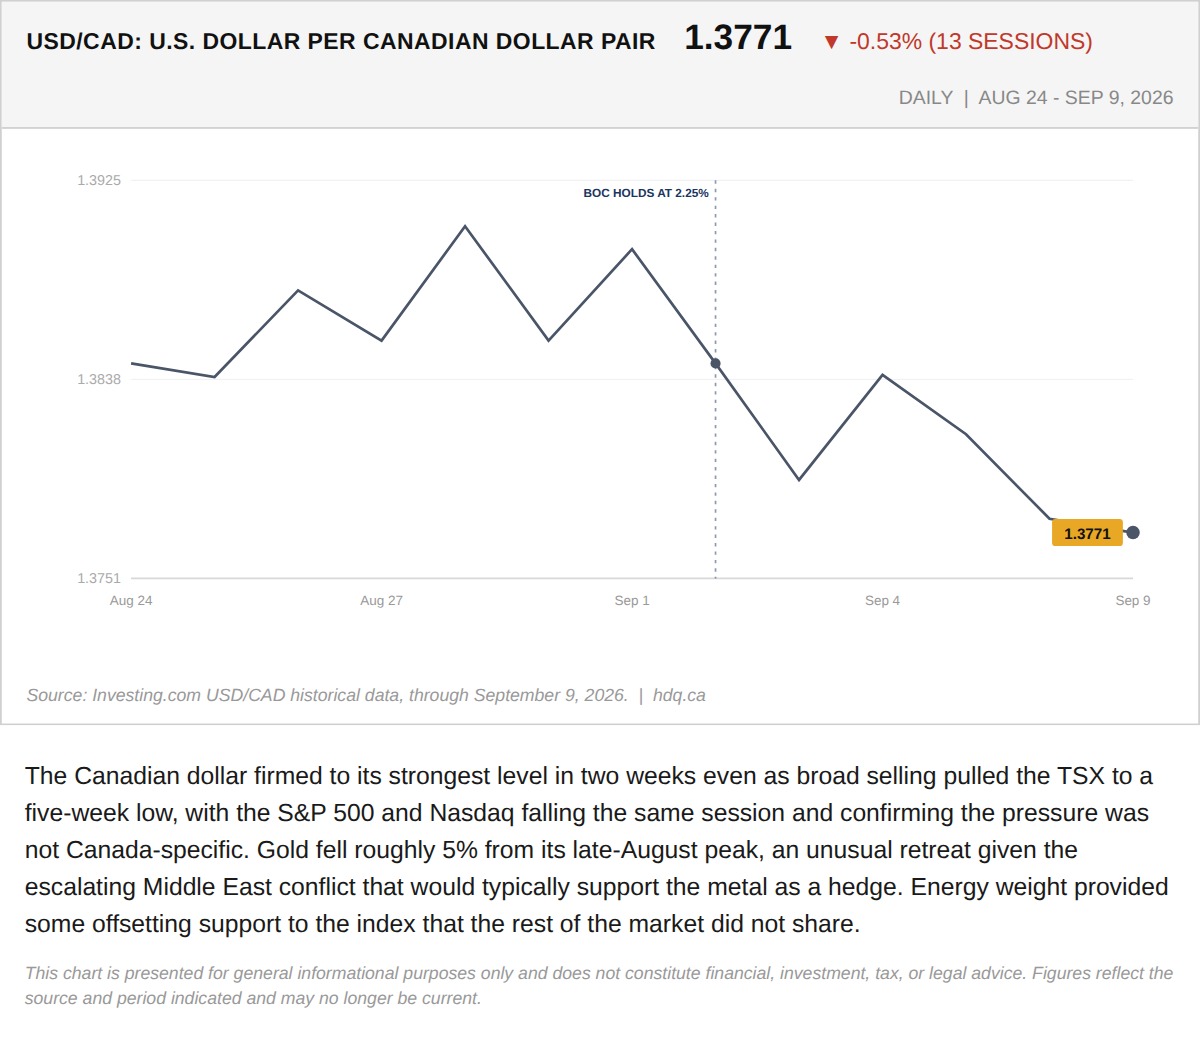
The Canadian dollar firmed to its strongest level in two weeks even as broad selling pulled the TSX to a five-week low, with the S&P 500…
TSX Falls to a Five-Week Low as Broad Selling Outweighs the Oil Rally's Support
September 10, 2026
View chart & download