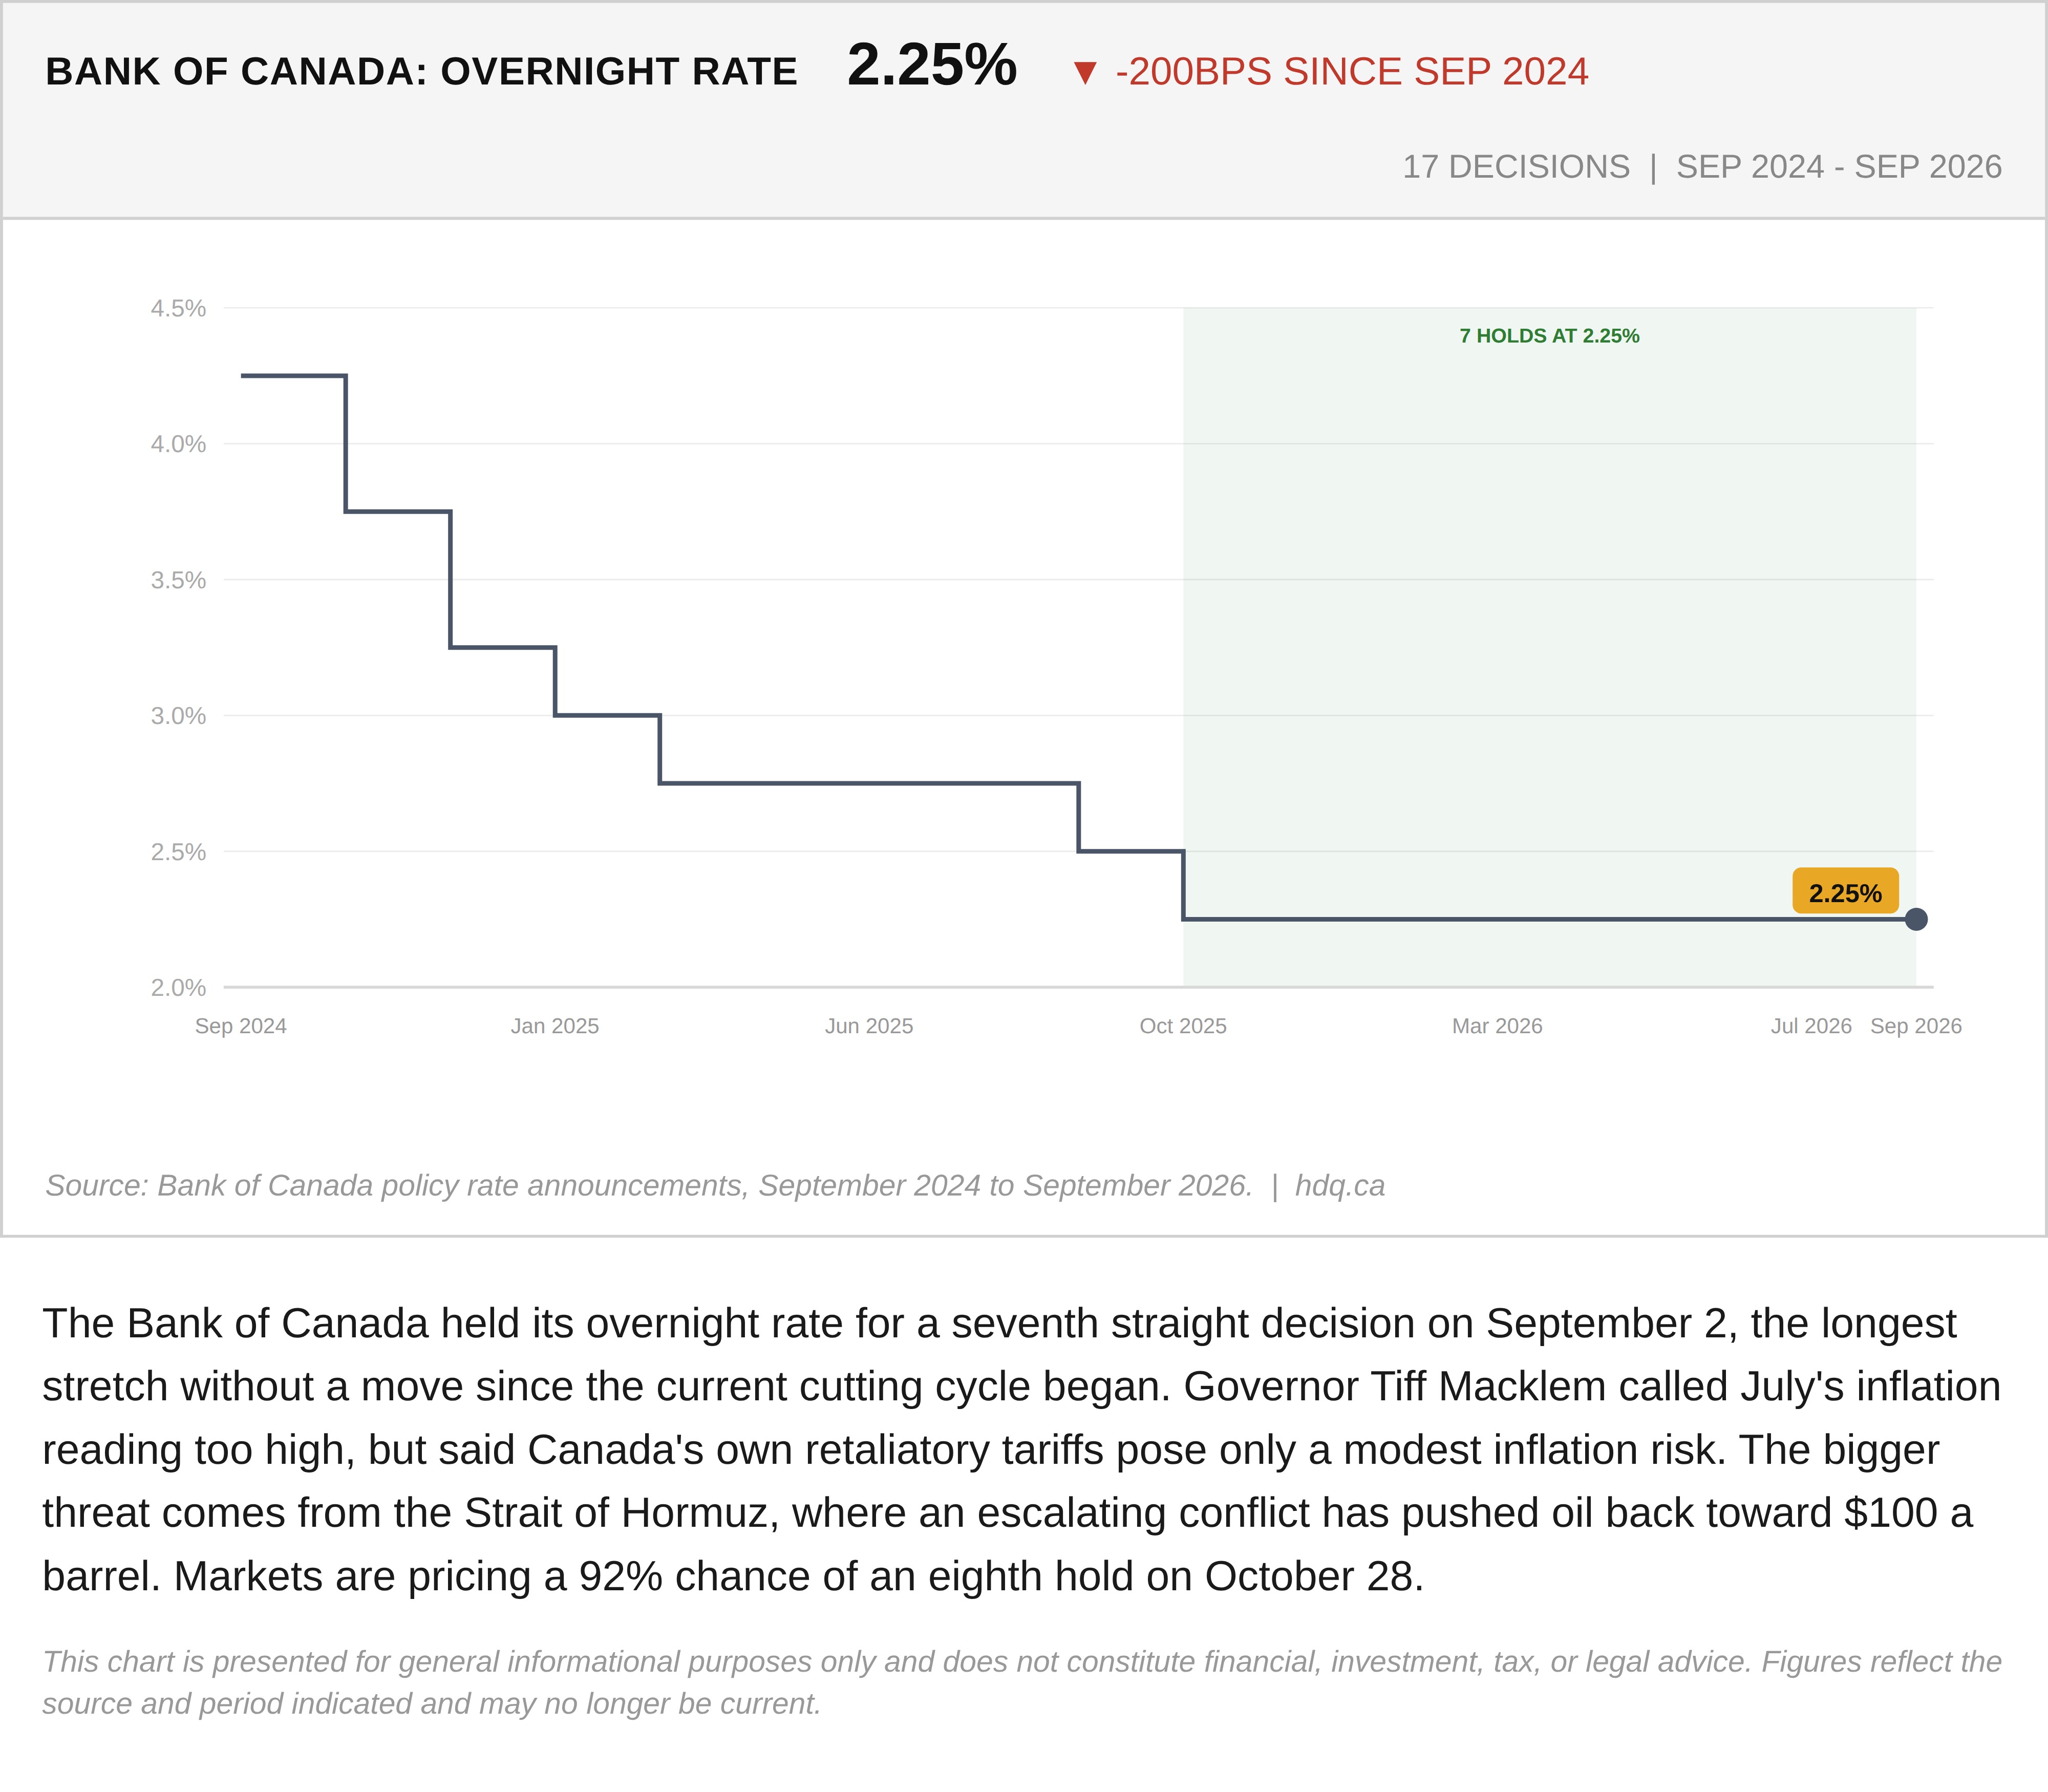
The Bank of Canada held its overnight rate for a seventh straight decision on September 2, the longest stretch without a move since the current cutting cycle began. Governor Tiff Macklem called July's inflation reading too high, but said Canada's own retaliatory tariffs pose only a modest inflation risk. The bigger threat comes from the Strait of Hormuz, where an escalating conflict has pushed oil back toward $100 a barrel. Markets are pricing a 92% chance of an eighth hold on October 28.
This chart is presented for general informational purposes only and does not constitute financial, investment, tax, or legal advice. Figures reflect the source and period indicated and may no longer be current.
Related charts
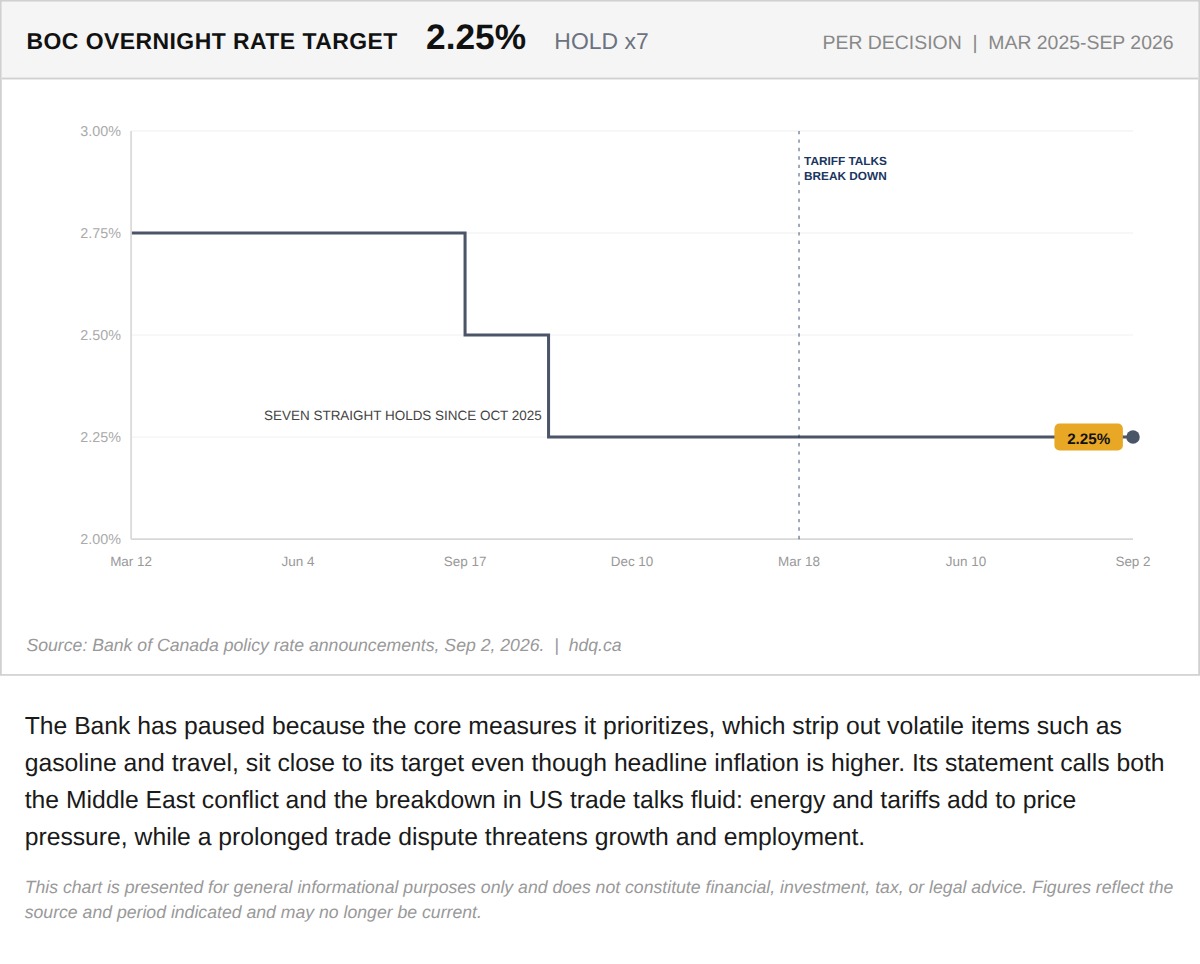
The Bank has paused because the core measures it prioritizes, which strip out volatile items such as gasoline and travel, sit close to its…
Bank of Canada Holds Its Rate for a Seventh Straight Decision
September 28, 2026
View chart & download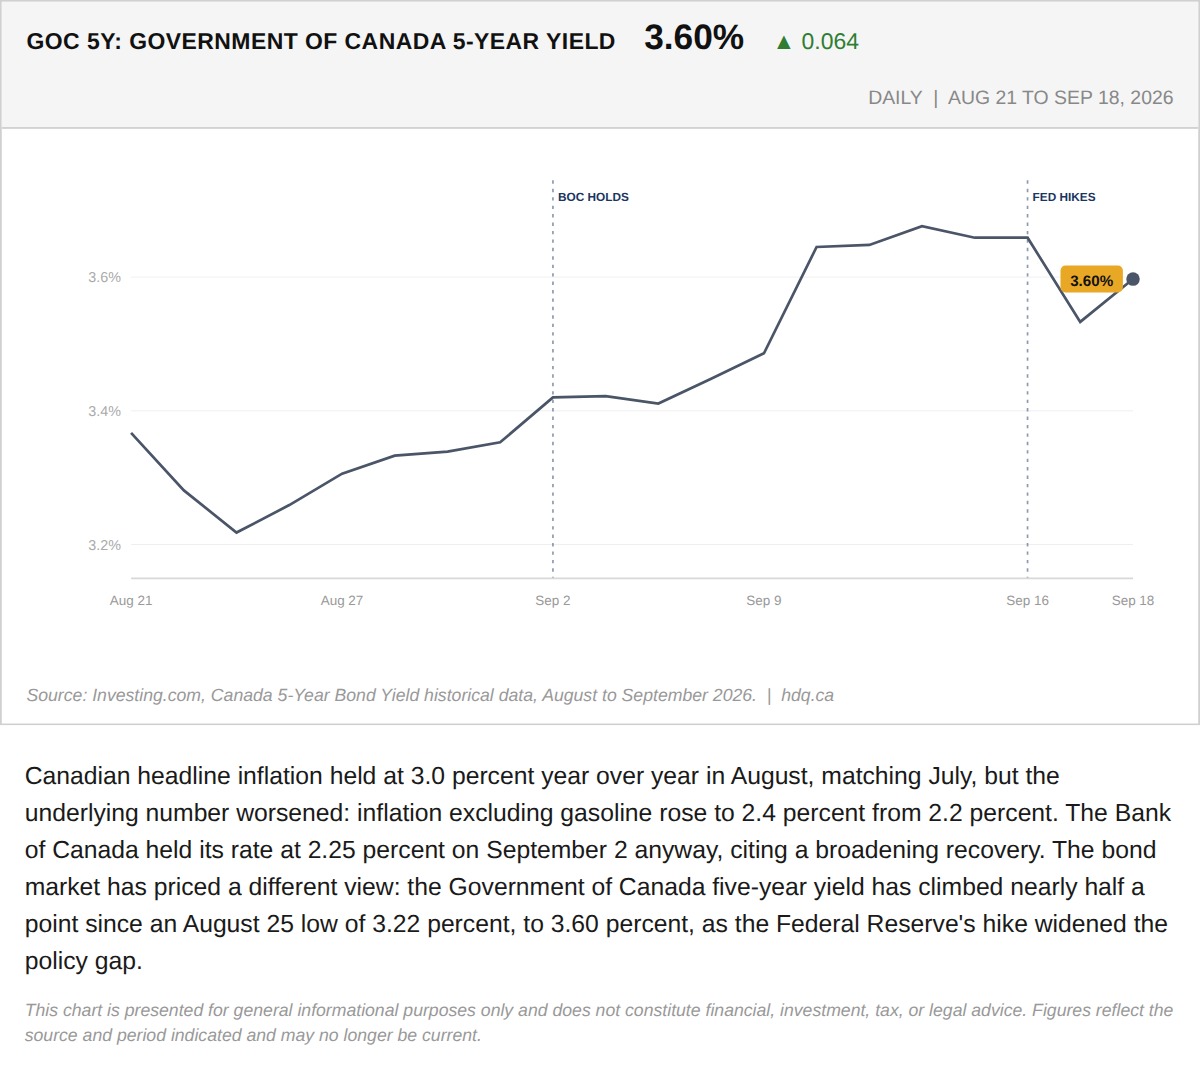
Canadian headline inflation held at 3.0 percent year over year in August, matching July, but the underlying number worsened: inflation…
The Bond Market Already Moved Before the Bank of Canada Has To
September 21, 2026
View chart & download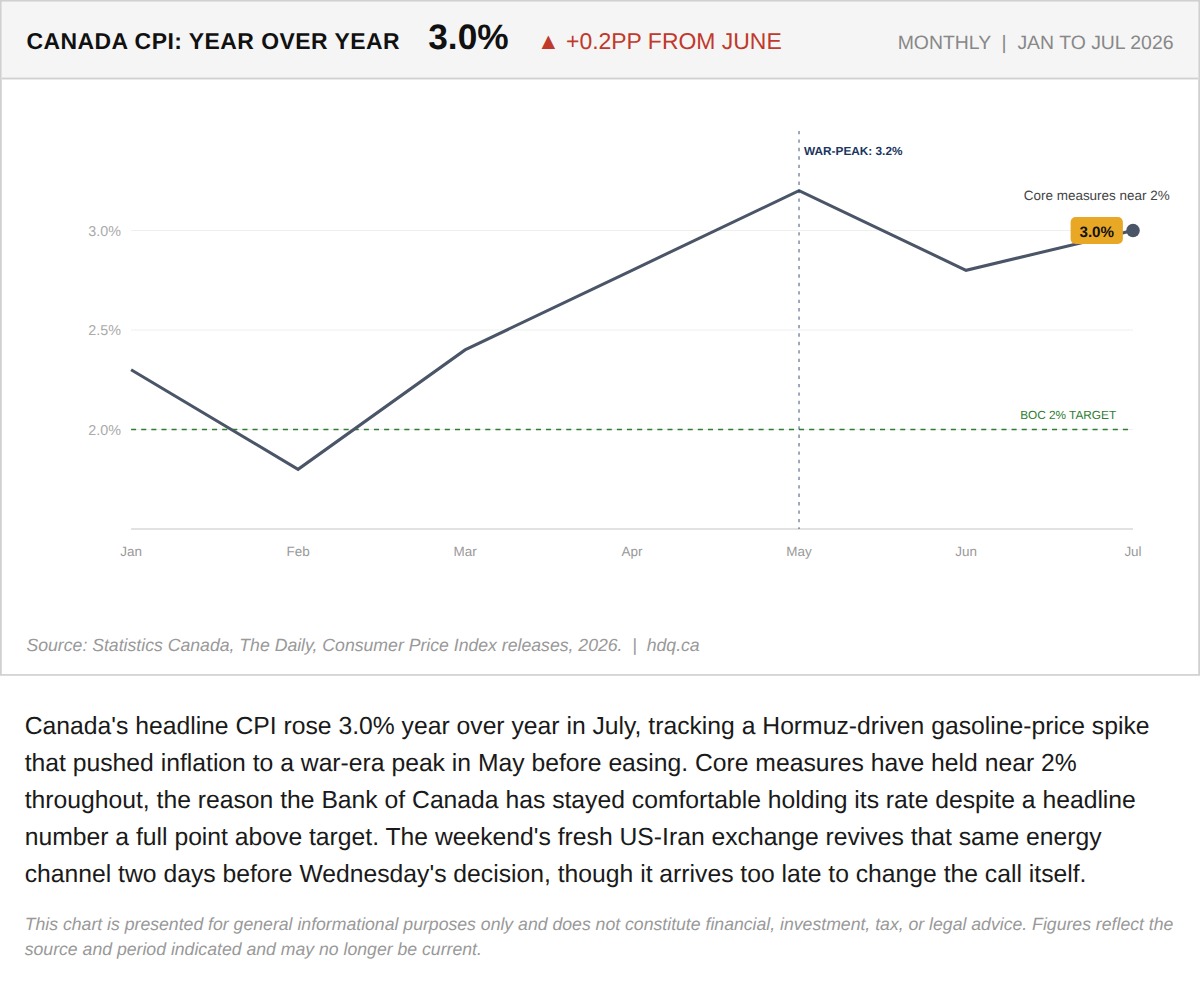
Canada's headline CPI rose 3.0% year over year in July, tracking a Hormuz-driven gasoline-price spike that pushed inflation to a war-era peak in May before easing.
The Bank of Canada Meets Wednesday With Growth Ahead of Forecast and the Gasoline Channel Reopened
August 31, 2026
View chart & download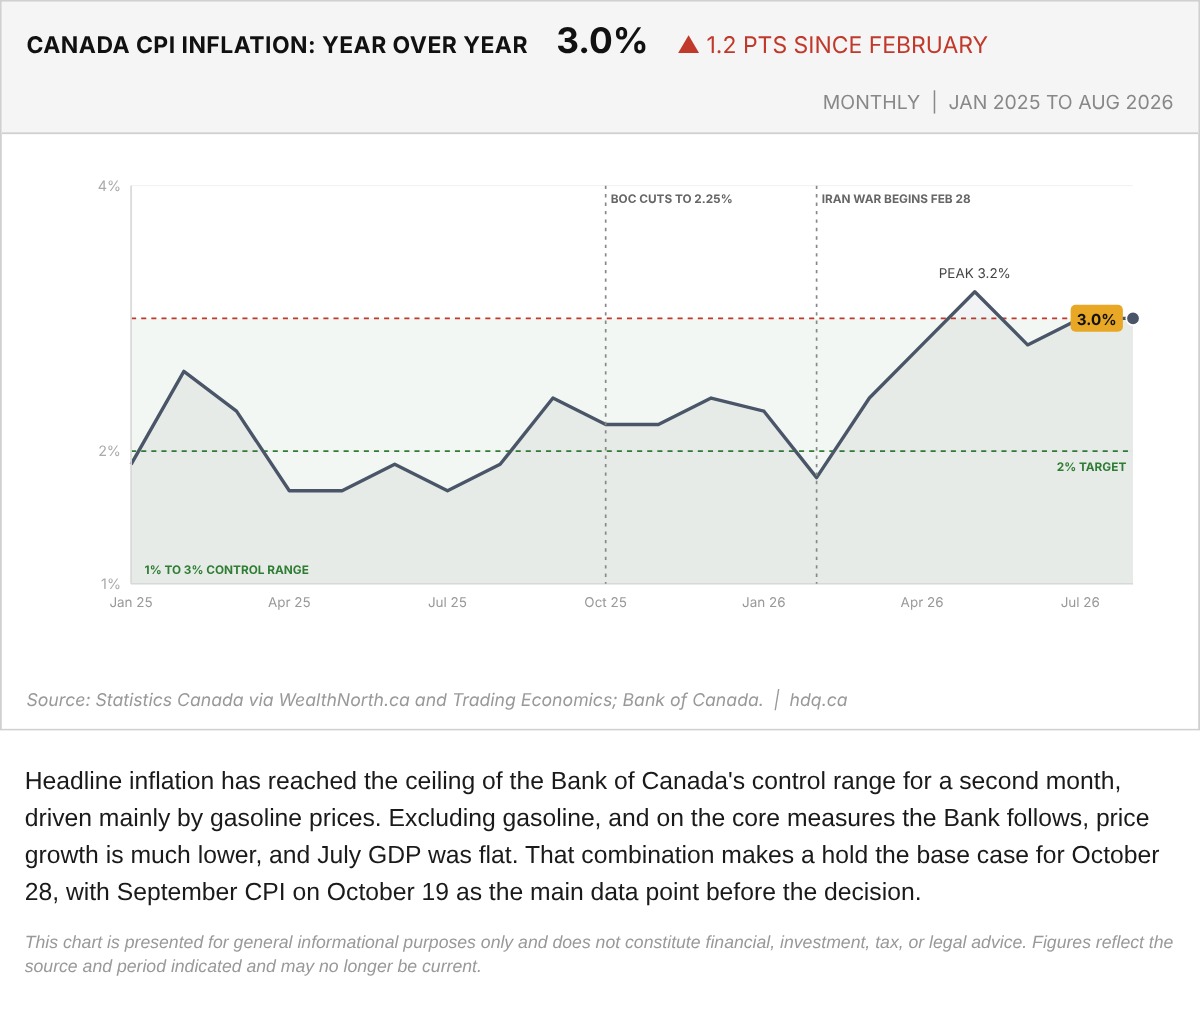
Headline inflation has reached the ceiling of the Bank of Canada's control range for a second month, driven mainly by gasoline prices.
Canada Consumer Price Index Inflation, January 2025 to August 2026
October 1, 2026
View chart & download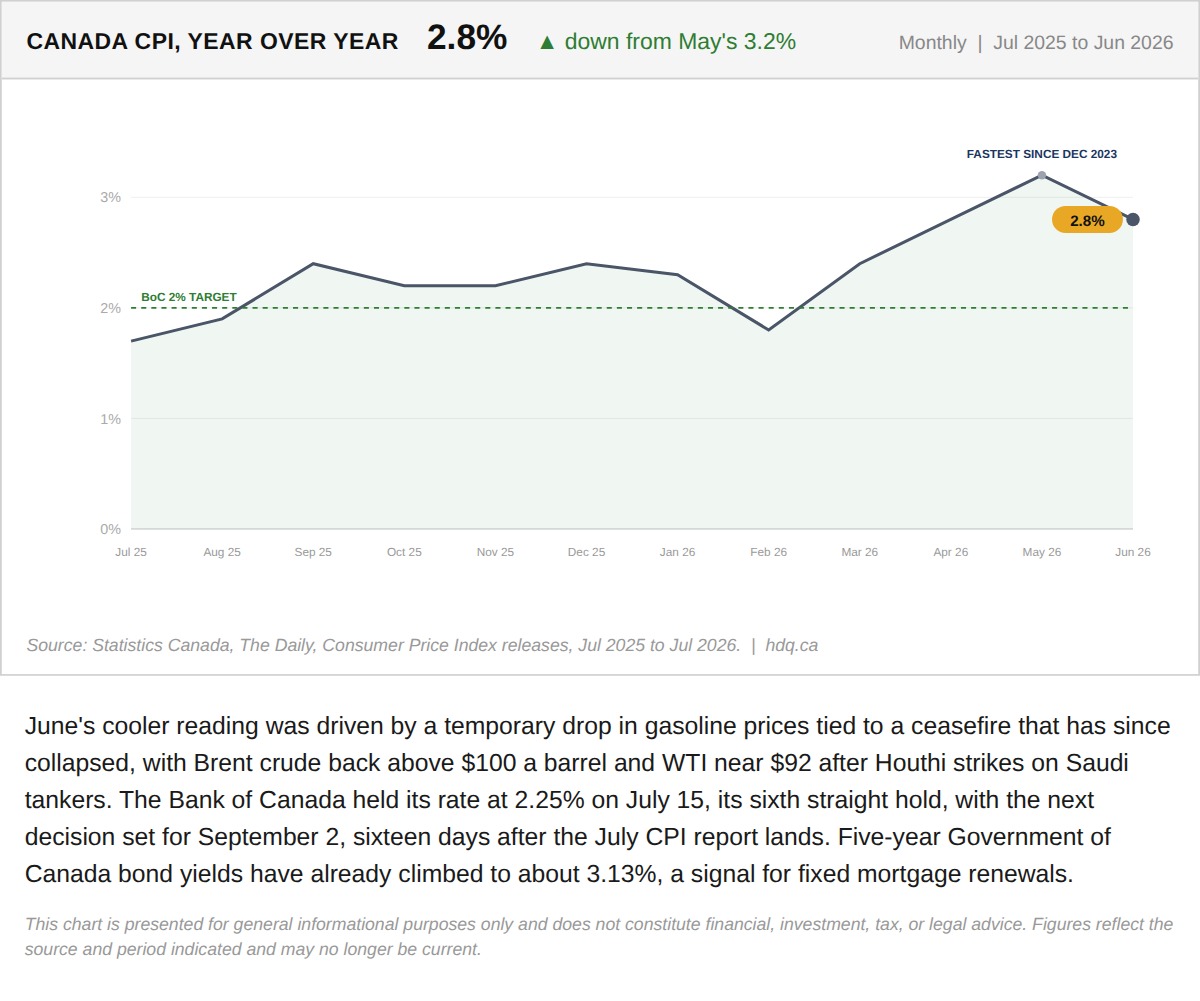
June's cooler reading was driven by a temporary drop in gasoline prices tied to a ceasefire that has since collapsed, with Brent crude back…
June's Cooler Inflation Print Rested on a Ceasefire That Has Already Broken
July 24, 2026
View chart & download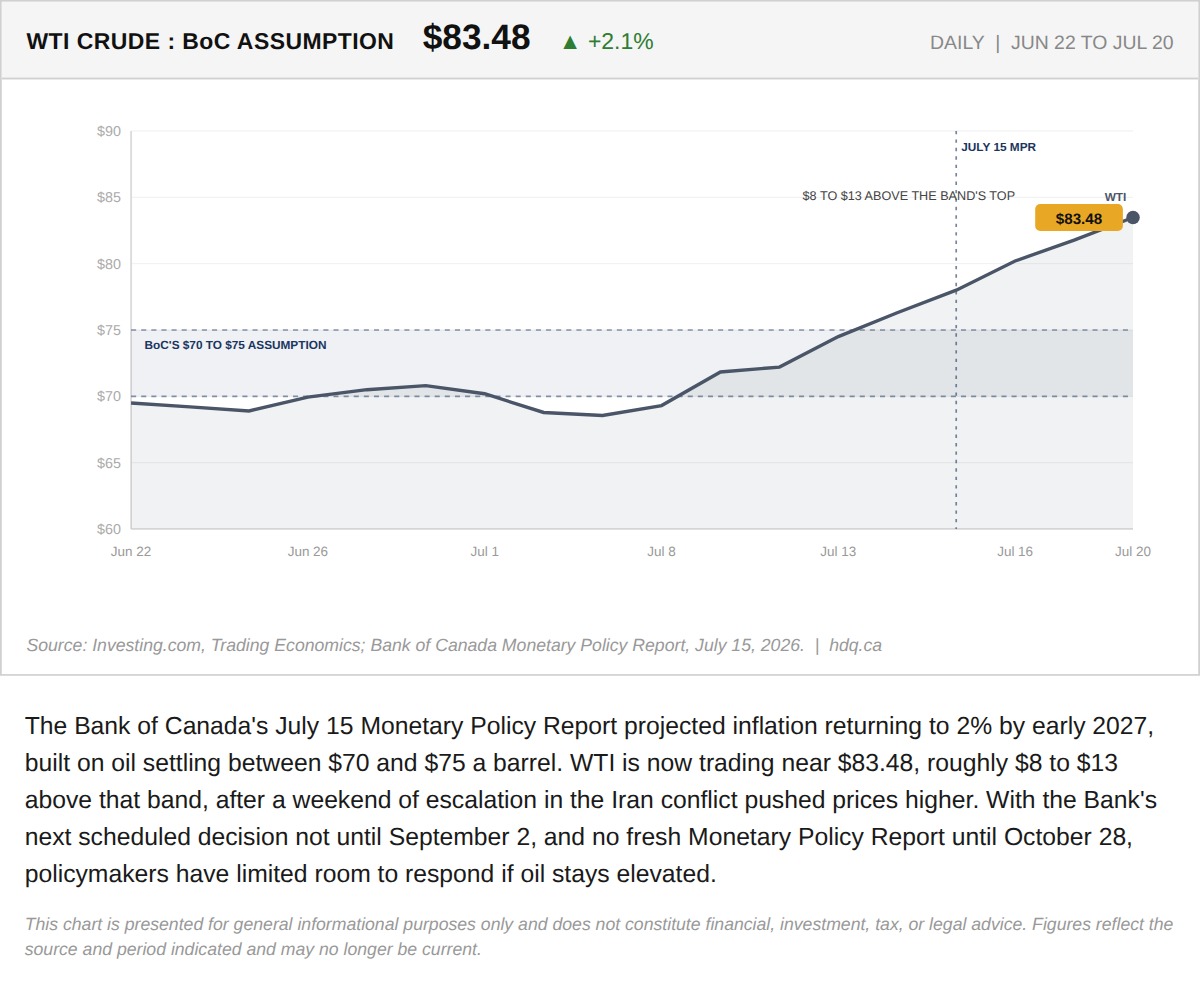
The Bank of Canada's July 15 Monetary Policy Report projected inflation returning to 2% by early 2027, built on oil settling between $70 and $75 a barrel.
The Bank of Canada's Path Back to 2% Assumed Oil at $70 to $75. It's Trading Near $84.
July 20, 2026
View chart & download