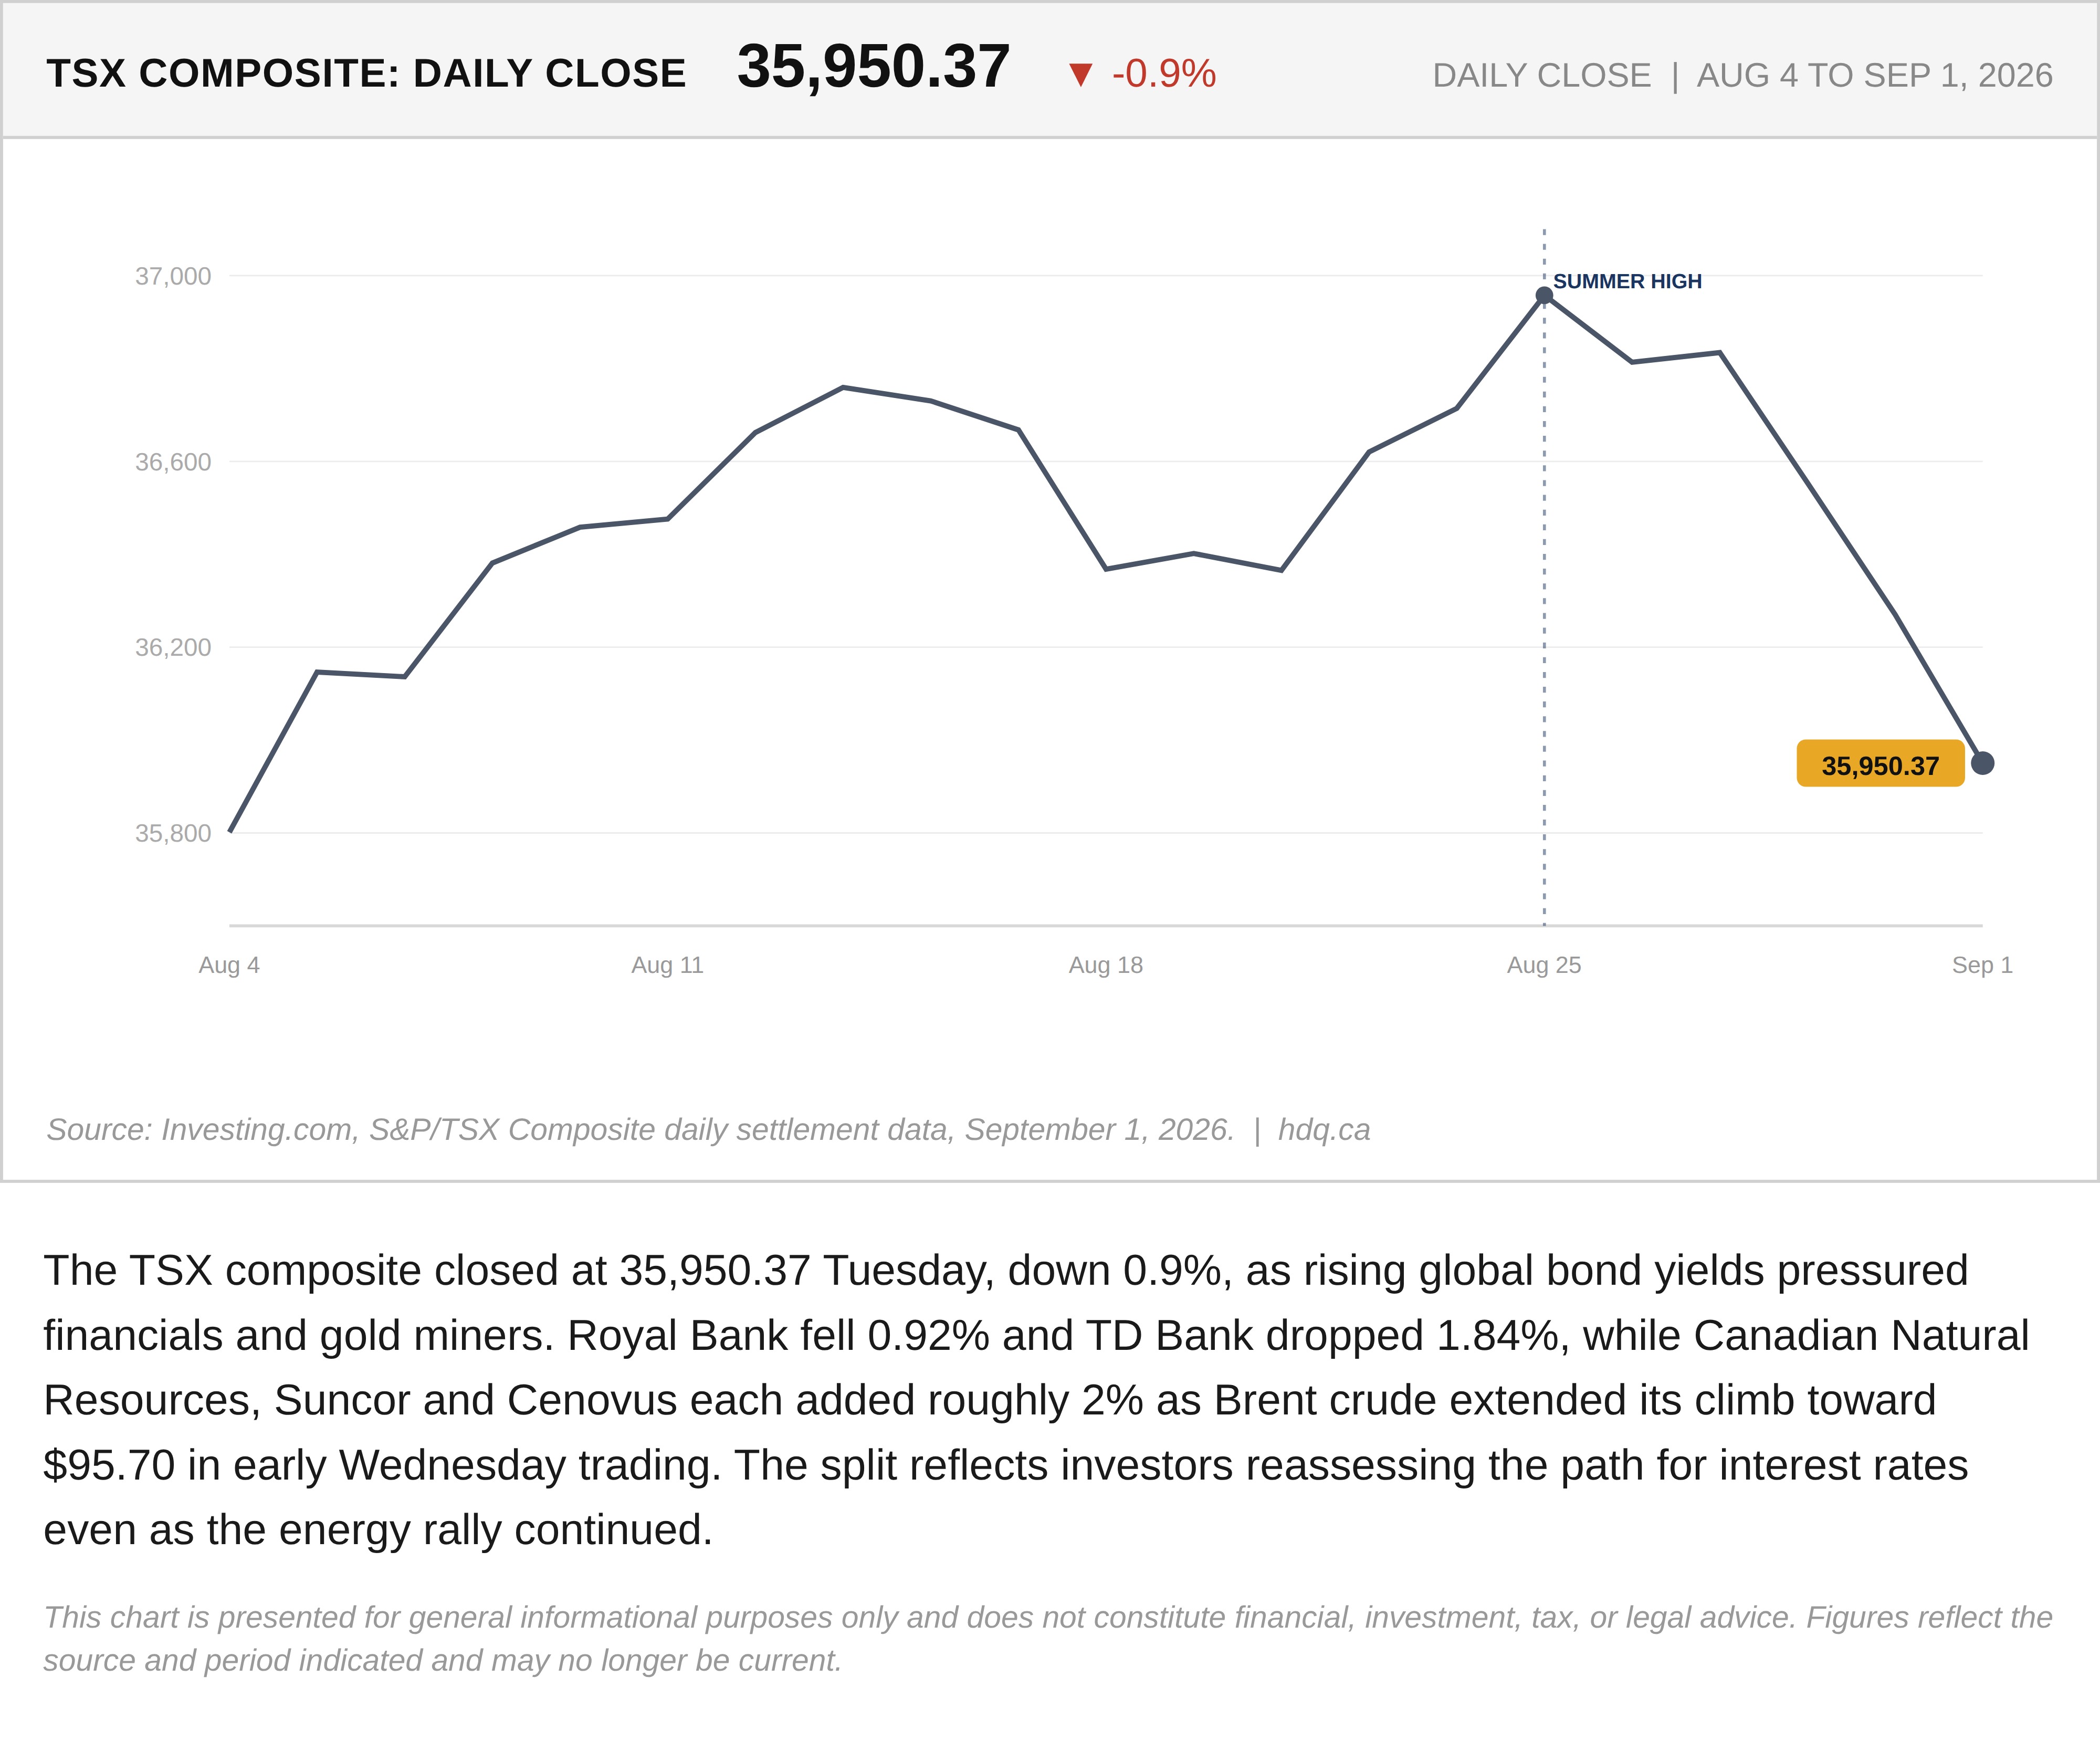
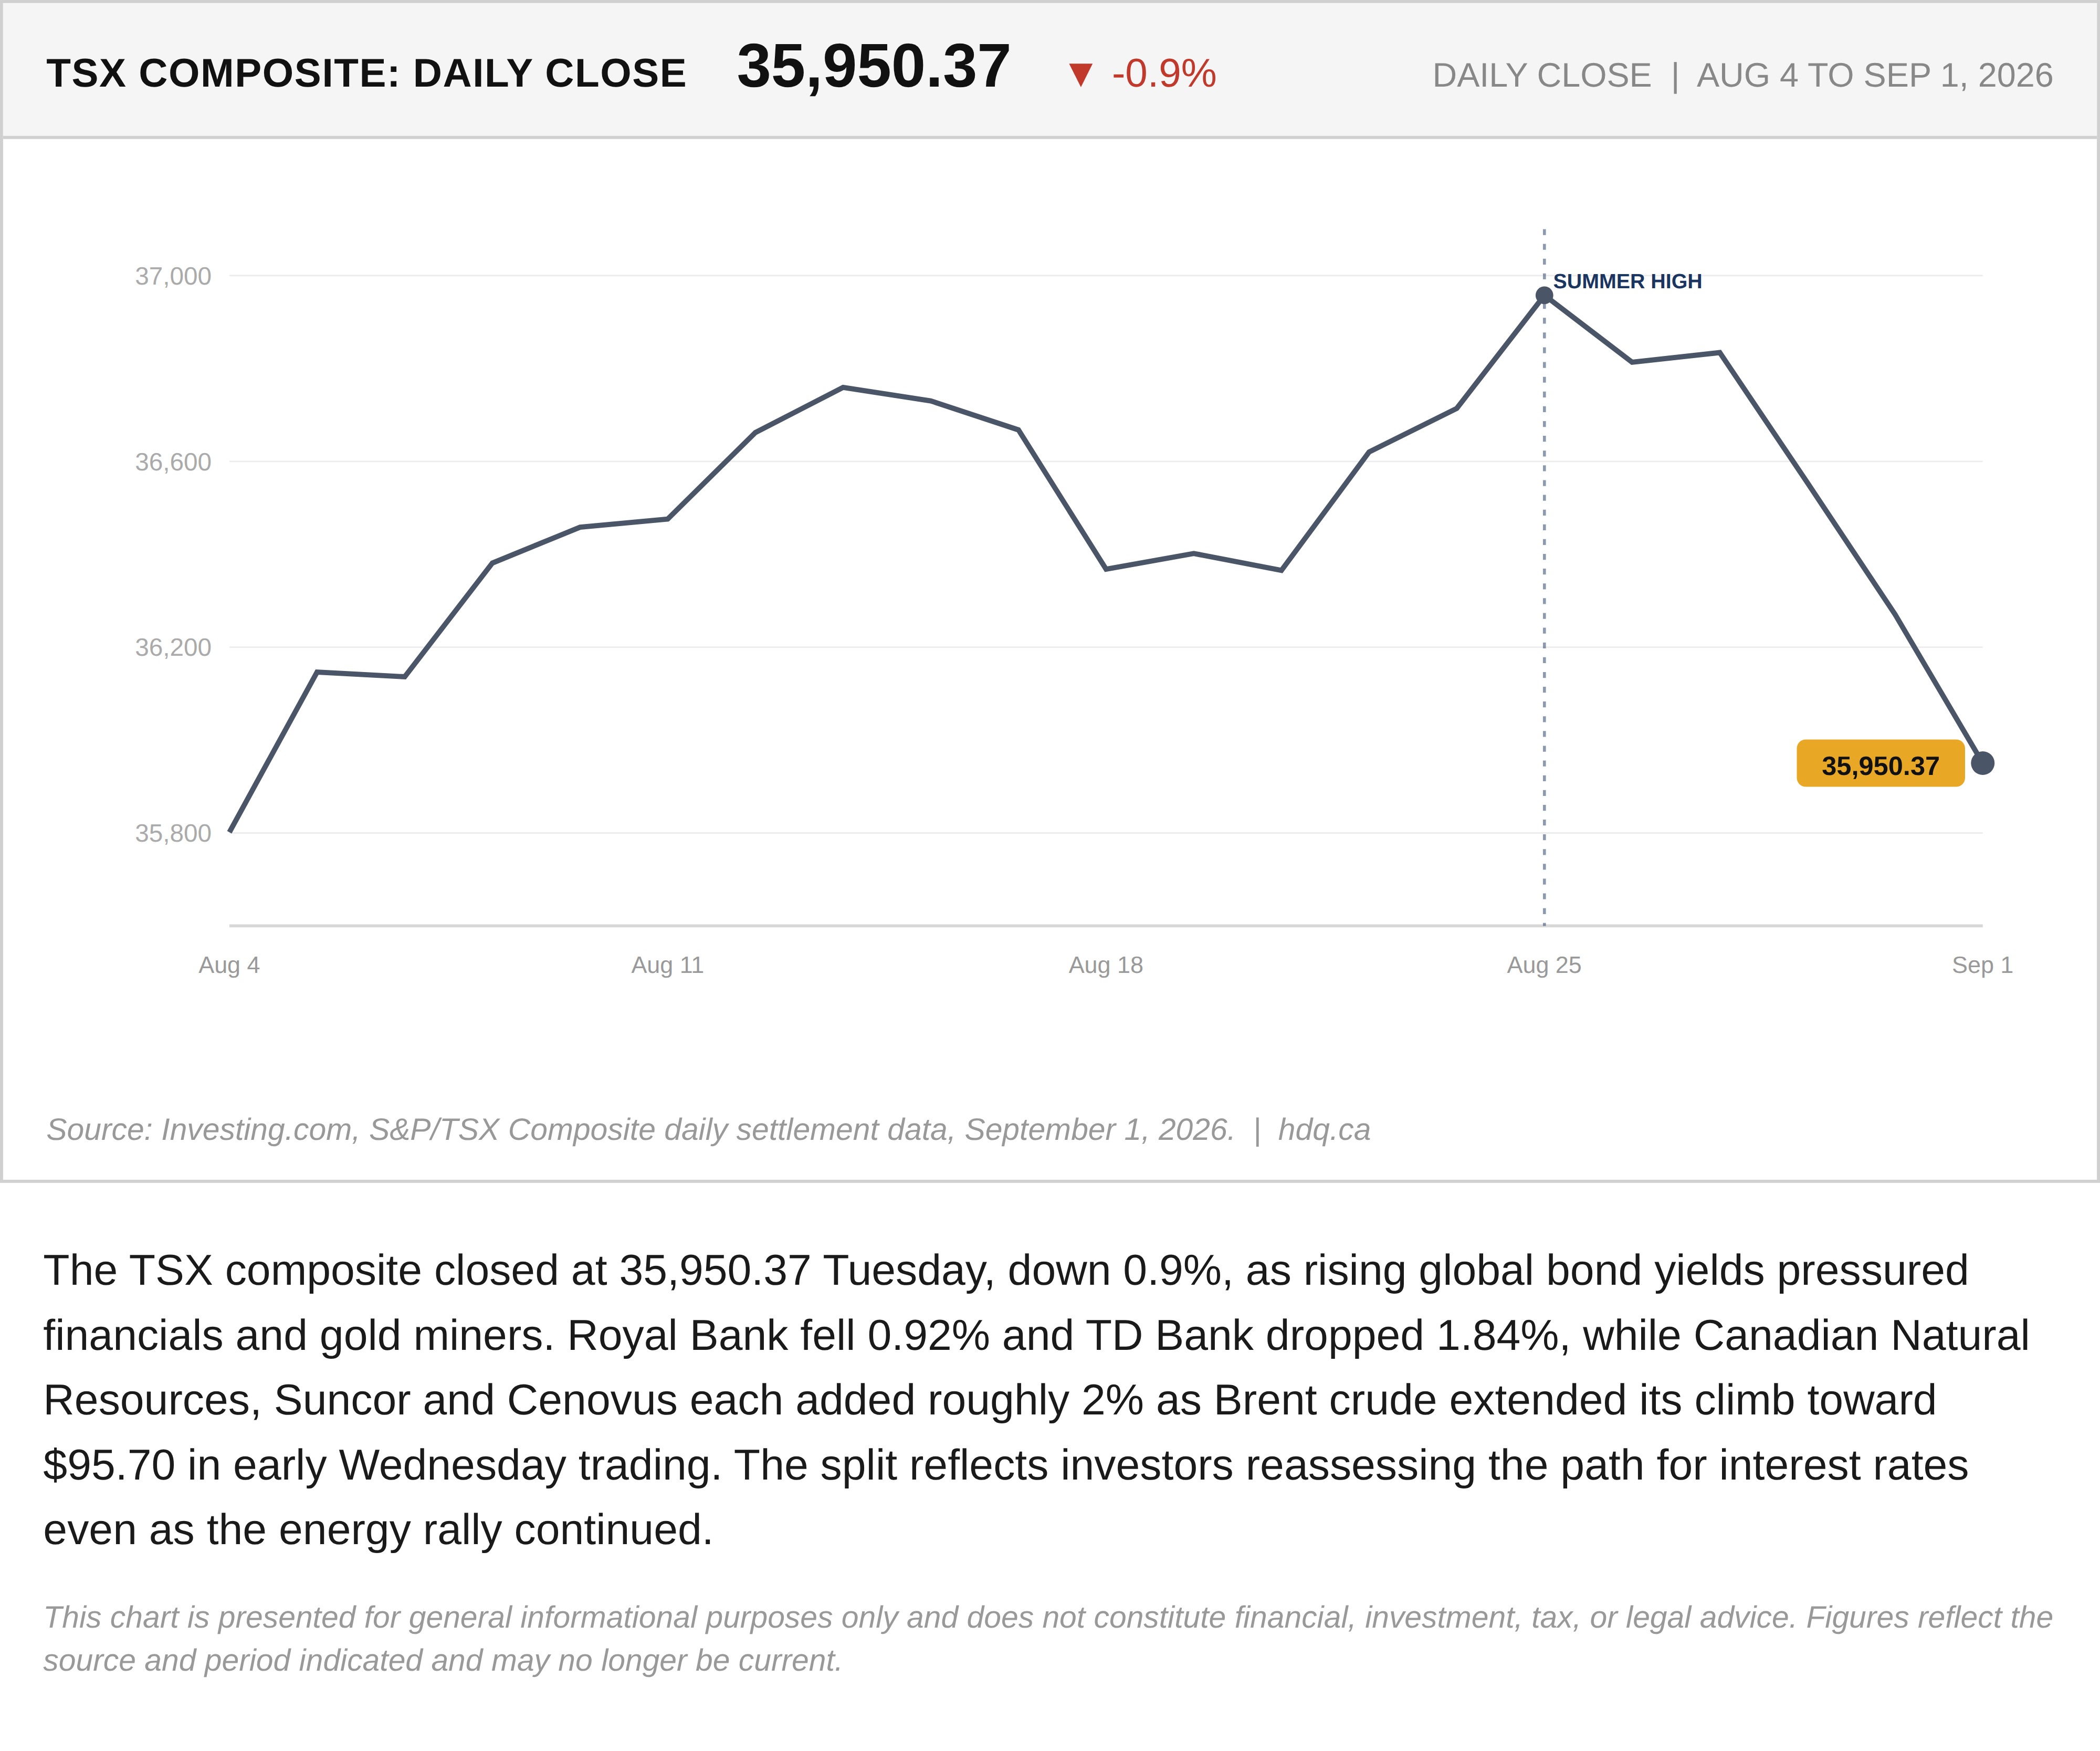
The TSX composite closed at 35,950.37 Tuesday, down 0.9%, as rising global bond yields pressured financials and gold miners. Royal Bank fell 0.92% and TD Bank dropped 1.84%, while Canadian Natural Resources, Suncor and Cenovus each added roughly 2% as Brent crude extended its climb toward $95.70 in early Wednesday trading. The split reflects investors reassessing the path for interest rates even as the energy rally continued.
This chart is presented for general informational purposes only and does not constitute financial, investment, tax, or legal advice. Figures reflect the source and period indicated and may no longer be current.
Related charts
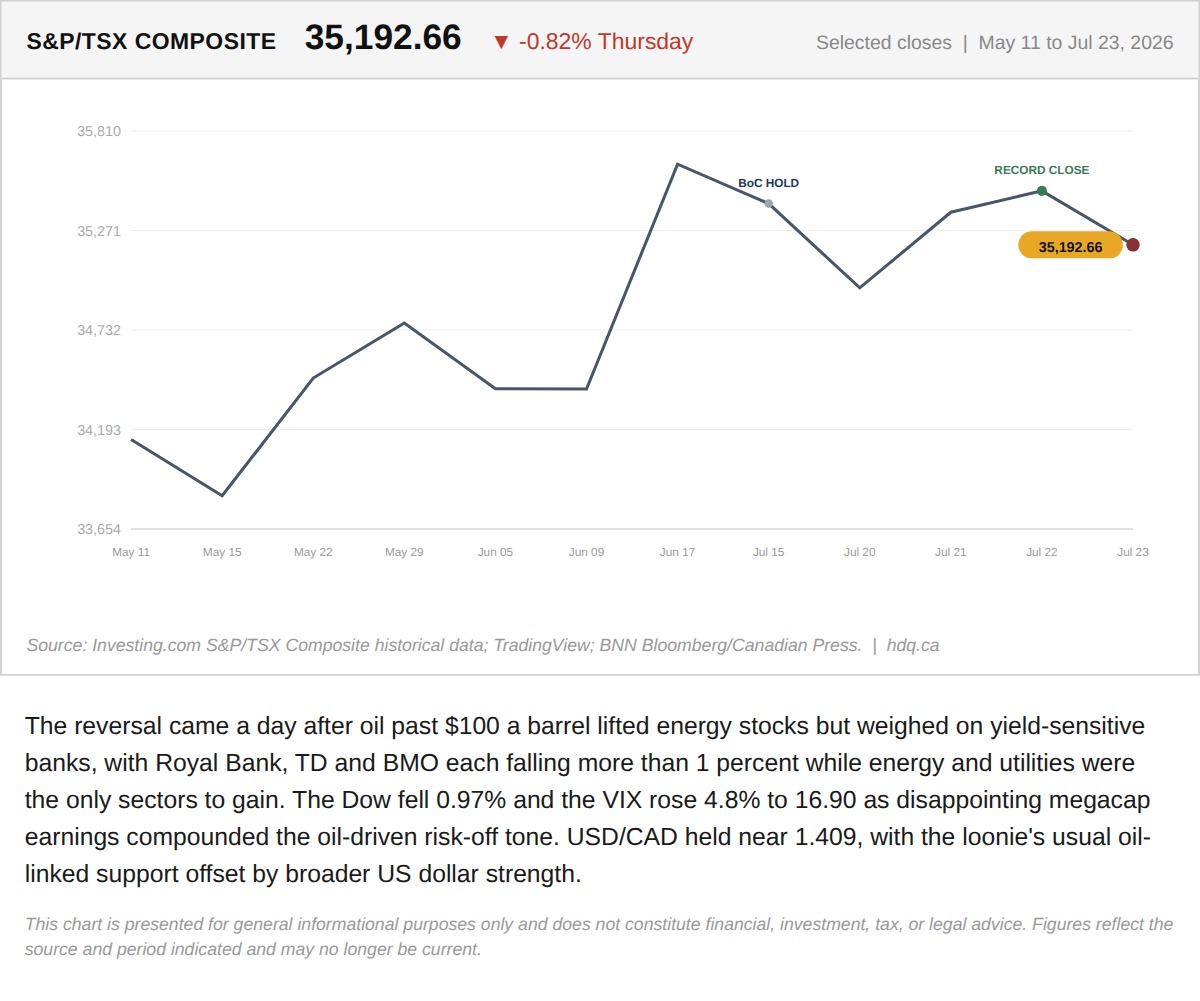
The reversal came a day after oil past $100 a barrel lifted energy stocks but weighed on yield-sensitive banks, with Royal Bank, TD and BMO…
Record High, Then a Bank-Led Reversal: Inside Thursday's TSX Split
July 24, 2026
View chart & download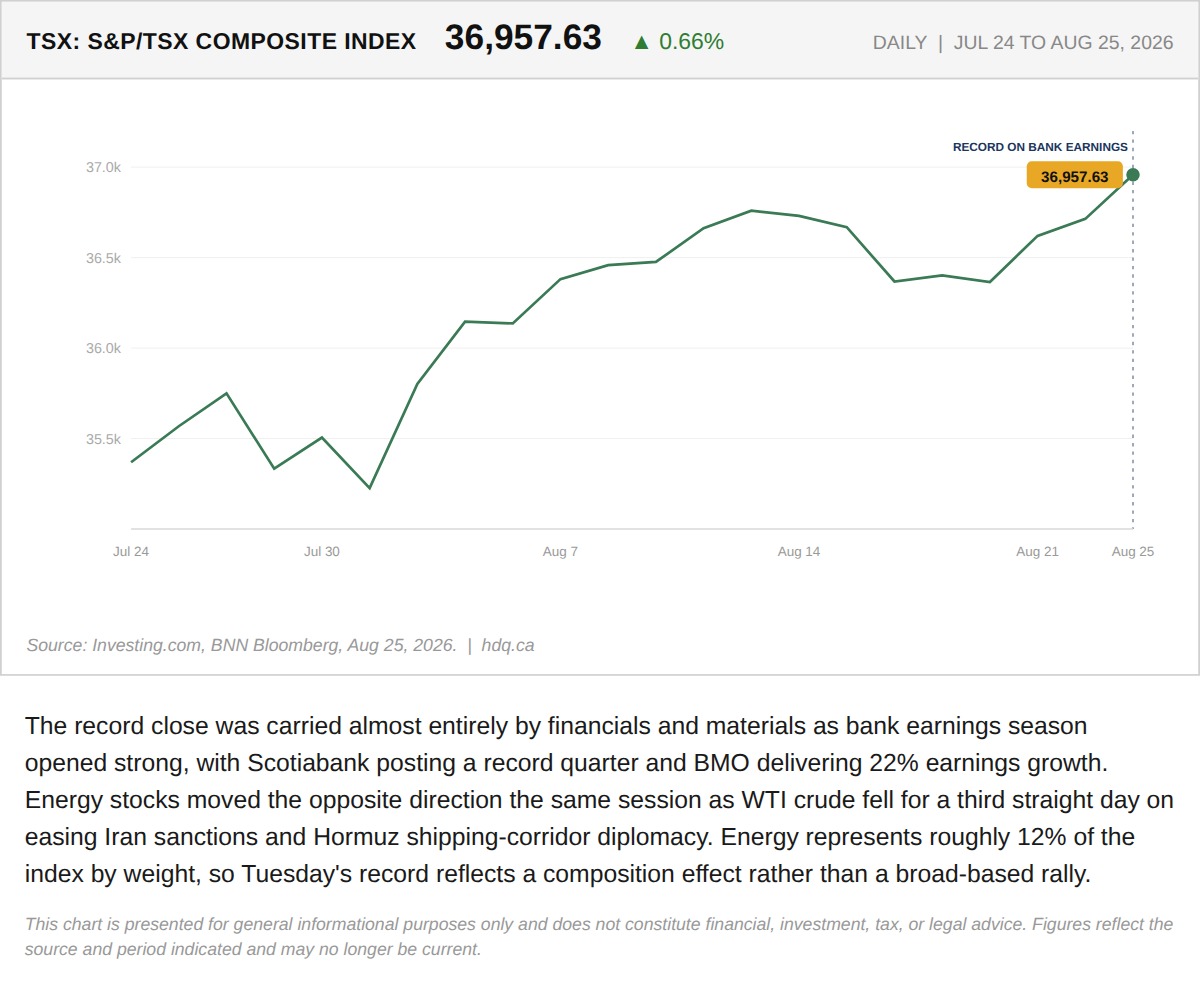
The record close was carried almost entirely by financials and materials as bank earnings season opened strong, with Scotiabank posting a…
The TSX Hit a Record High Tuesday. Only Two Sectors Actually Showed Up.
August 26, 2026
View chart & download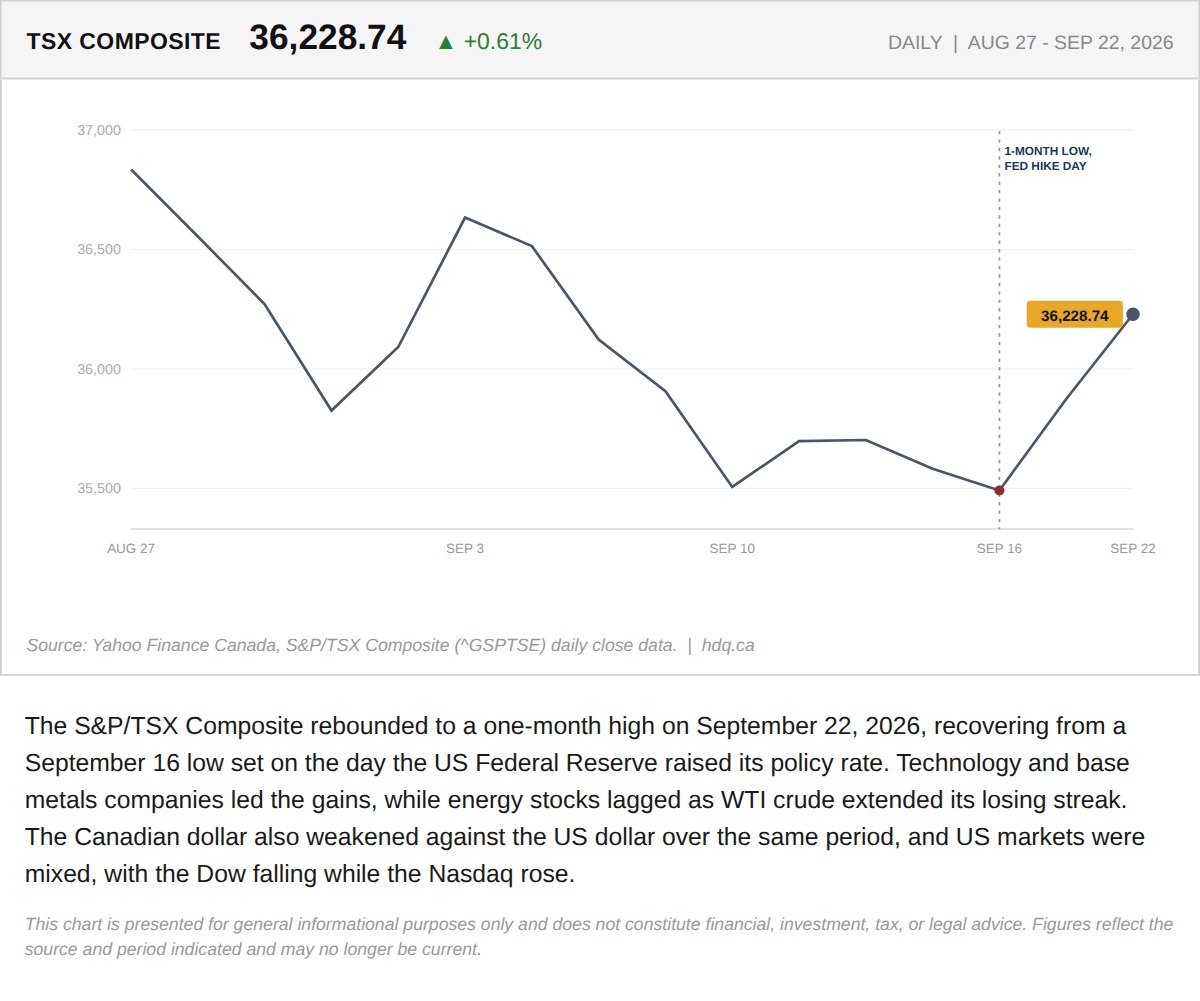
The S&P/TSX Composite rebounded to a one-month high on September 22, 2026, recovering from a September 16 low set on the day the US Federal Reserve raised its policy rate.
The TSX Hit a One-Month High on Tech and Base Metals While Energy Keeps Falling
September 23, 2026
View chart & download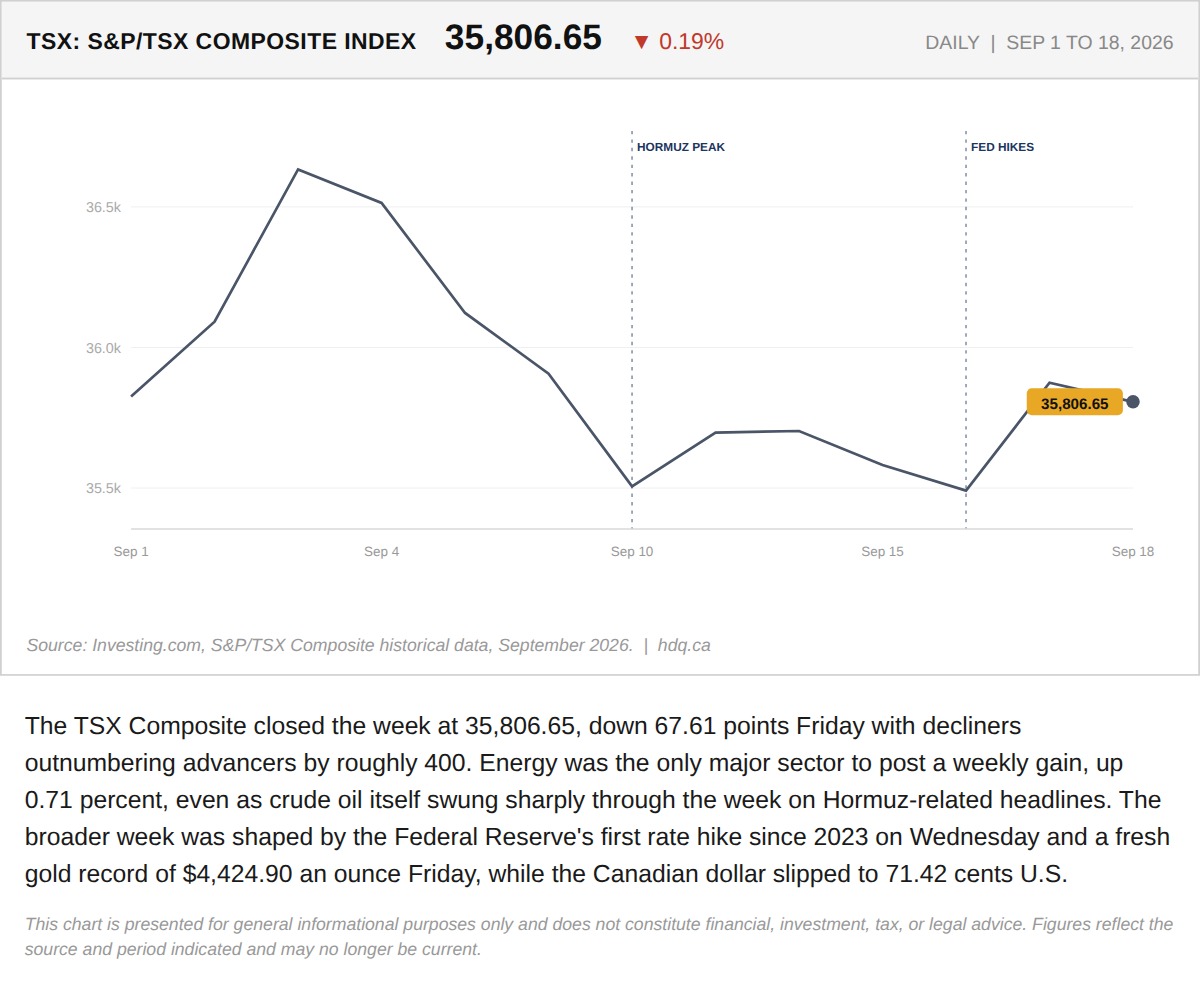
The TSX Composite closed the week at 35,806.65, down 67.61 points Friday with decliners outnumbering advancers by roughly 400.
The TSX Closed a Volatile Week at 35,806.65. Energy Was the Only Sector That Actually Held.
September 21, 2026
View chart & download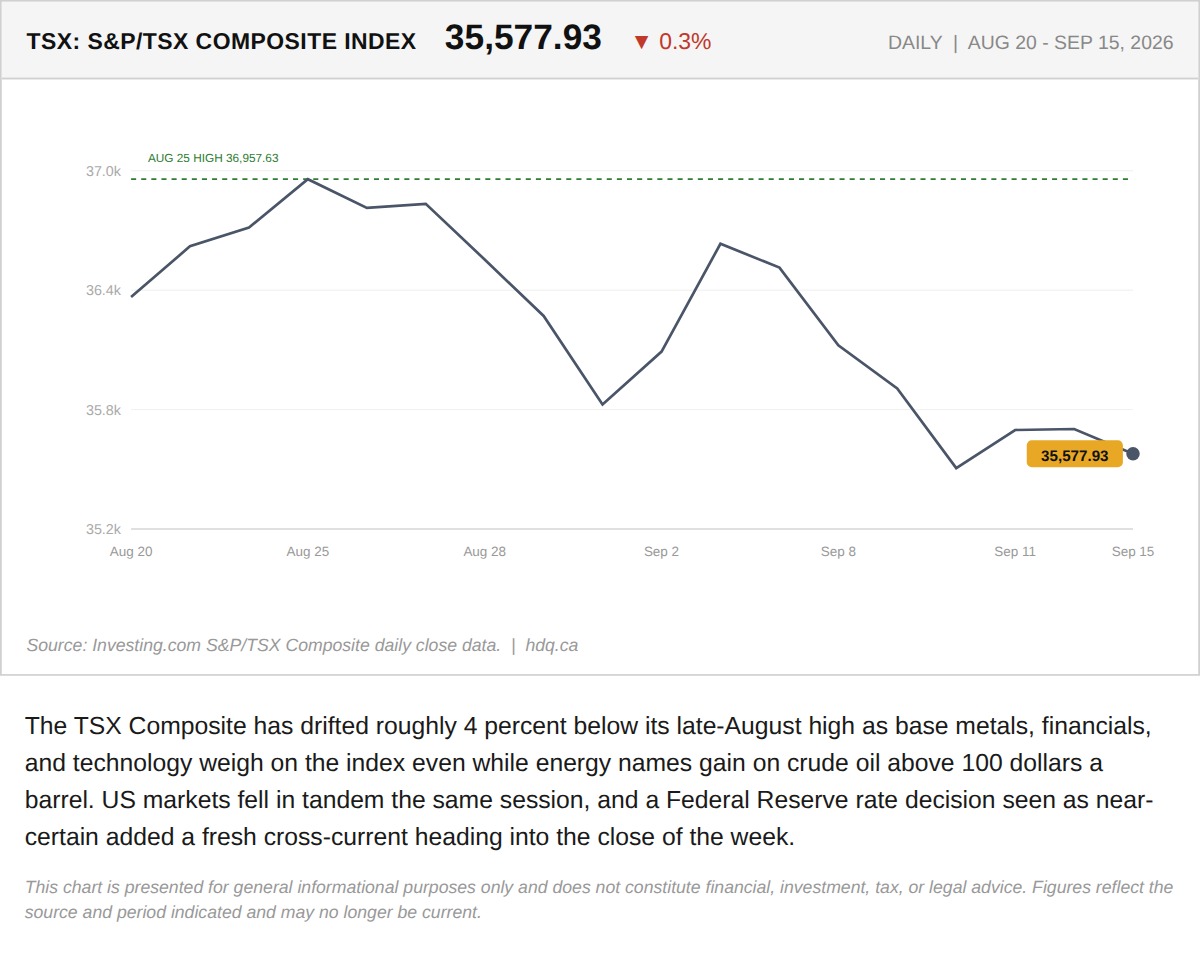
The TSX Composite has drifted roughly 4 percent below its late-August high as base metals, financials, and technology weigh on the index…
The TSX Cannot Decide Between Energy and Everything Else
September 16, 2026
View chart & download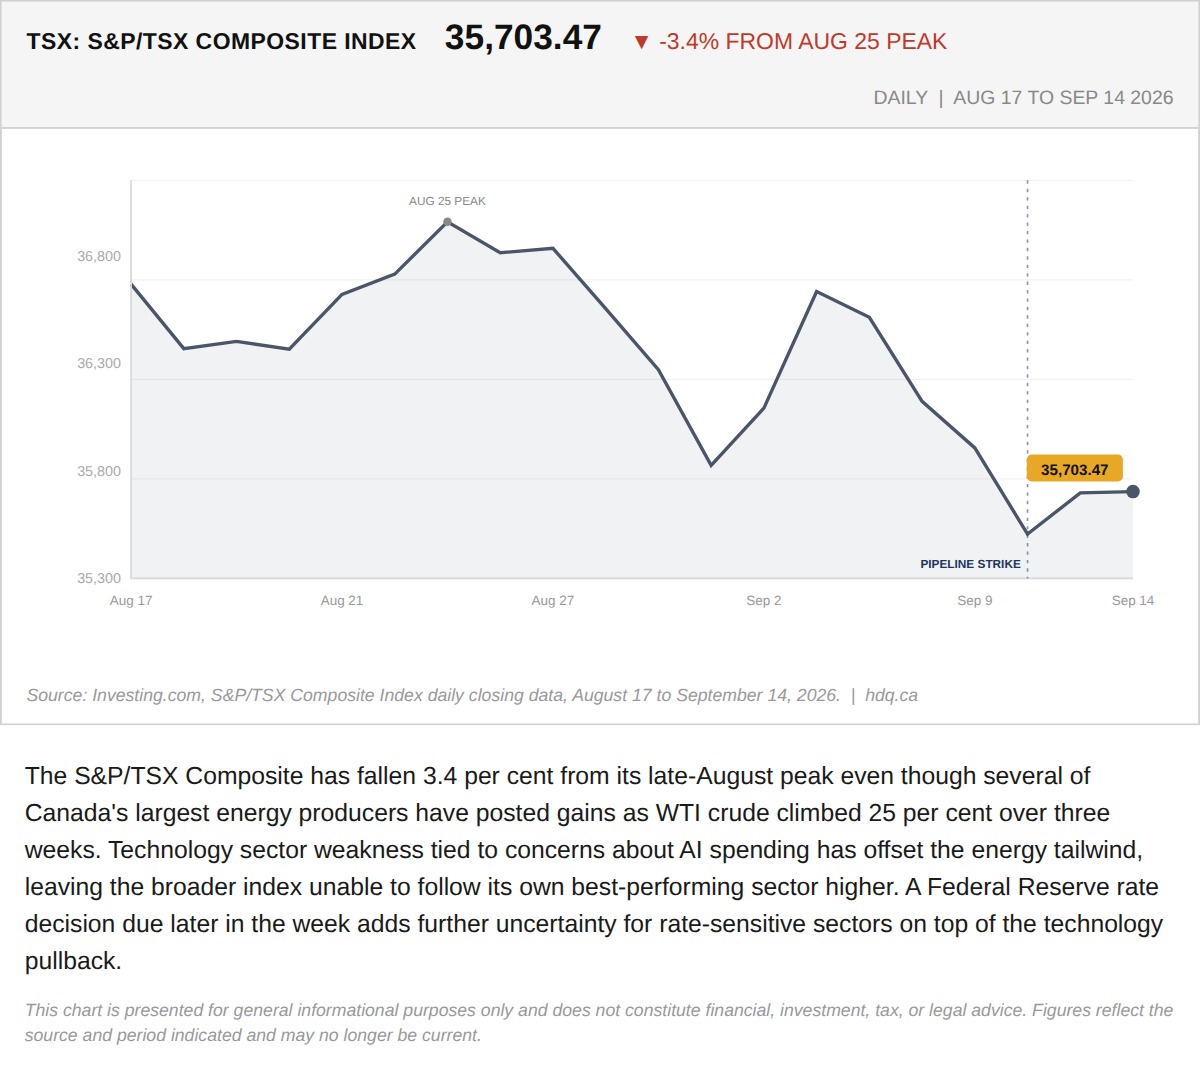
The S&P/TSX Composite has fallen 3.4 per cent from its late-August peak even though several of Canada's largest energy producers have…
TSX Composite Down 3.4% From Its August Peak, Even With Energy Stocks Leading the Market Higher
September 15, 2026
View chart & download