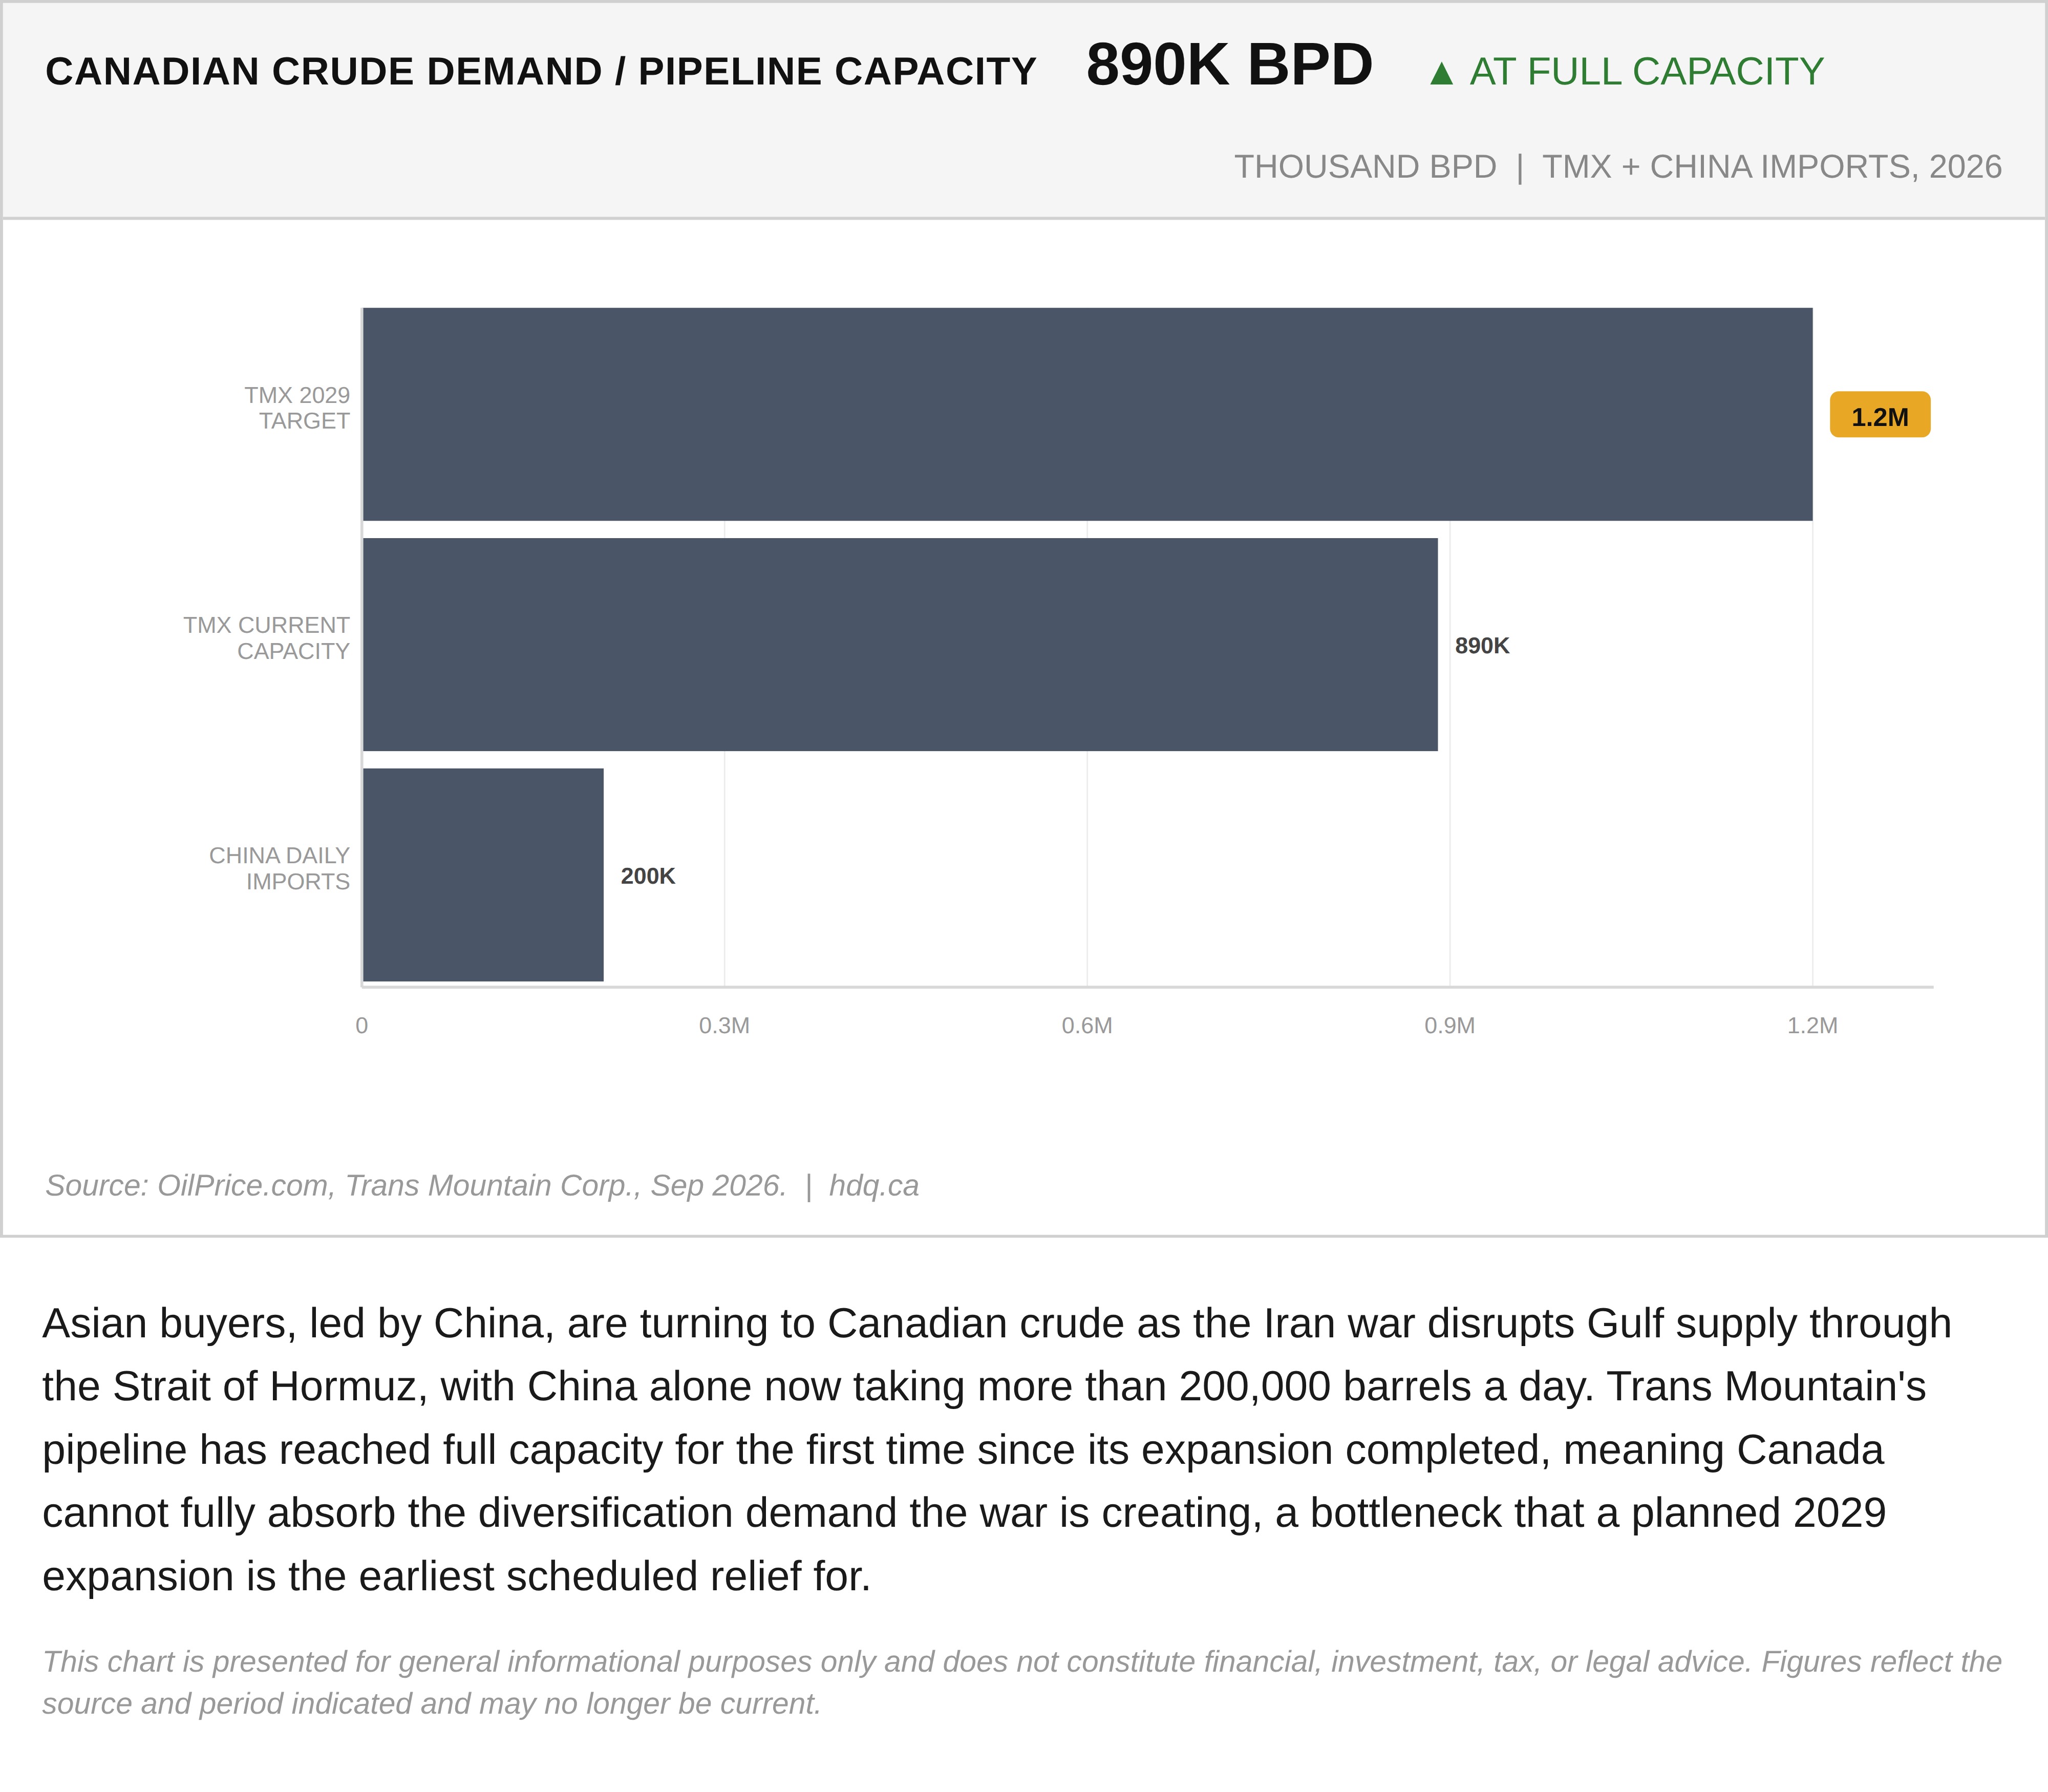
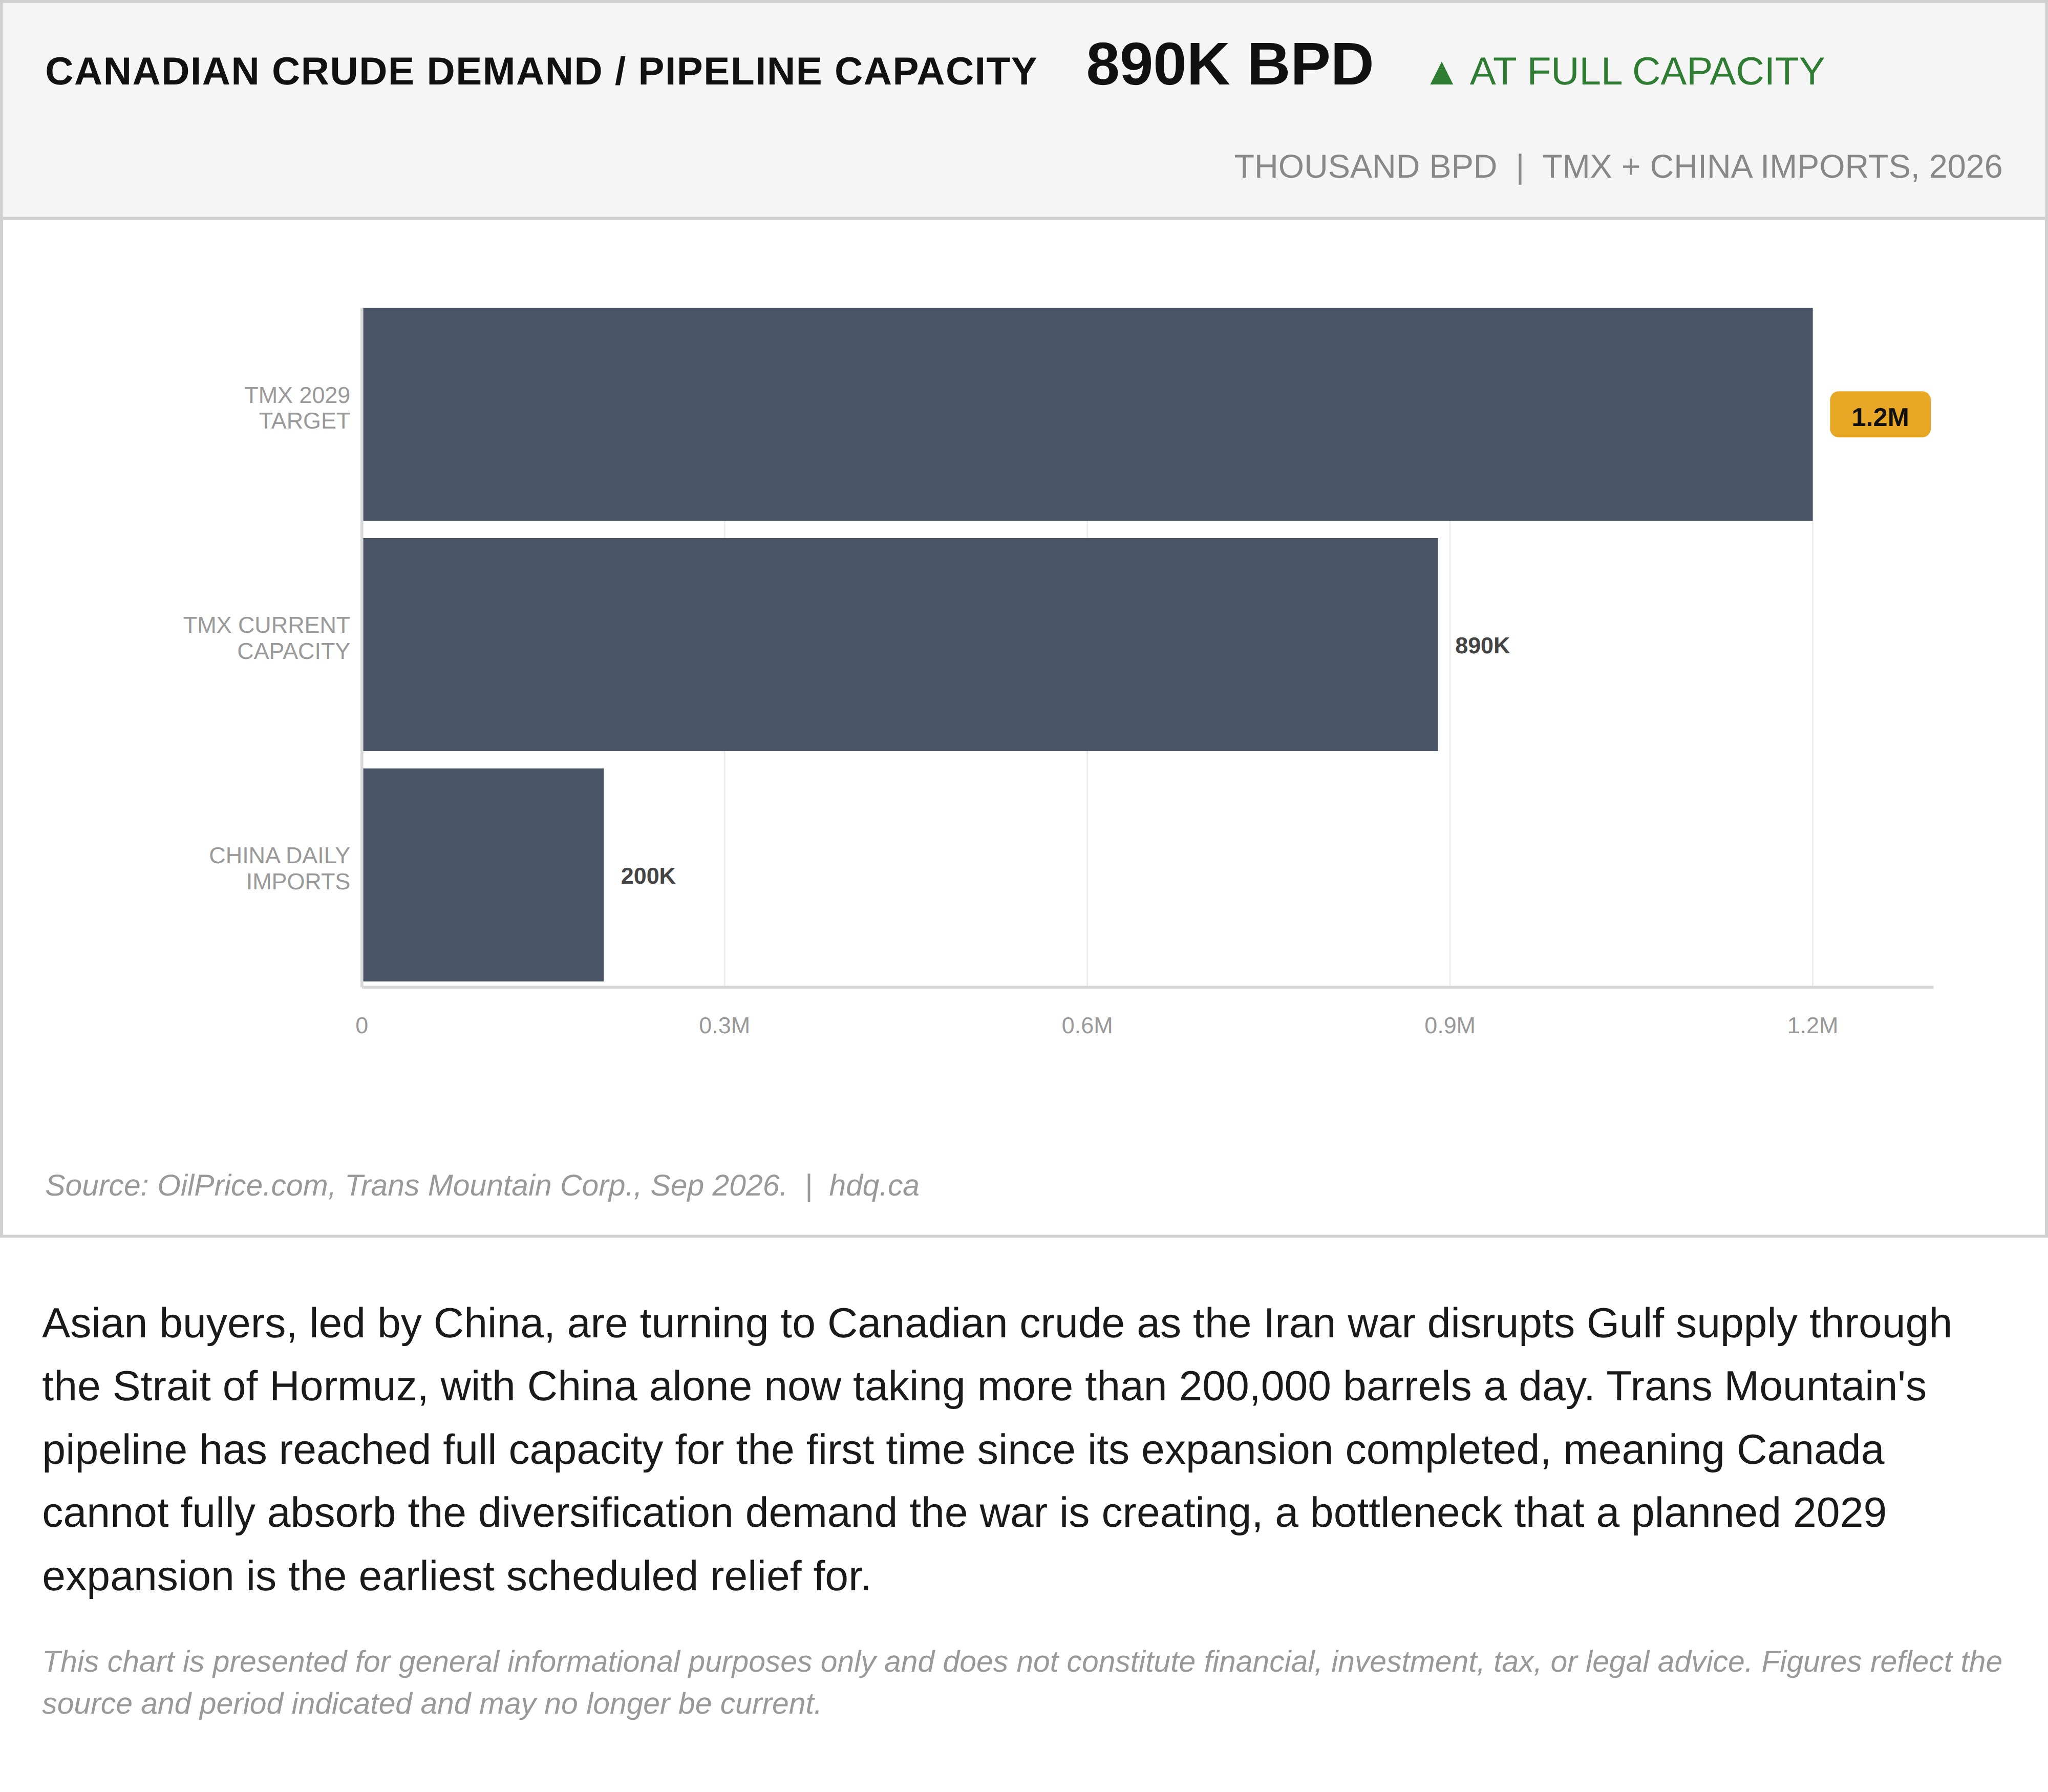
Asian buyers, led by China, are turning to Canadian crude as the Iran war disrupts Gulf supply through the Strait of Hormuz, with China alone now taking more than 200,000 barrels a day. Trans Mountain's pipeline has reached full capacity for the first time since its expansion completed, meaning Canada cannot fully absorb the diversification demand the war is creating, a bottleneck that a planned 2029 expansion is the earliest scheduled relief for.
This chart is presented for general informational purposes only and does not constitute financial, investment, tax, or legal advice. Figures reflect the source and period indicated and may no longer be current.
Related charts
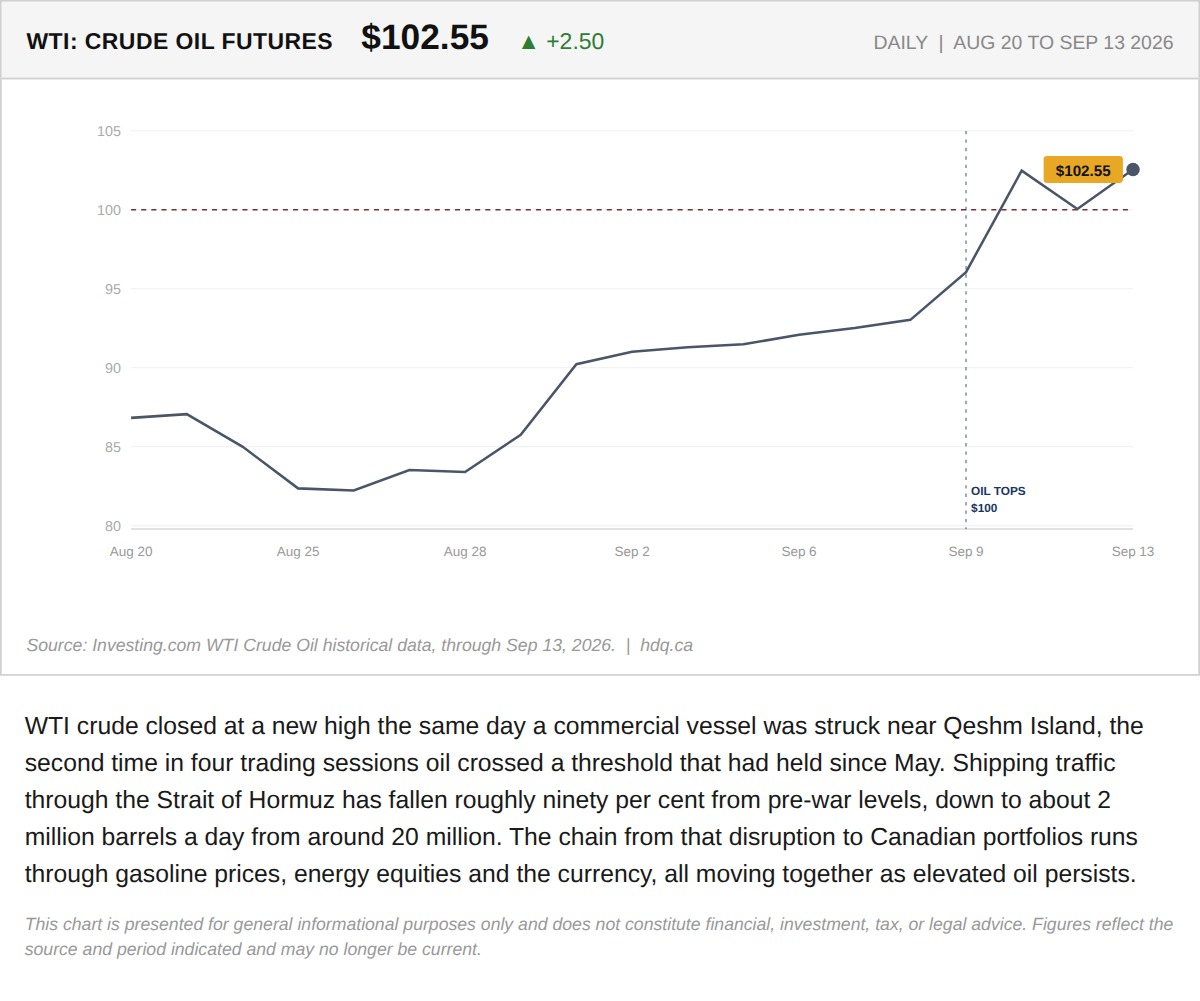
WTI crude closed at a new high the same day a commercial vessel was struck near Qeshm Island, the second time in four trading sessions oil…
A Tanker Strike Near Qeshm Island Confirms Oil Above $100 Is Not a Blip
September 14, 2026
View chart & download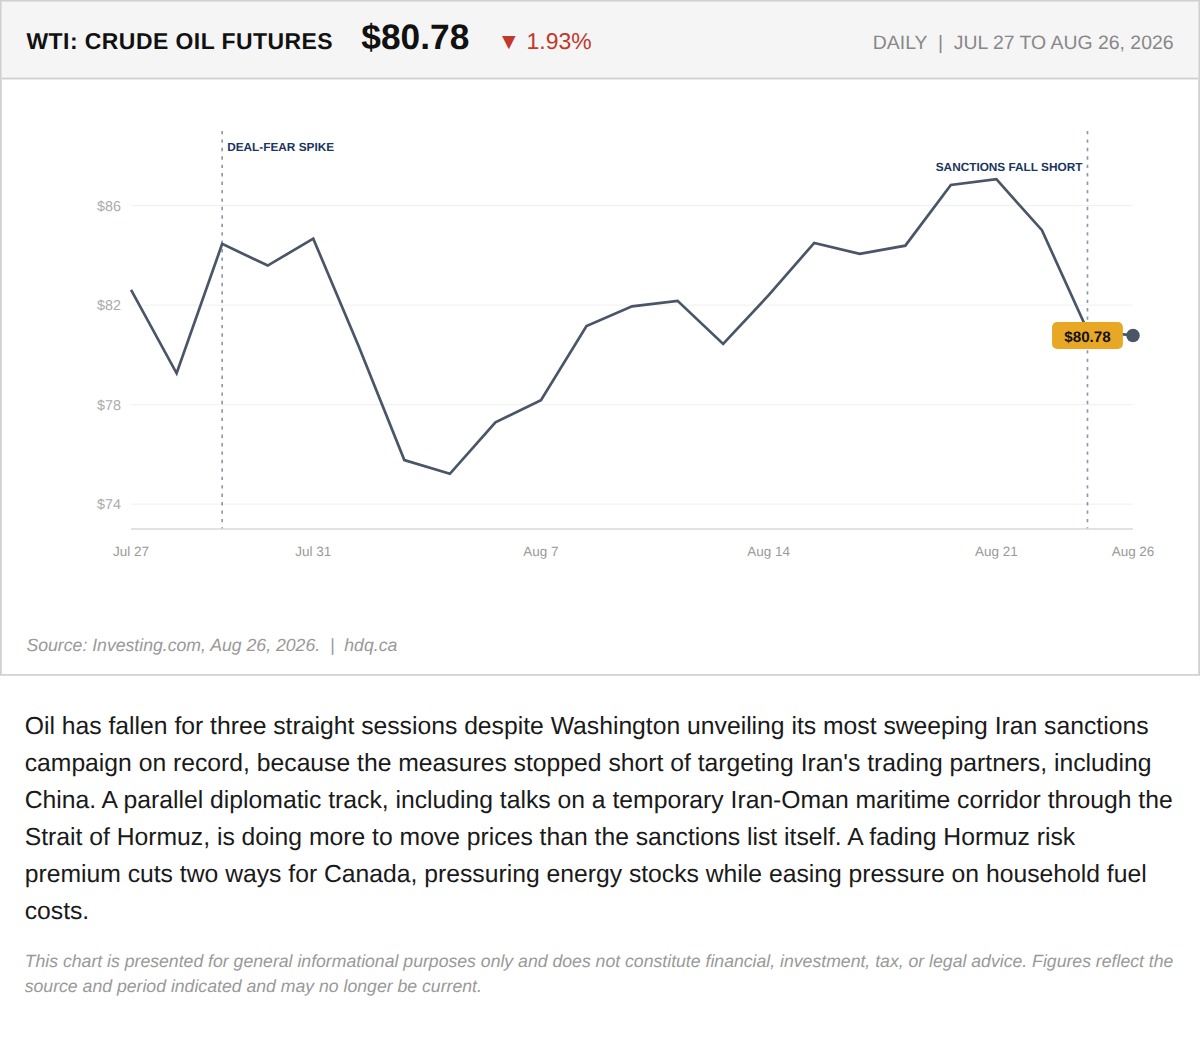
Oil has fallen for three straight sessions despite Washington unveiling its most sweeping Iran sanctions campaign on record, because the…
August 26, 2026
View chart & download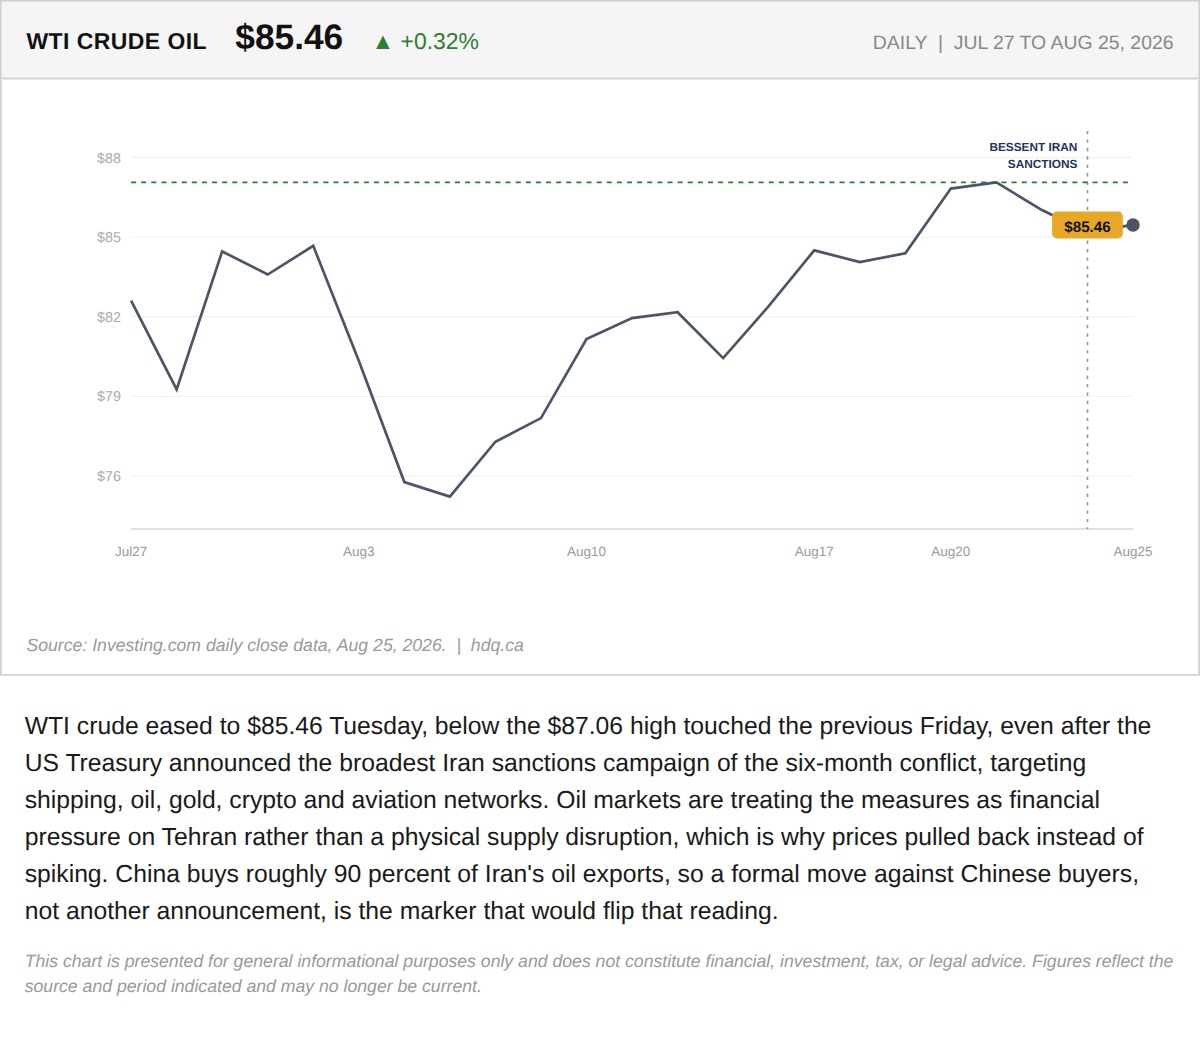
WTI crude eased to $85.46 Tuesday, below the $87.06 high touched the previous Friday, even after the US Treasury announced the broadest…
Why WTI Eased After Washington's Toughest Iran Sanctions Yet
August 25, 2026
View chart & download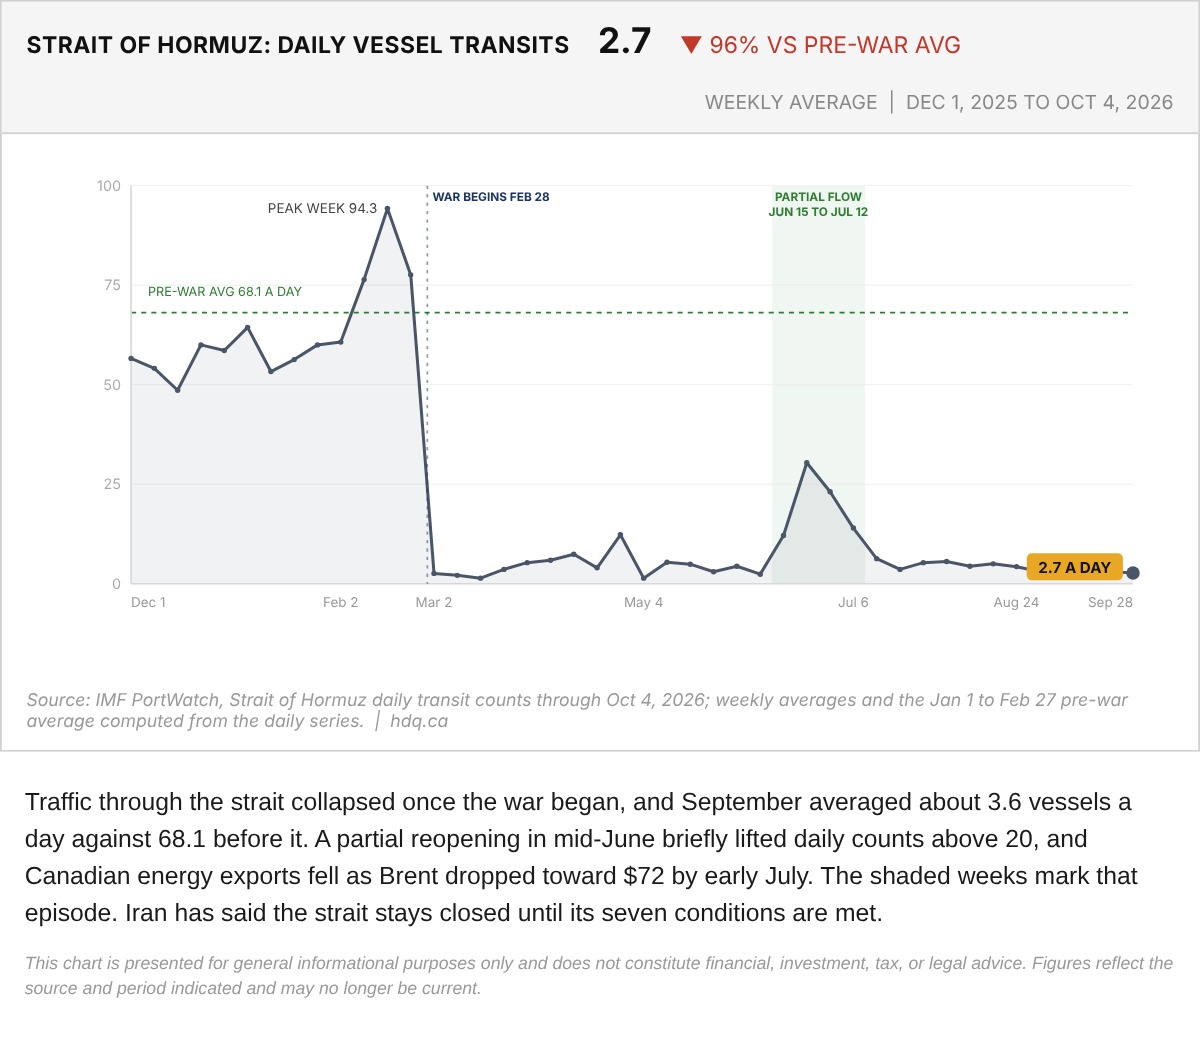
Traffic through the strait collapsed once the war began, and September averaged about 3.6 vessels a day against 68.1 before it.
Strait of Hormuz Weekly Average Vessel Transits, December 2025 to October 2026
October 7, 2026
View chart & download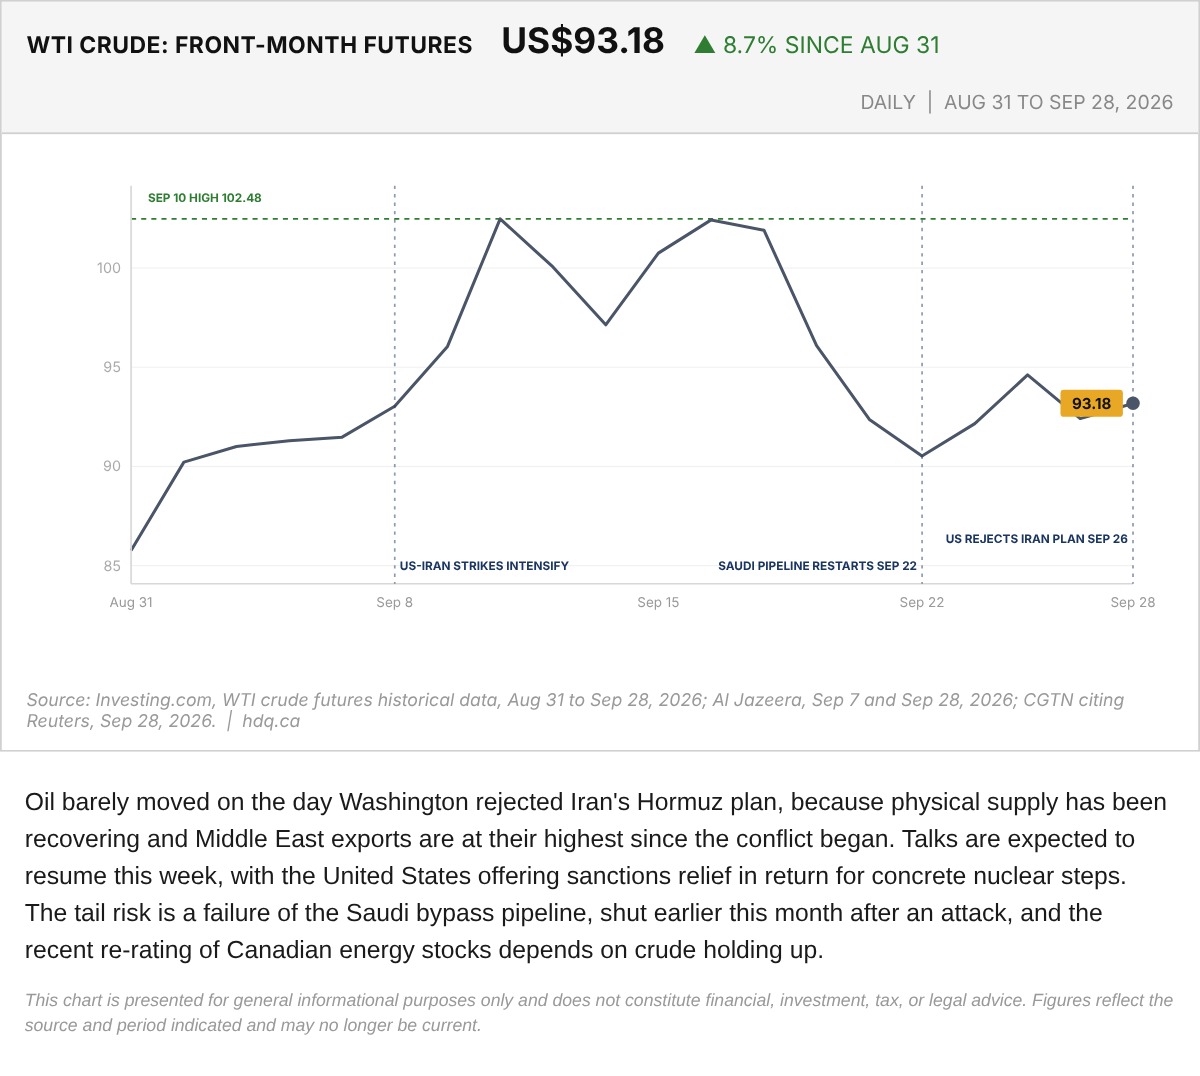
Oil barely moved on the day Washington rejected Iran's Hormuz plan, because physical supply has been recovering and Middle East exports are at their highest since the conflict began.
WTI Crude Oil Front-Month Futures, August 31 to September 28, 2026
September 29, 2026
View chart & download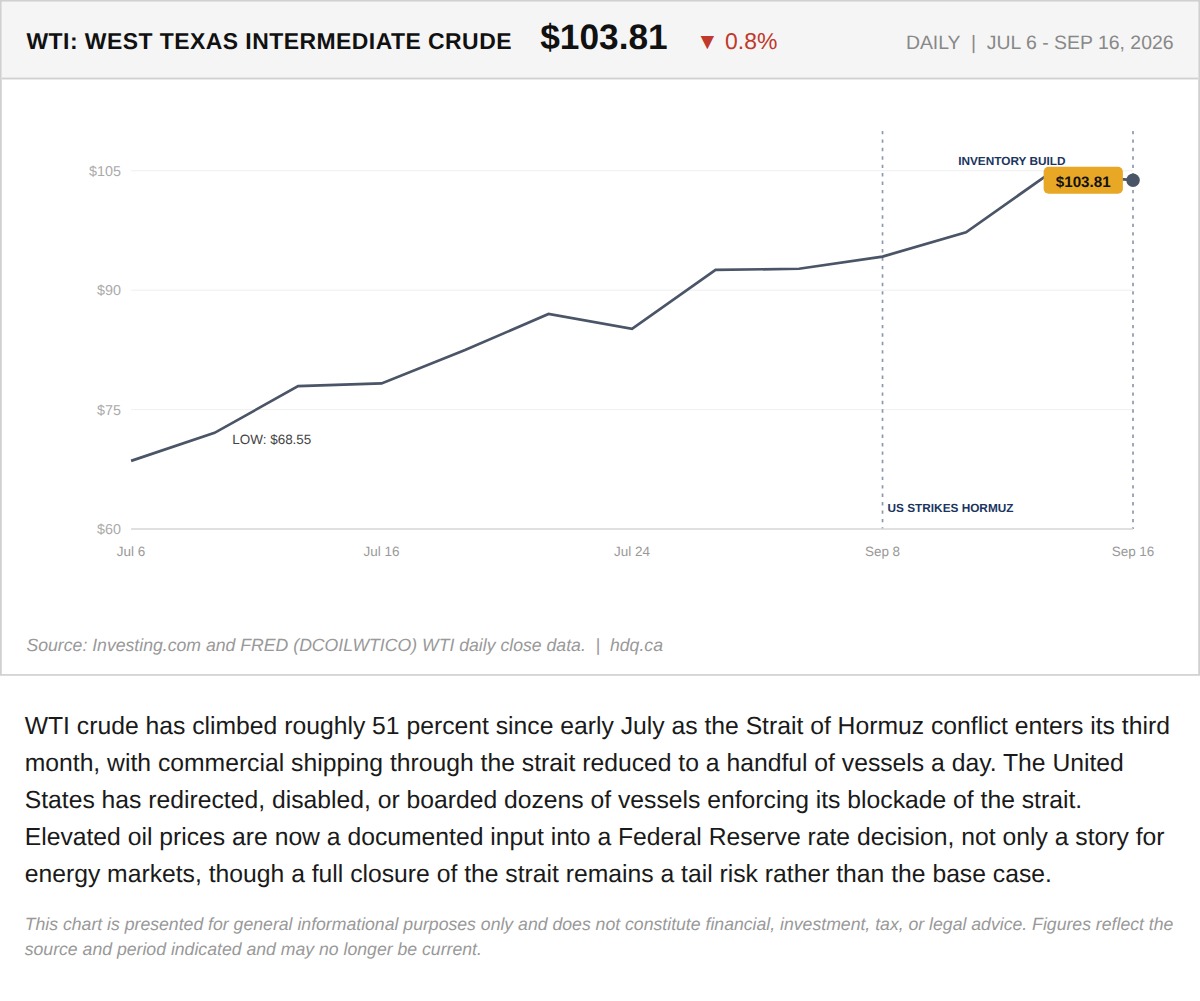
WTI crude has climbed roughly 51 percent since early July as the Strait of Hormuz conflict enters its third month, with commercial shipping…
Why a War in the Strait of Hormuz Is Steering a Federal Reserve Decision
September 16, 2026
View chart & download