September 2026
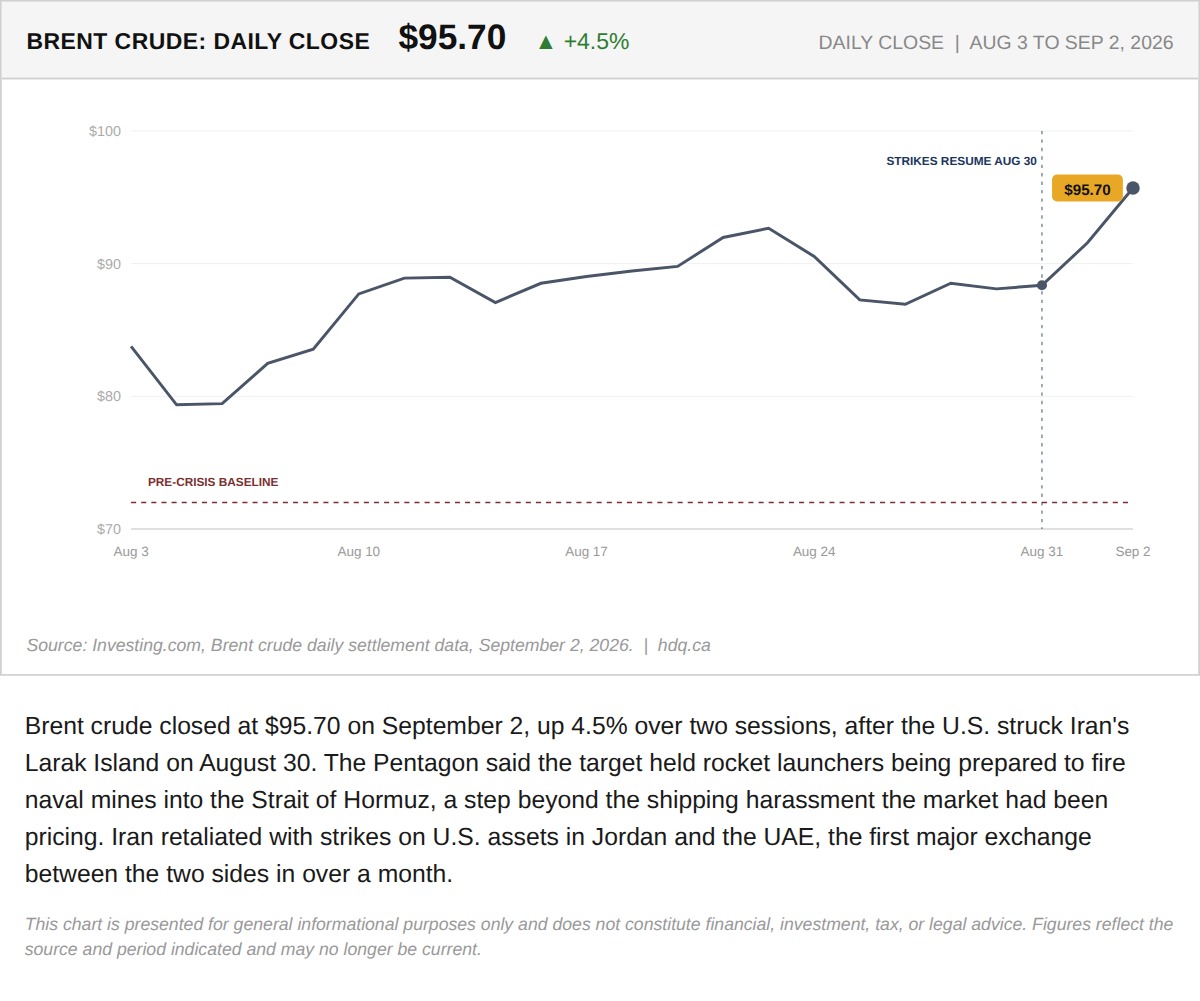
Brent crude closed at $95.70 on September 2, up 4.5% over two sessions, after the U.S.
Brent Crude Rallies 4.5% After U.S. Strike on Iran's Larak Island
September 2, 2026
View chart & download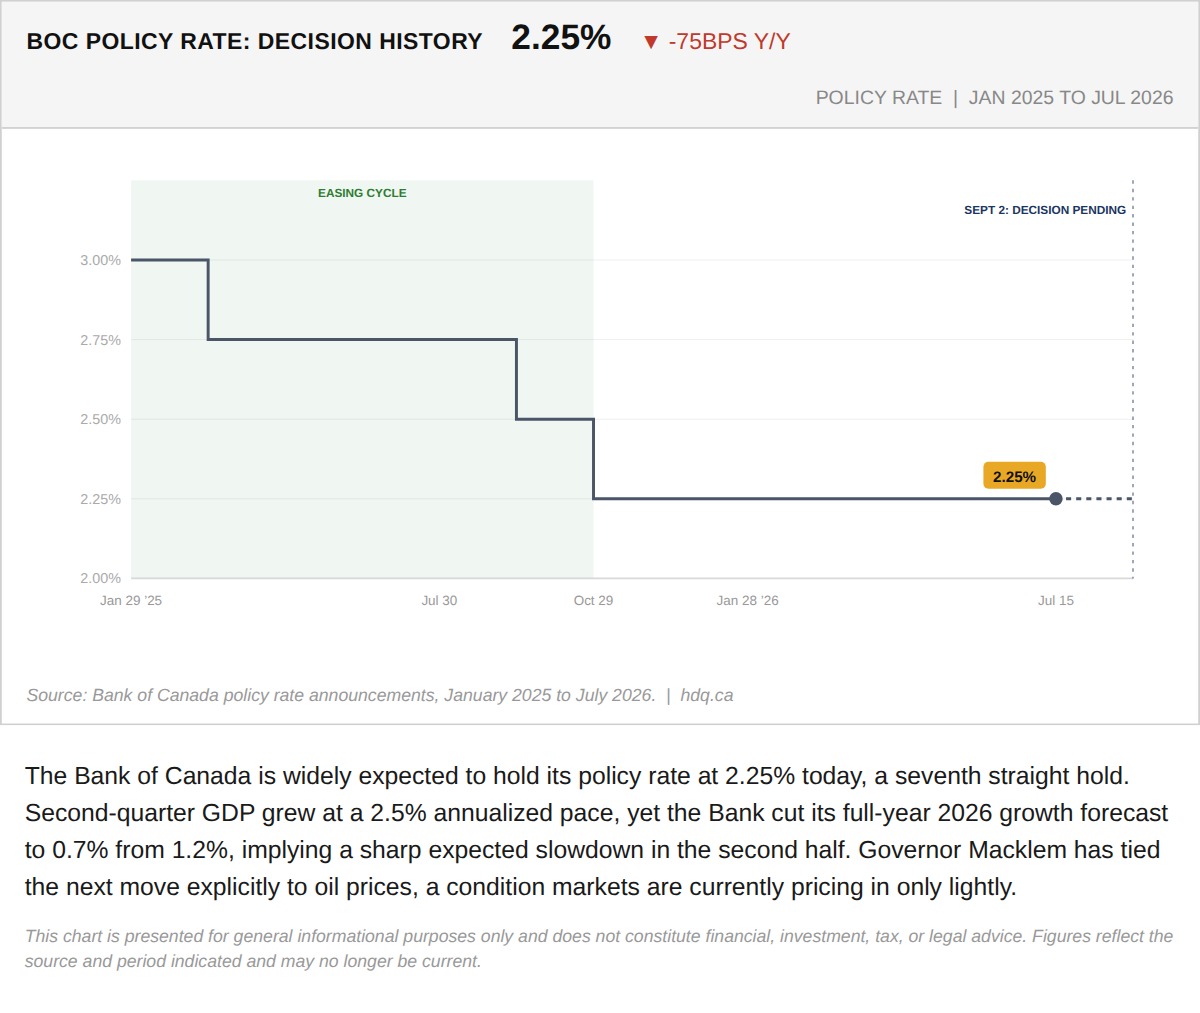
The Bank of Canada is widely expected to hold its policy rate at 2.25% today, a seventh straight hold.
Bank of Canada Holds at 2.25% for a Seventh Straight Decision
September 2, 2026
View chart & download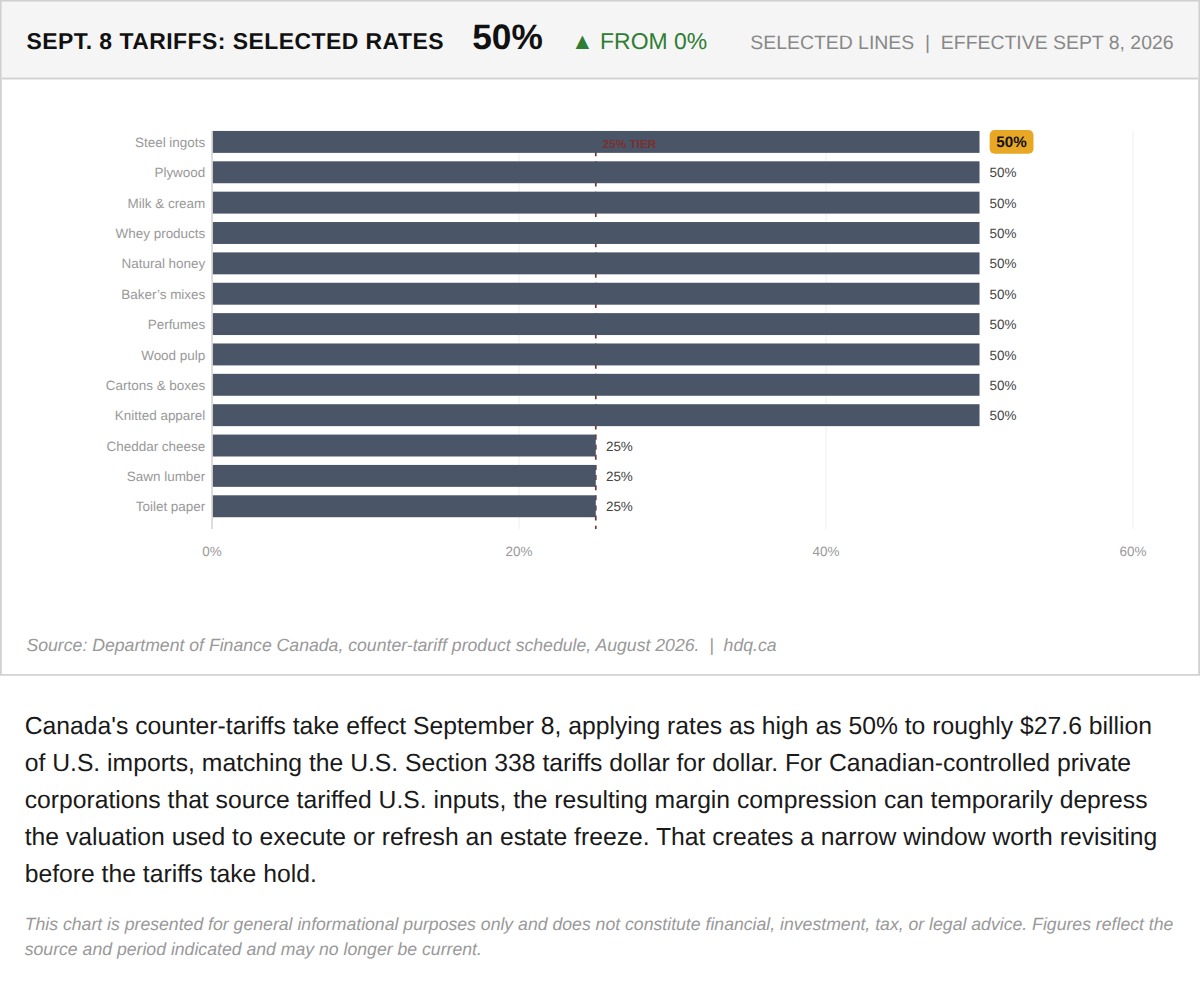
Canada's counter-tariffs take effect September 8, applying rates as high as 50% to roughly $27.6 billion of U.S.
Canada's September 8 Counter-Tariffs Reach 50% on Selected U.S. Import Lines
September 2, 2026
View chart & download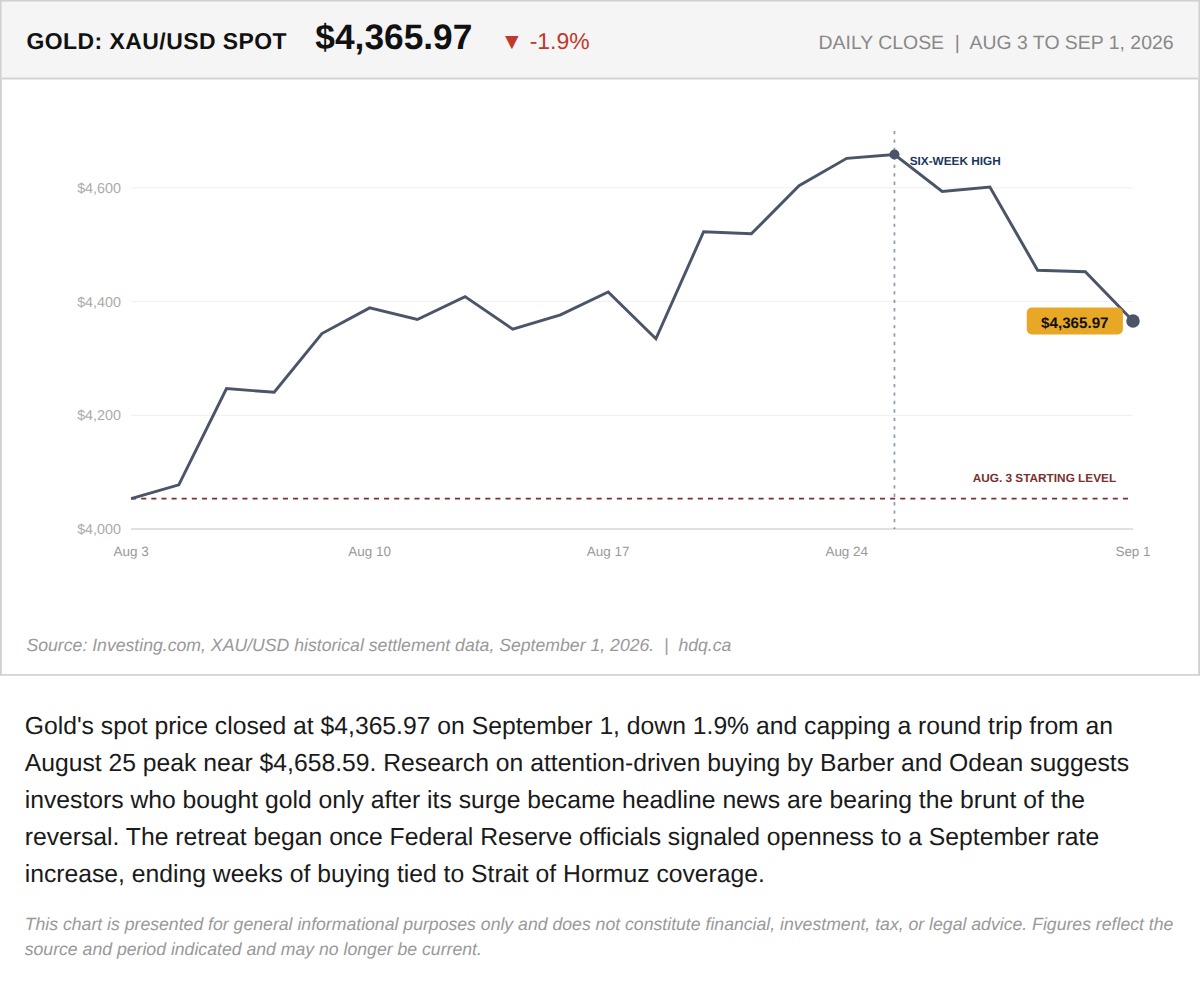
Gold's spot price closed at $4,365.97 on September 1, down 1.9% and capping a round trip from an August 25 peak near $4,658.59.
Gold's Spot Price Pulls Back 1.9% After an Attention-Driven August Surge
September 2, 2026
View chart & download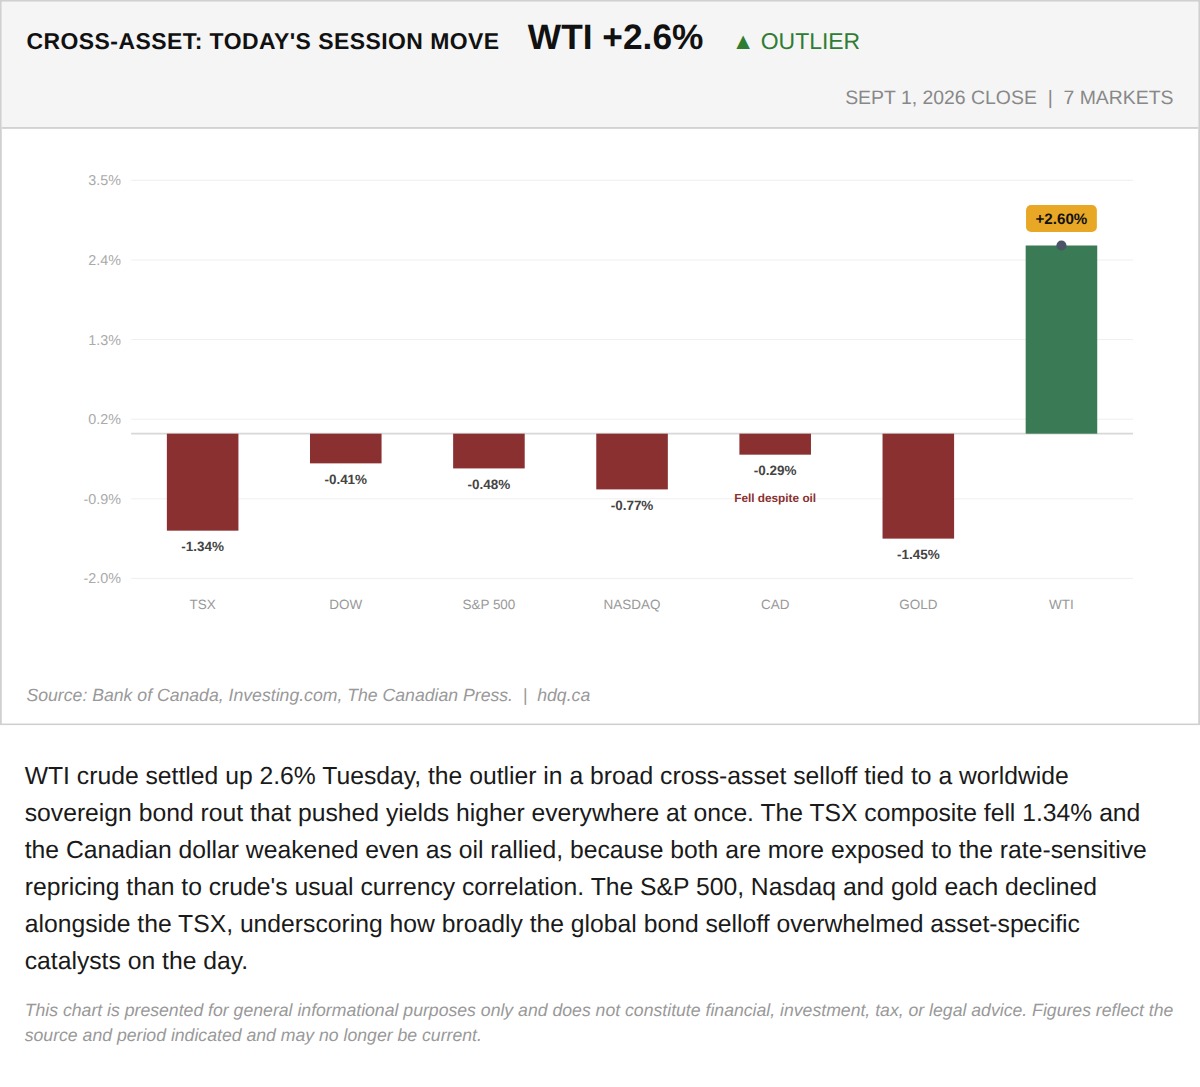
WTI crude settled up 2.6% Tuesday, the outlier in a broad cross-asset selloff tied to a worldwide sovereign bond rout that pushed yields higher everywhere at once.
Oil Rallies While the TSX and Loonie Fall in a Global Bond Selloff
September 1, 2026
View chart & download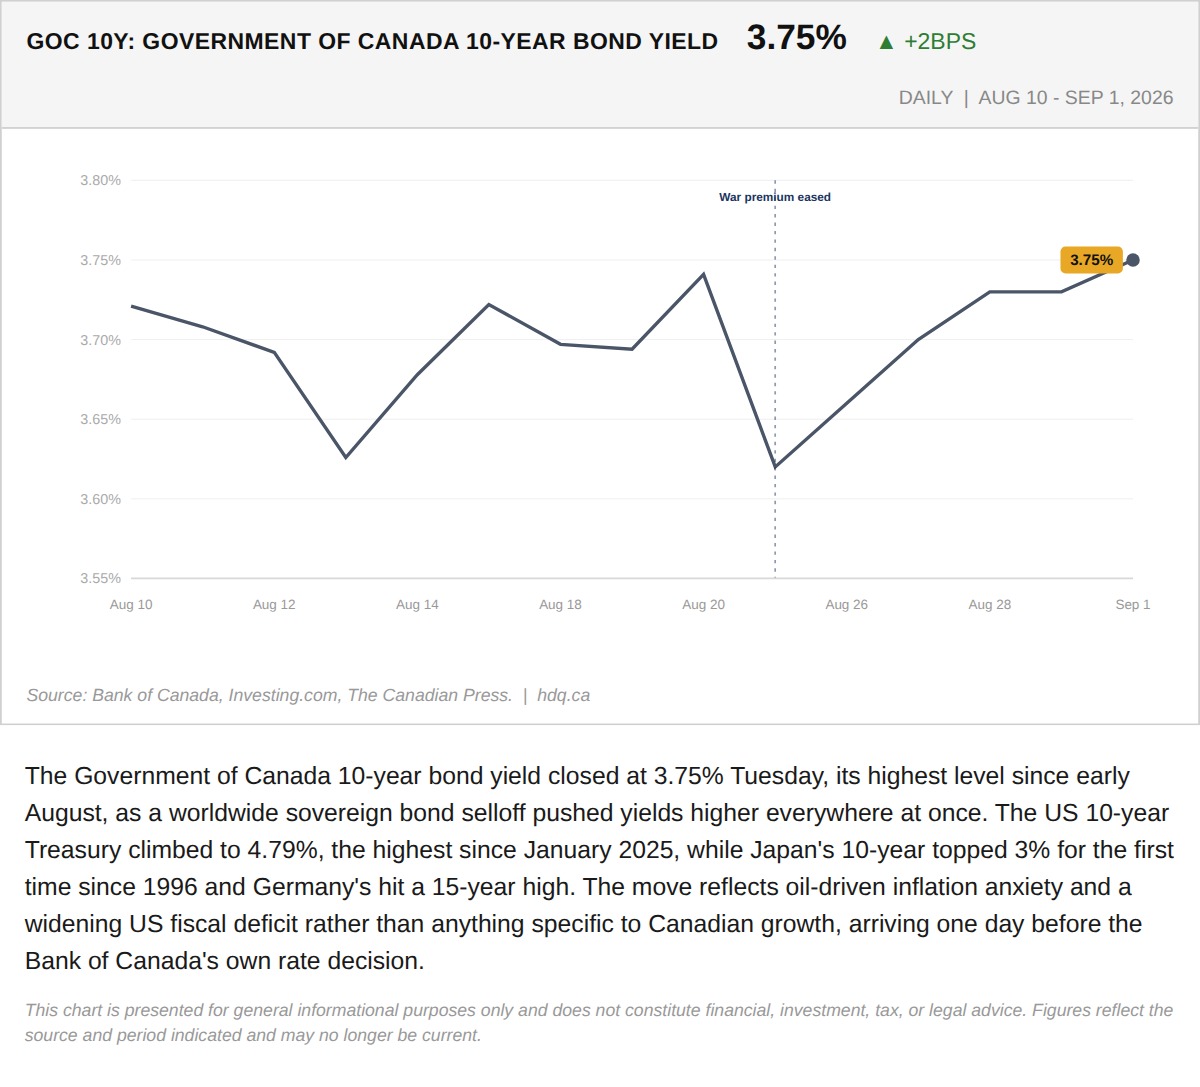
The Government of Canada 10-year bond yield closed at 3.75% Tuesday, its highest level since early August, as a worldwide sovereign bond…
Government of Canada 10-Year Yield Hits Highest Close Since Early August
September 1, 2026
View chart & download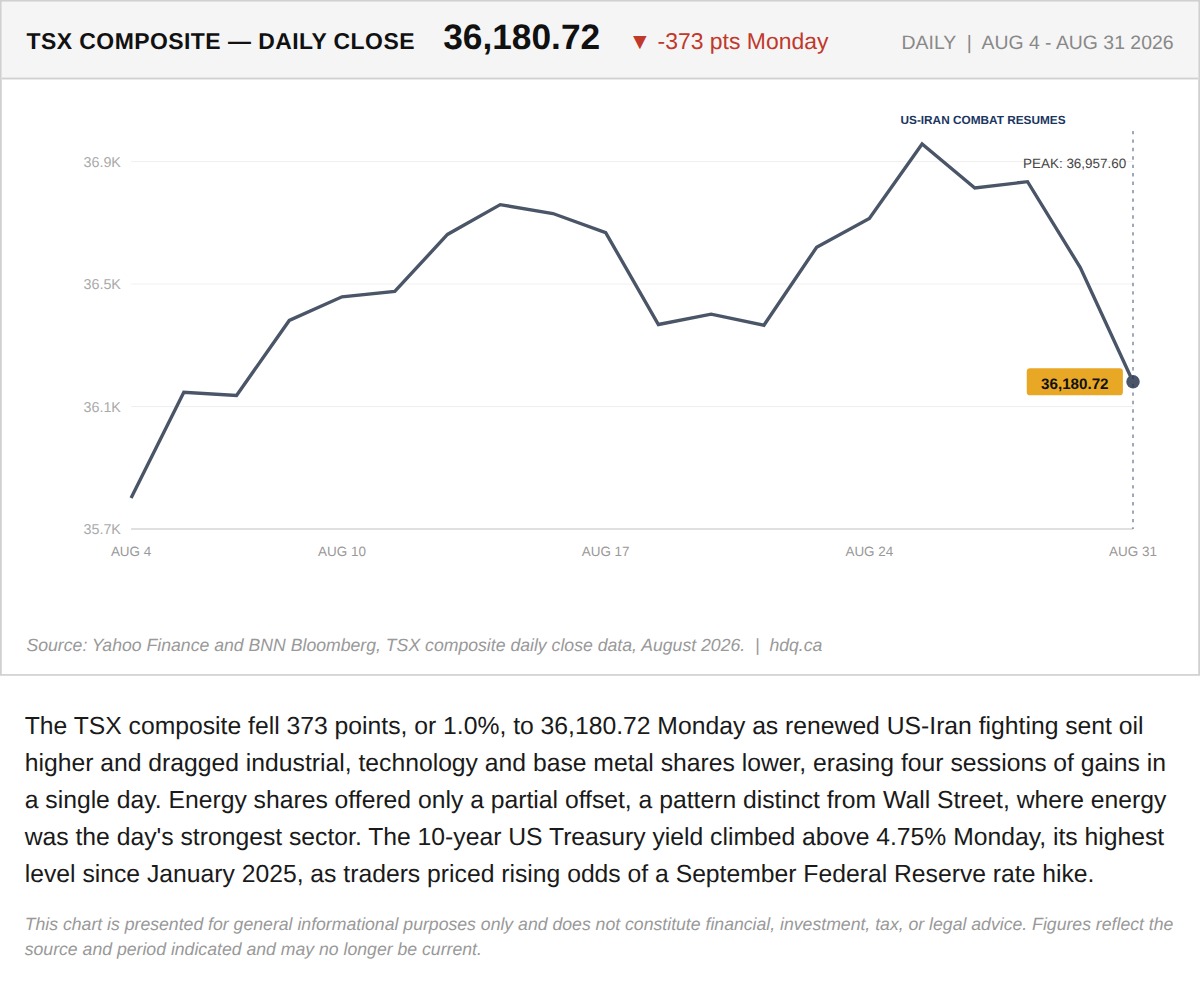
The TSX composite fell 373 points, or 1.0%, to 36,180.72 Monday as renewed US-Iran fighting sent oil higher and dragged industrial,…
The TSX Fell 373 Points Monday as the Energy Trade Couldn't Offset the Rest of the Tape
September 1, 2026
View chart & download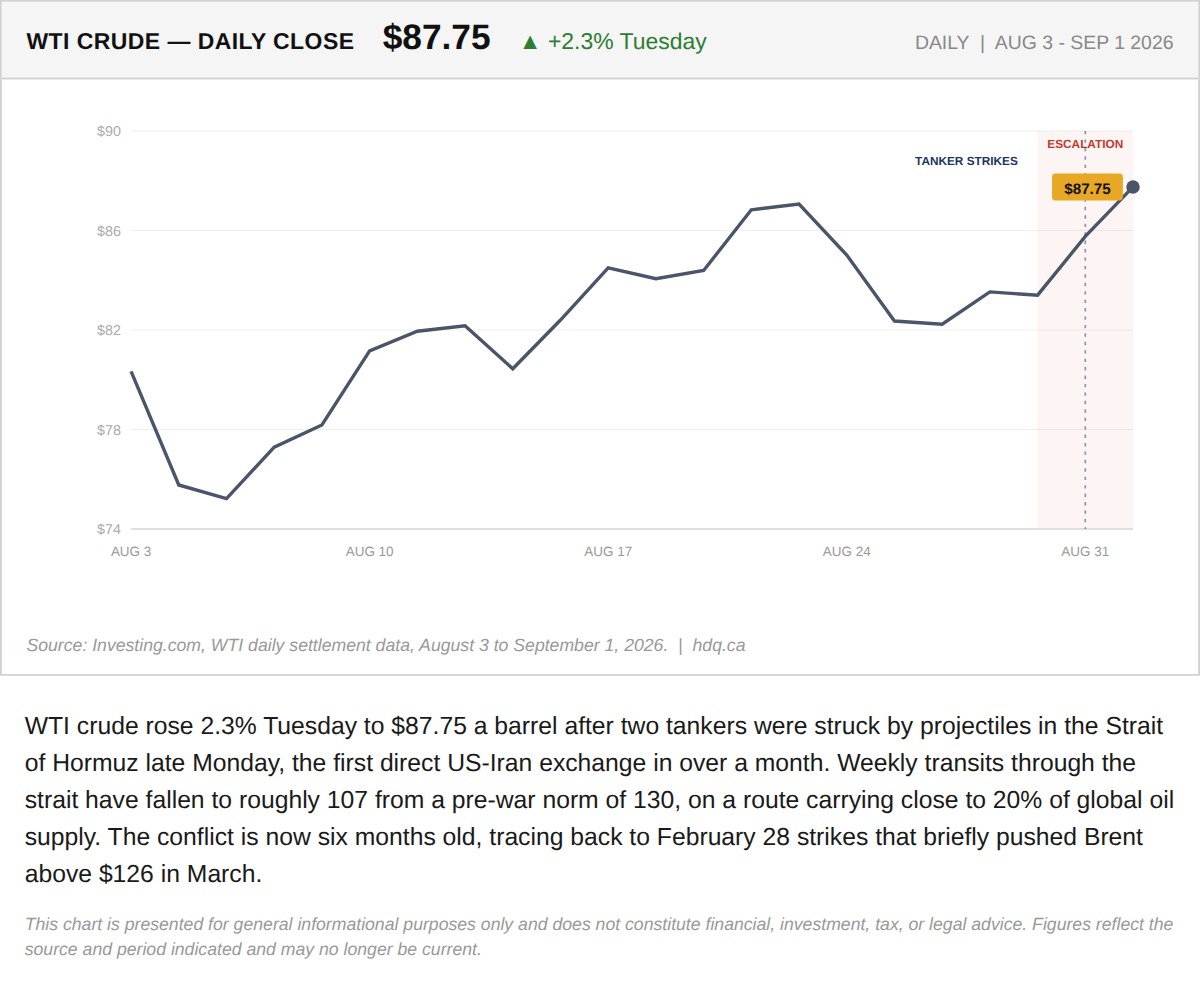
WTI crude rose 2.3% Tuesday to $87.75 a barrel after two tankers were struck by projectiles in the Strait of Hormuz late Monday, the first direct US-Iran exchange in over a month.
Iran's Renewed Strikes Put a Second Hormuz Oil Shock Back on the Table
September 1, 2026
View chart & download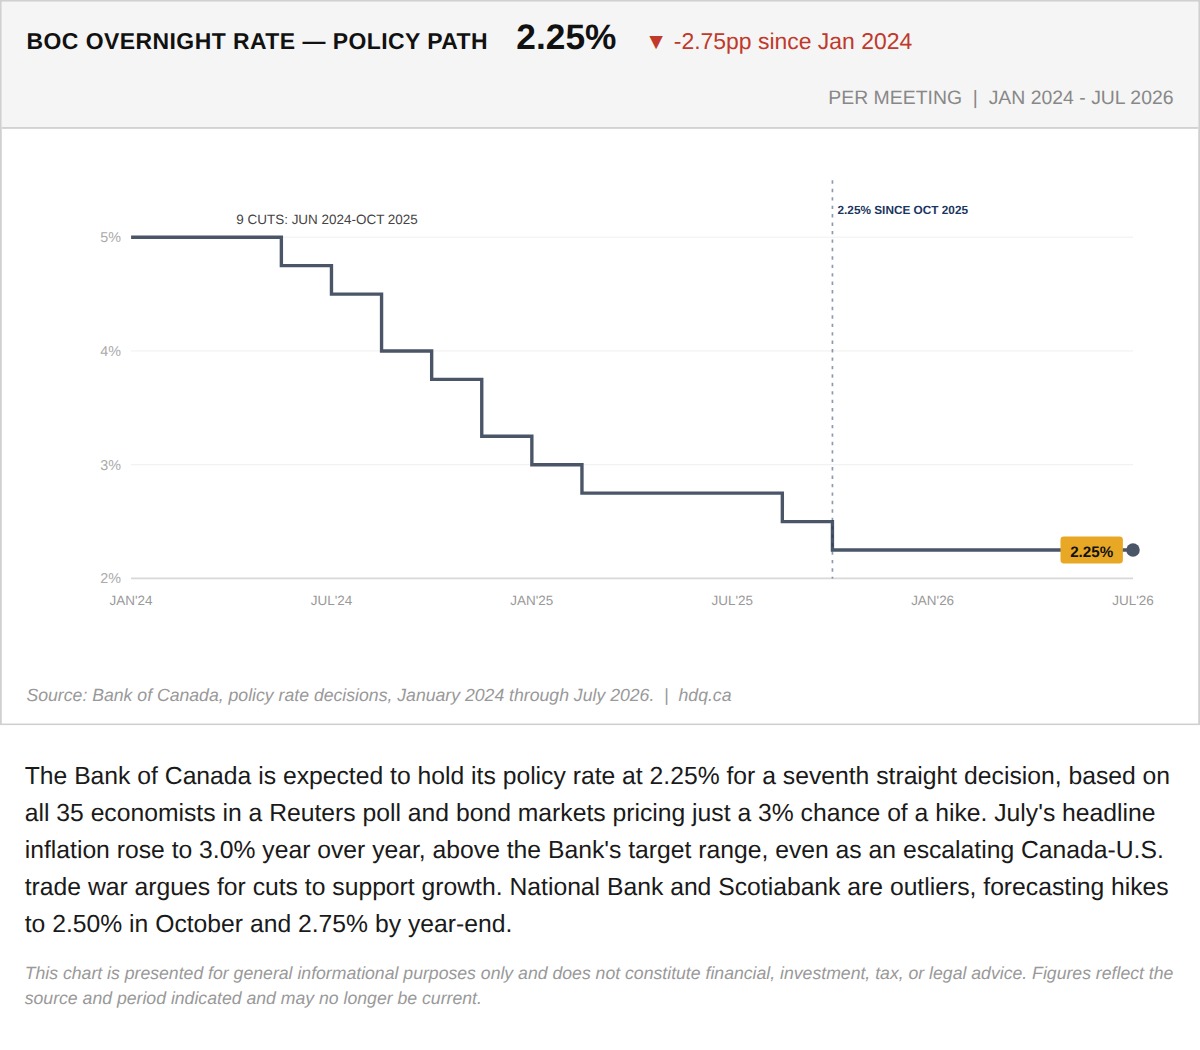
The Bank of Canada is expected to hold its policy rate at 2.25% for a seventh straight decision, based on all 35 economists in a Reuters…
September 1, 2026
View chart & download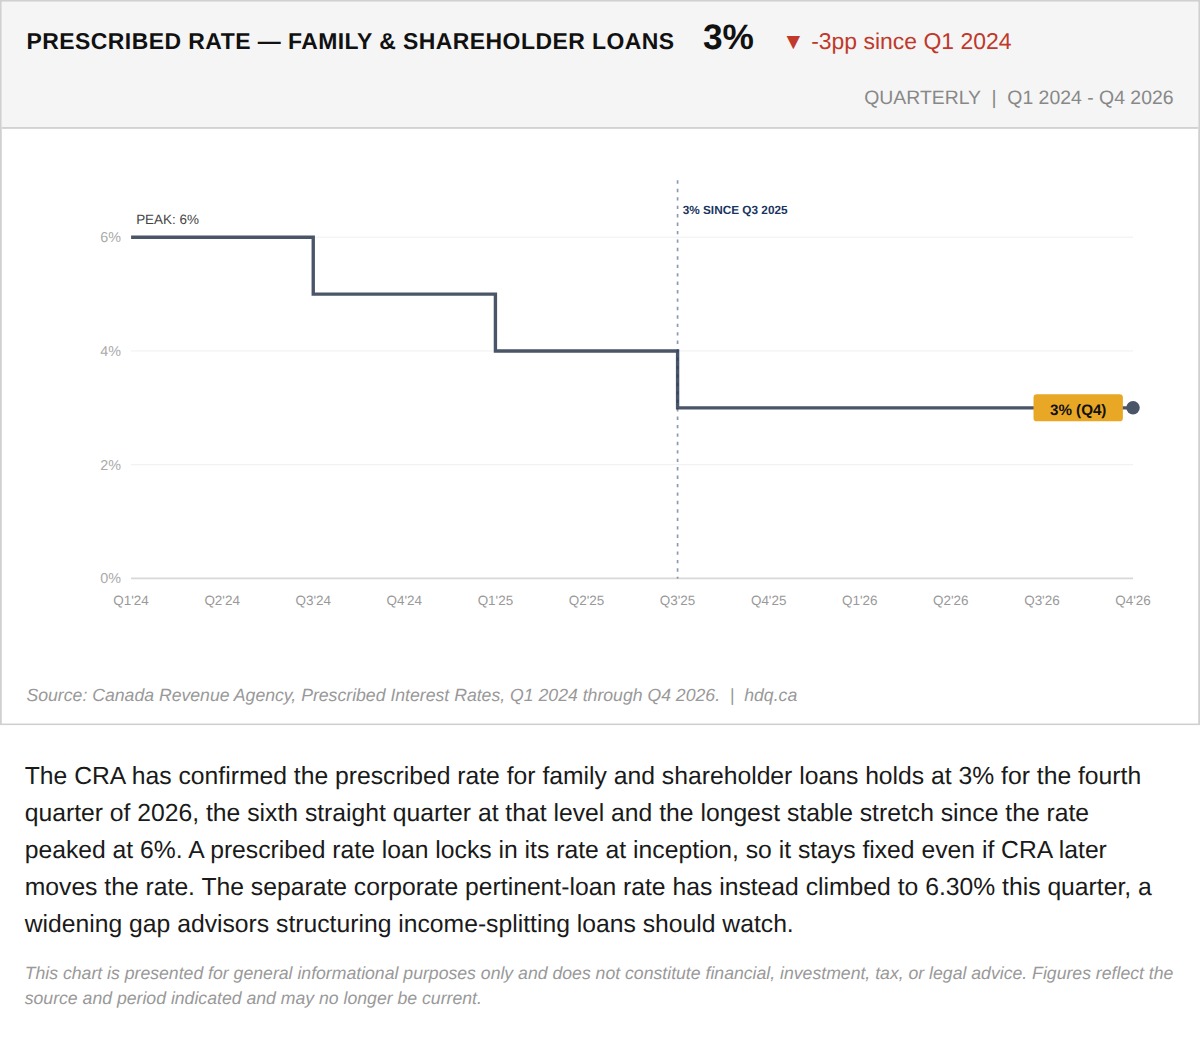
The CRA has confirmed the prescribed rate for family and shareholder loans holds at 3% for the fourth quarter of 2026, the sixth straight…
CRA Holds the Prescribed Rate at 3% for a Sixth Straight Quarter
September 1, 2026
View chart & download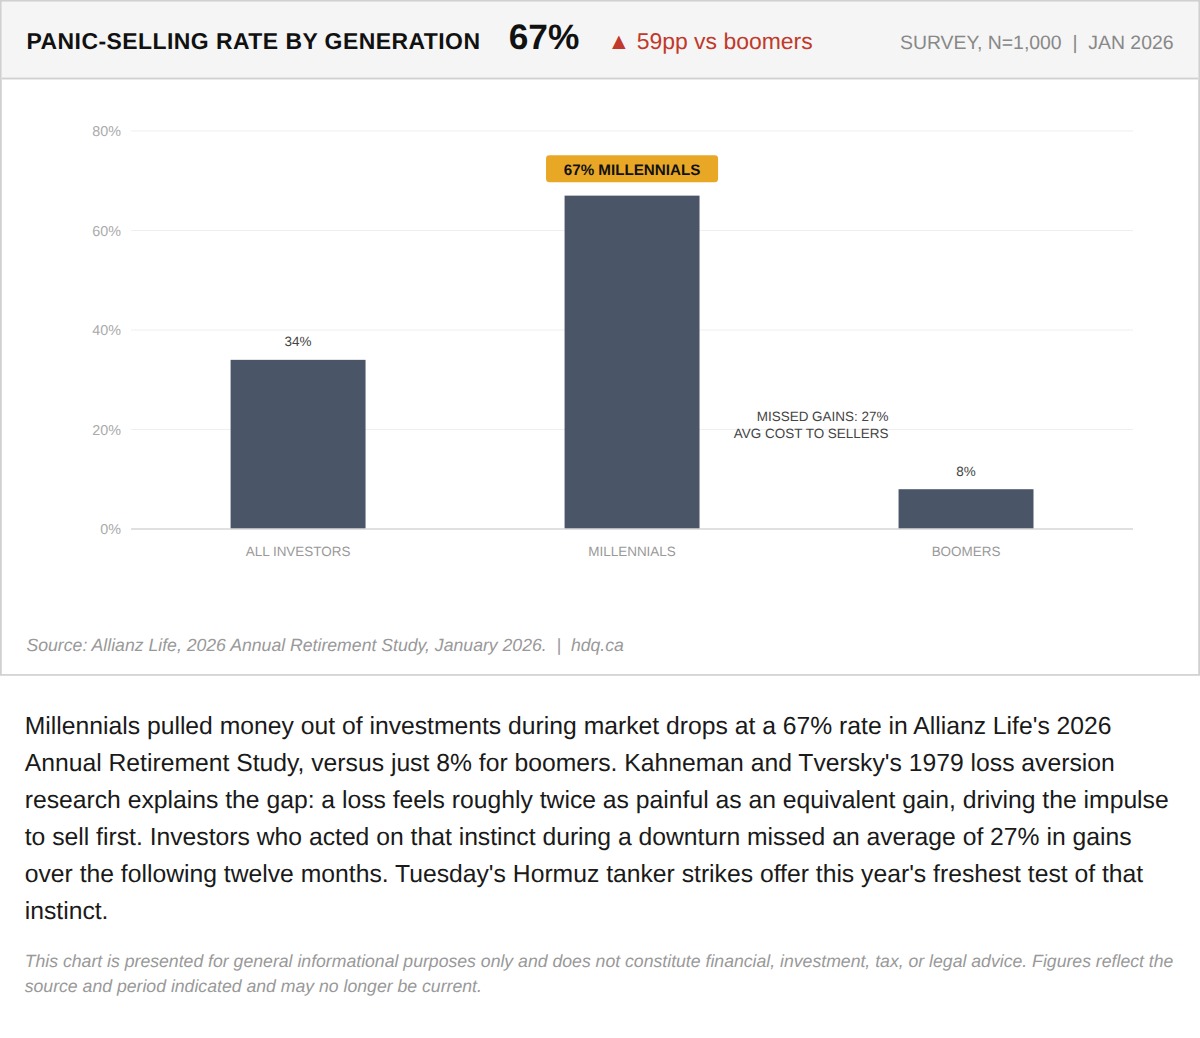
Millennials pulled money out of investments during market drops at a 67% rate in Allianz Life's 2026 Annual Retirement Study, versus just 8% for boomers.
Why Millennials Panic-Sell Eight Times More Than Boomers
September 1, 2026
View chart & download