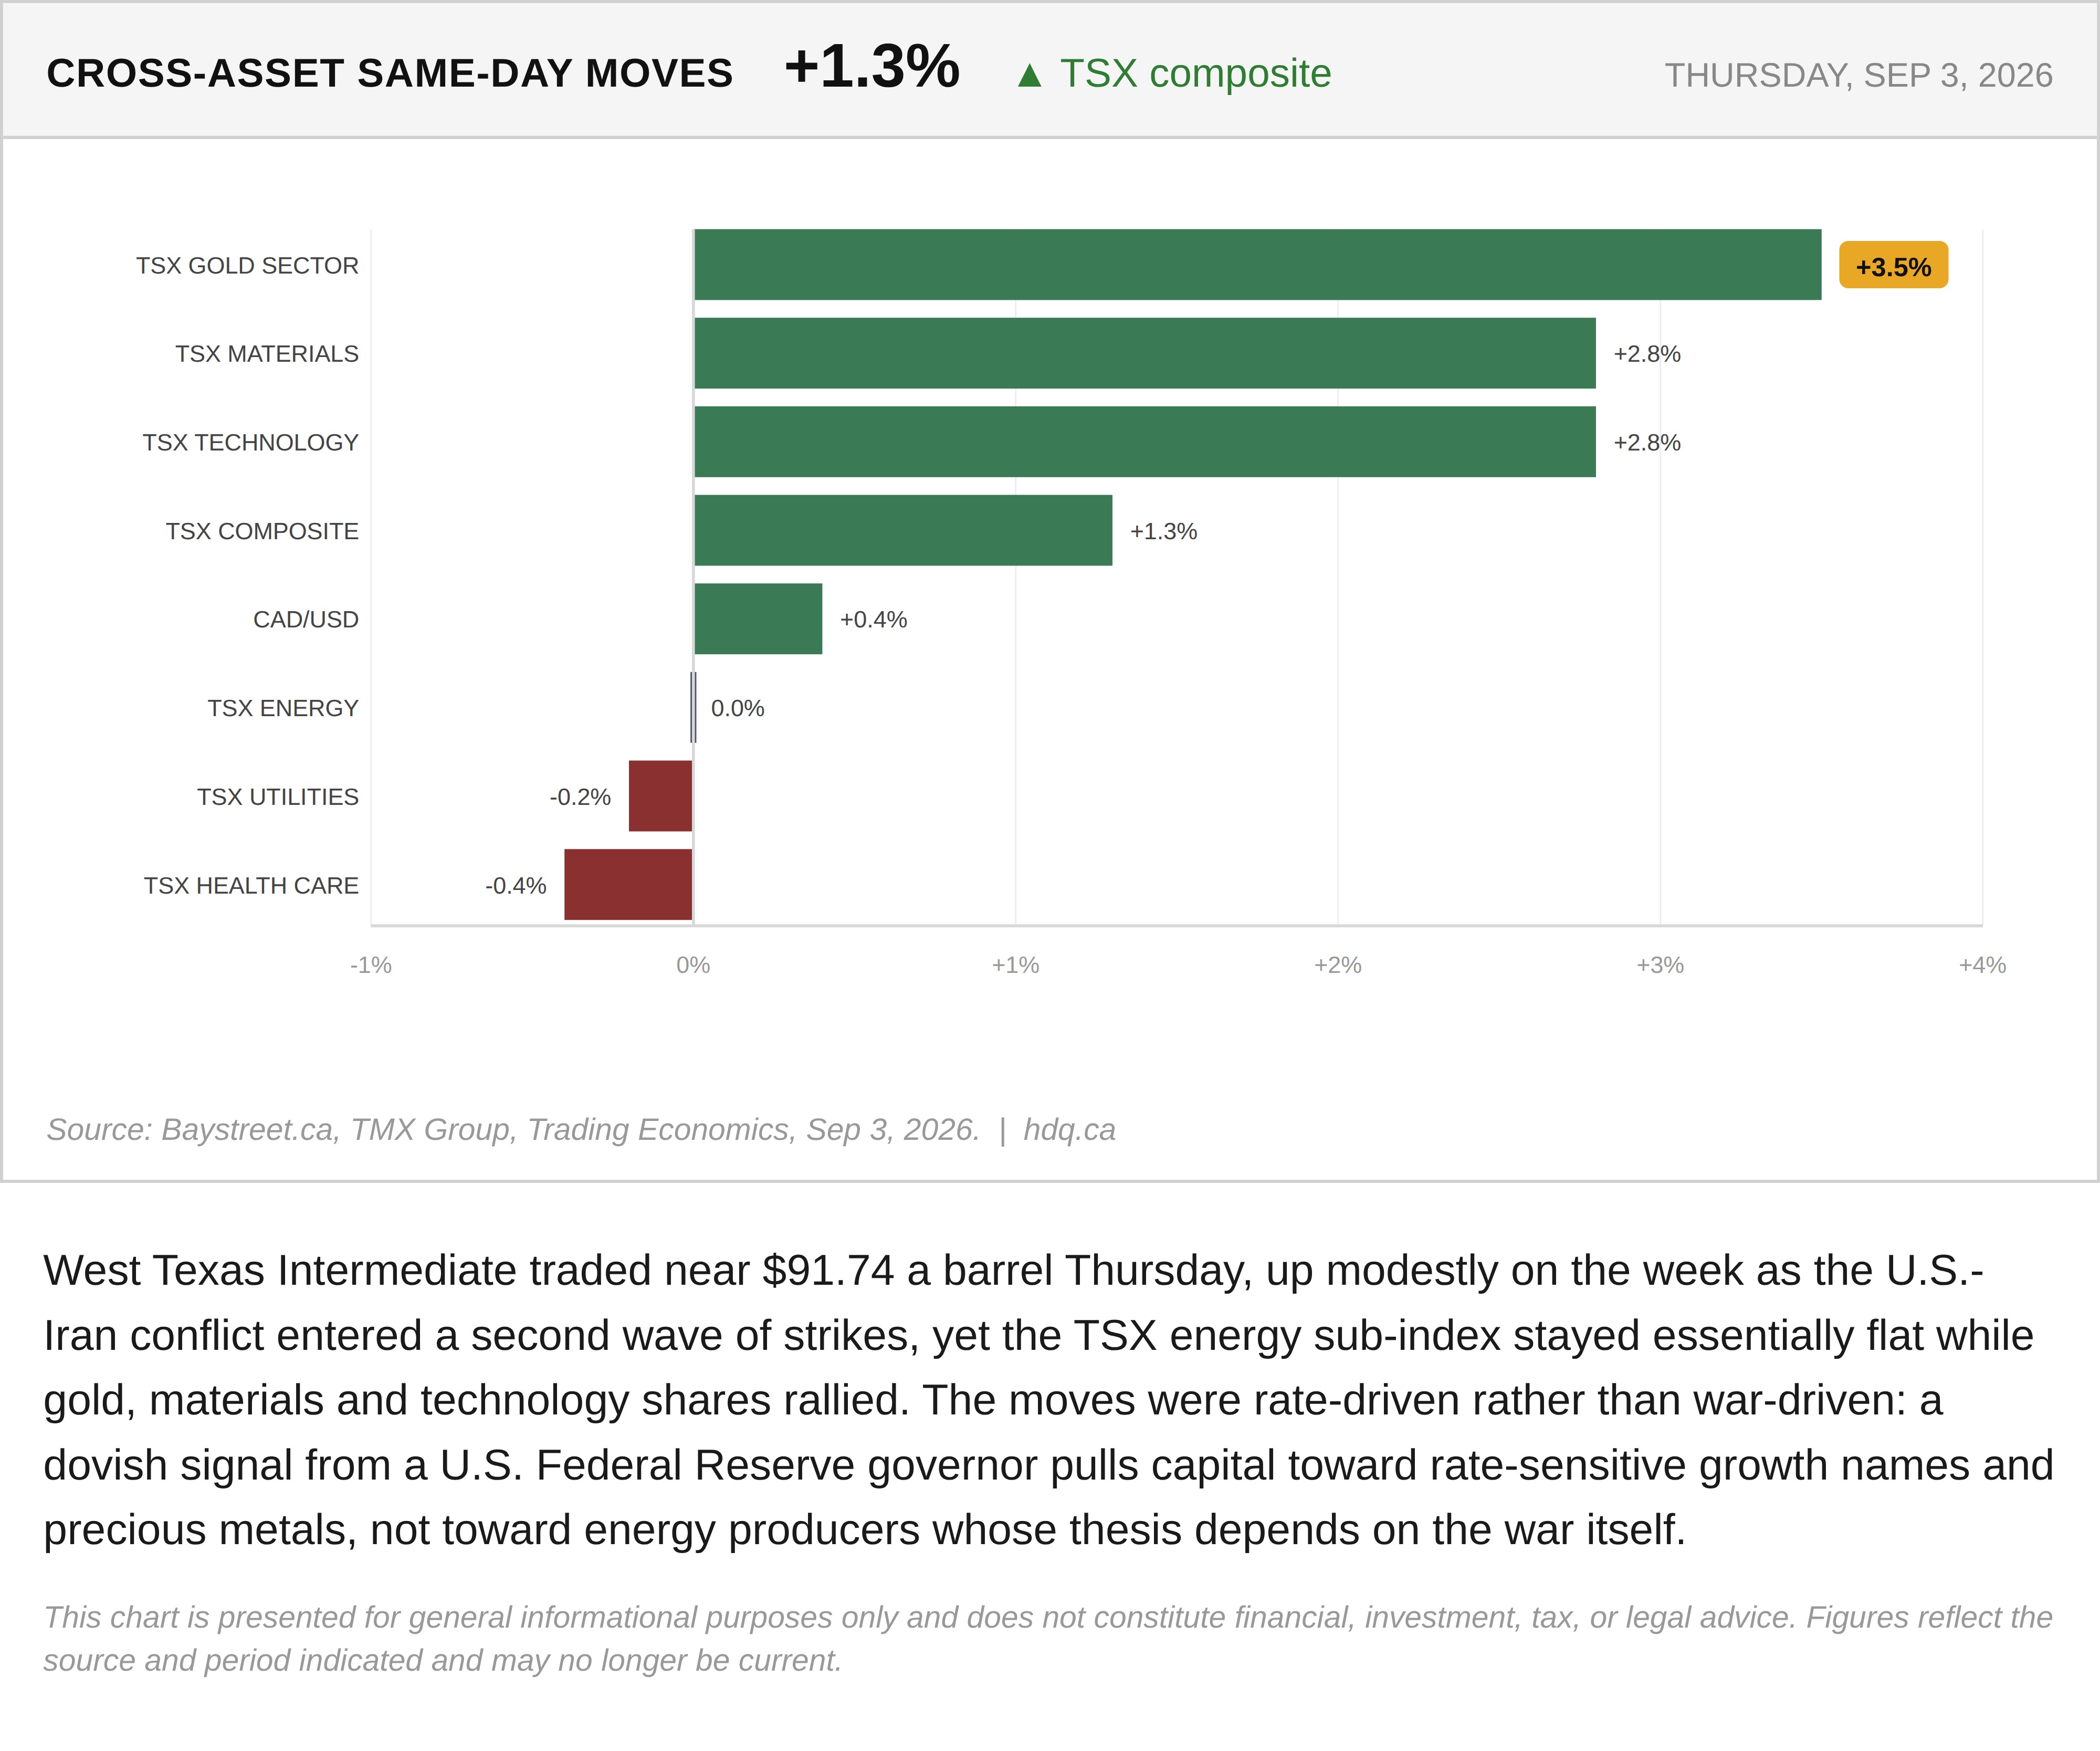
West Texas Intermediate traded near $91.74 a barrel Thursday, up modestly on the week as the U.S.-Iran conflict entered a second wave of strikes, yet the TSX energy sub-index stayed essentially flat while gold, materials and technology shares rallied. The moves were rate-driven rather than war-driven: a dovish signal from a U.S. Federal Reserve governor pulls capital toward rate-sensitive growth names and precious metals, not toward energy producers whose thesis depends on the war itself.
This chart is presented for general informational purposes only and does not constitute financial, investment, tax, or legal advice. Figures reflect the source and period indicated and may no longer be current.
Related charts
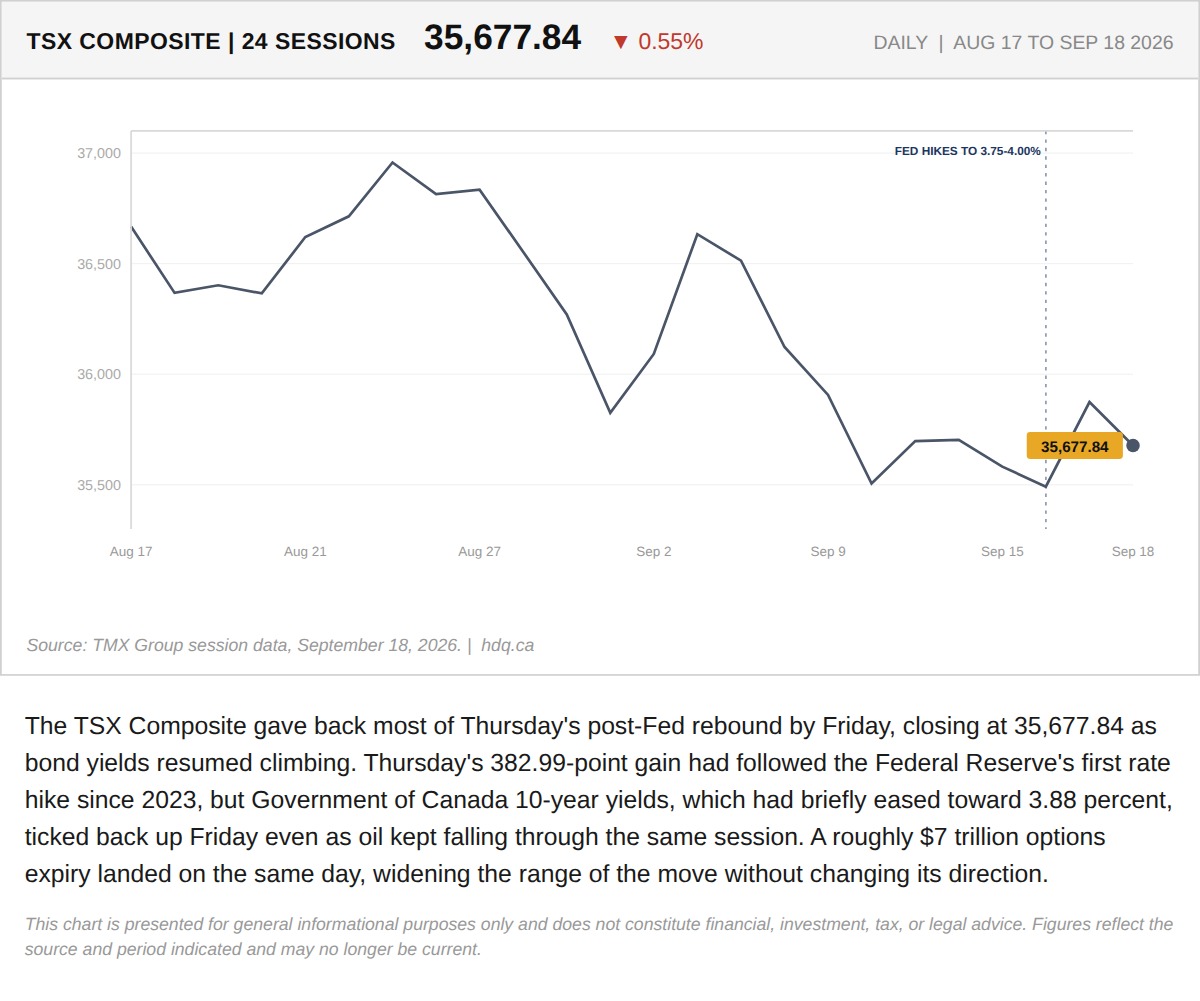
The TSX Composite gave back most of Thursday's post-Fed rebound by Friday, closing at 35,677.84 as bond yields resumed climbing.
TSX Gives Back Post-Fed Rally as Bond Yields Resume Climbing
September 18, 2026
View chart & download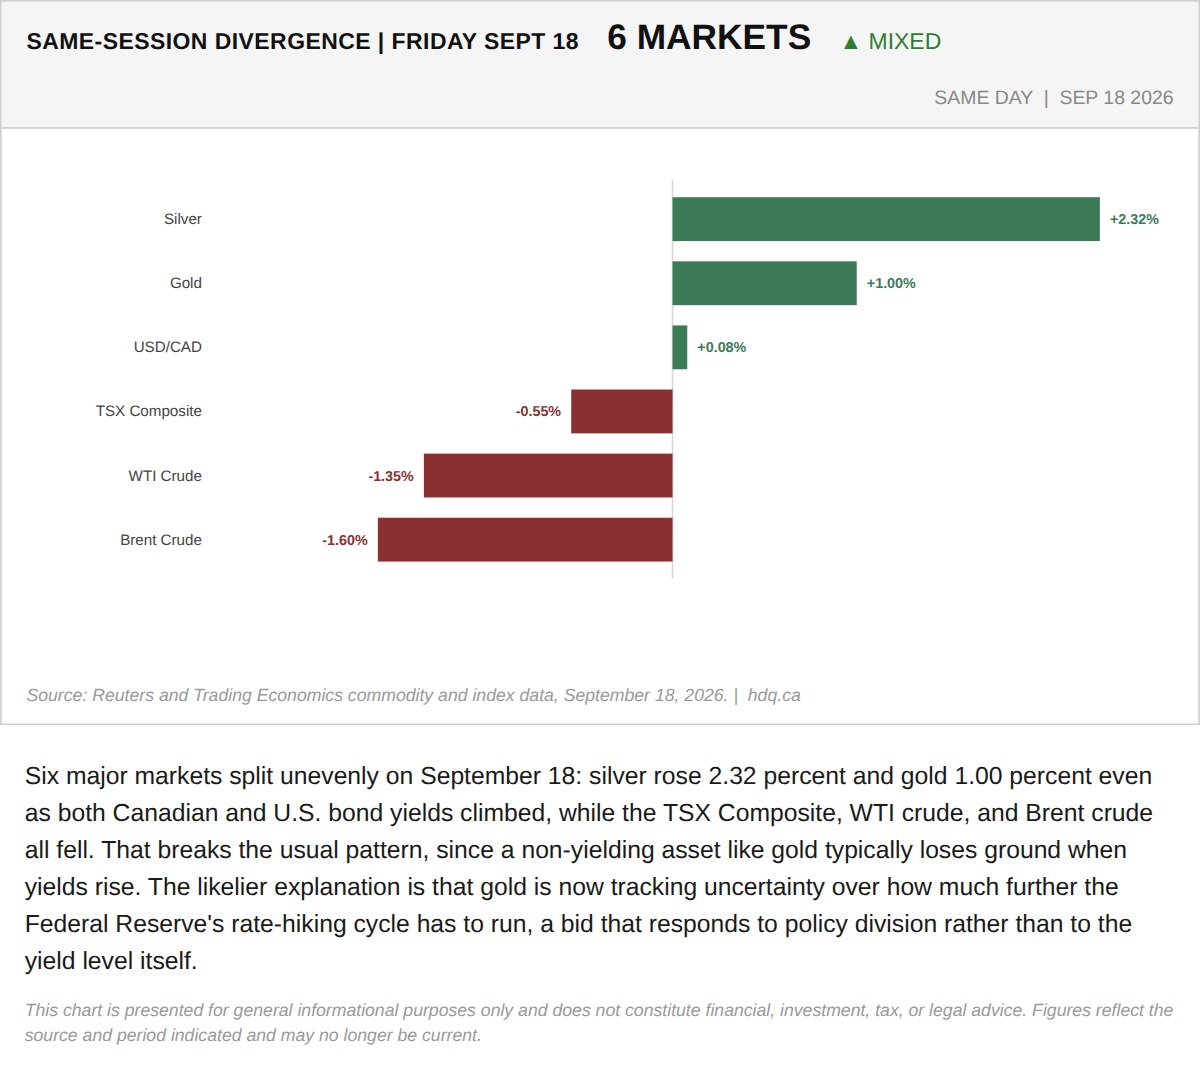
Six major markets split unevenly on September 18: silver rose 2.32 percent and gold 1.00 percent even as both Canadian and U.S.
Gold and Silver Rise With Yields, Breaking the Usual Pattern
September 18, 2026
View chart & download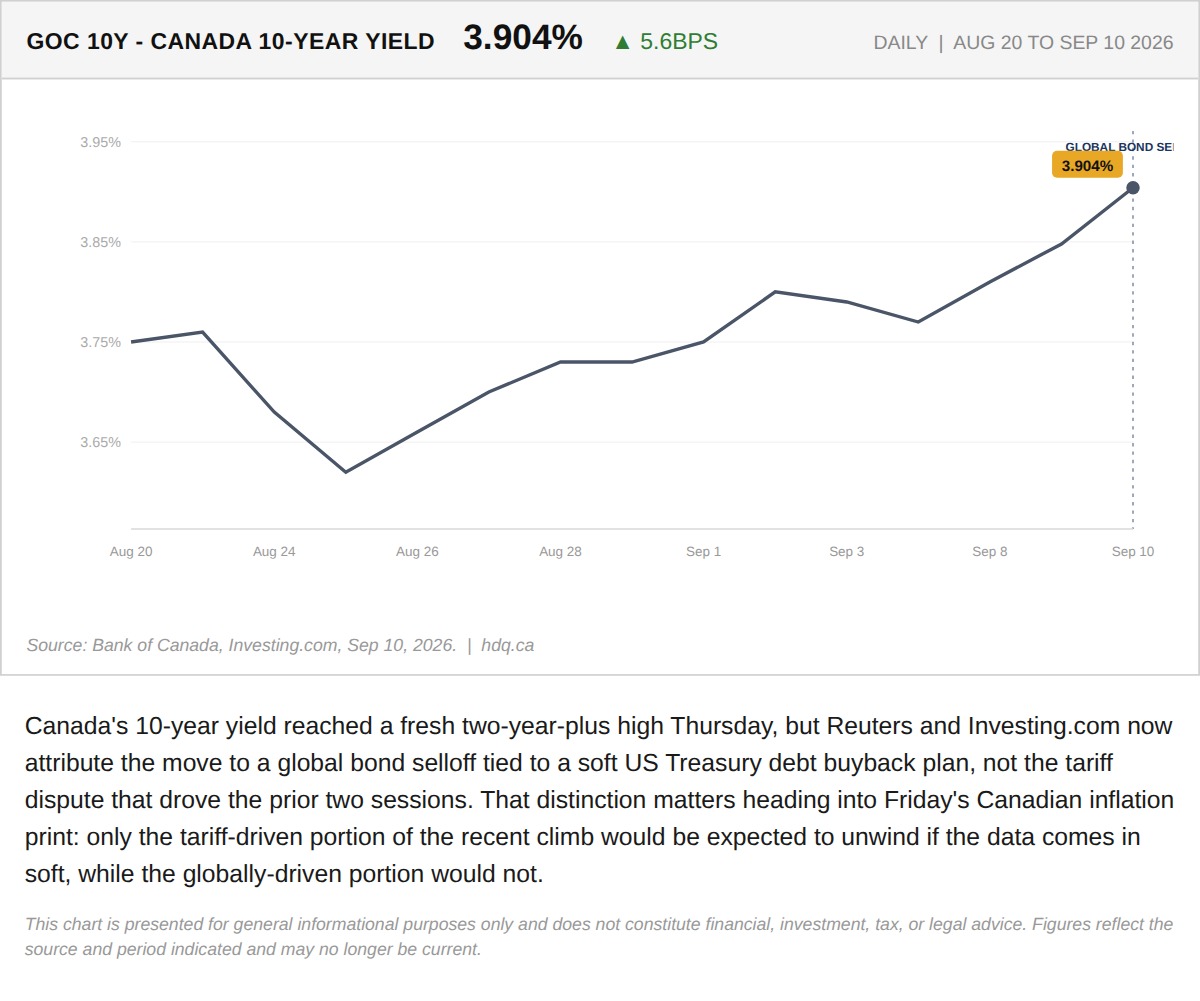
Canada's 10-year yield reached a fresh two-year-plus high Thursday, but Reuters and Investing.com now attribute the move to a global bond…
Canada's Bond Yield Hits a Fresh Two-Year High, But Not for the Reason Tuesday's Move Was
September 10, 2026
View chart & download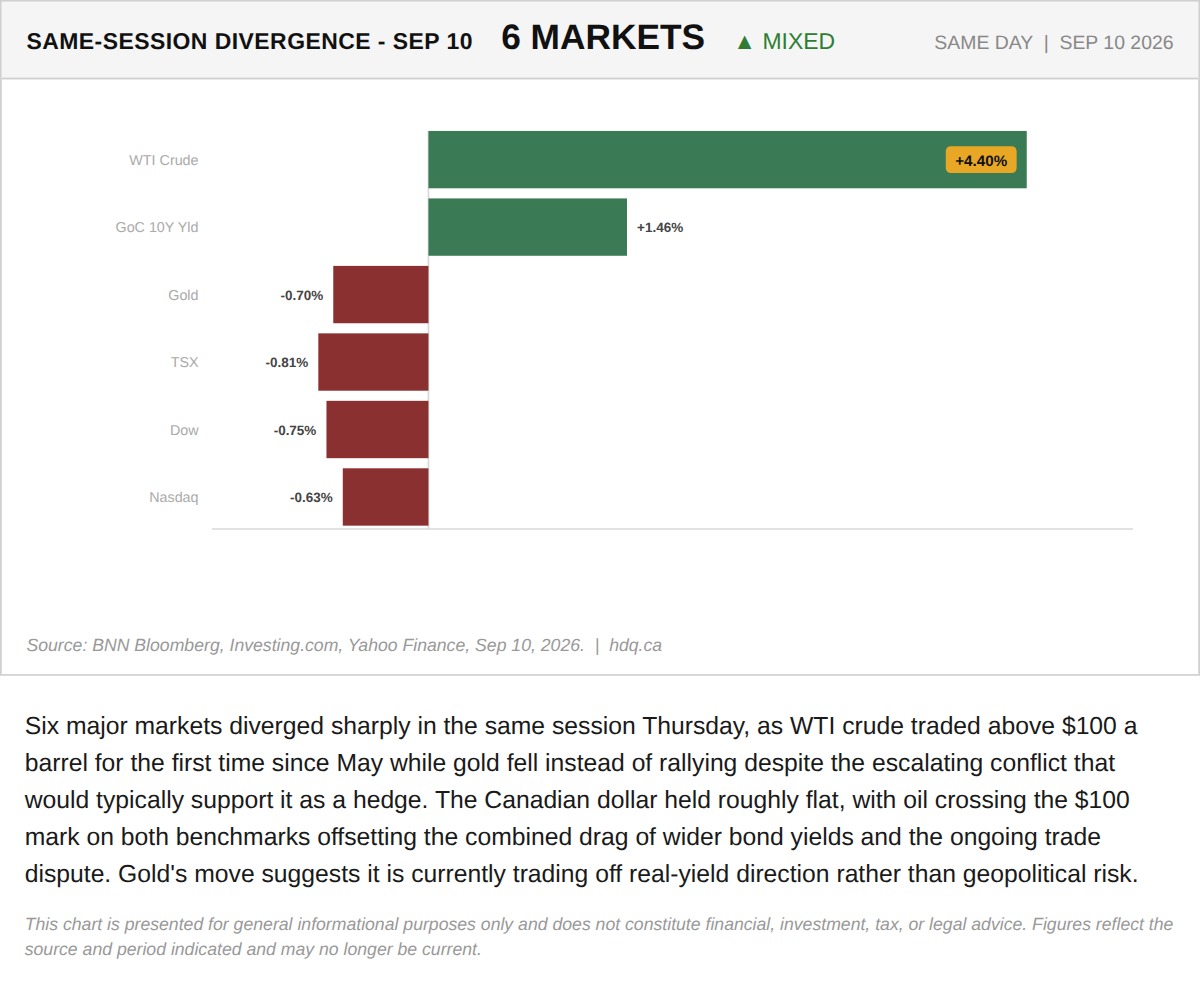
Six major markets diverged sharply in the same session Thursday, as WTI crude traded above $100 a barrel for the first time since May while…
Oil Crosses $100 While Gold Falls: The Cross-Asset Split Behind Thursday's Headlines
September 10, 2026
View chart & download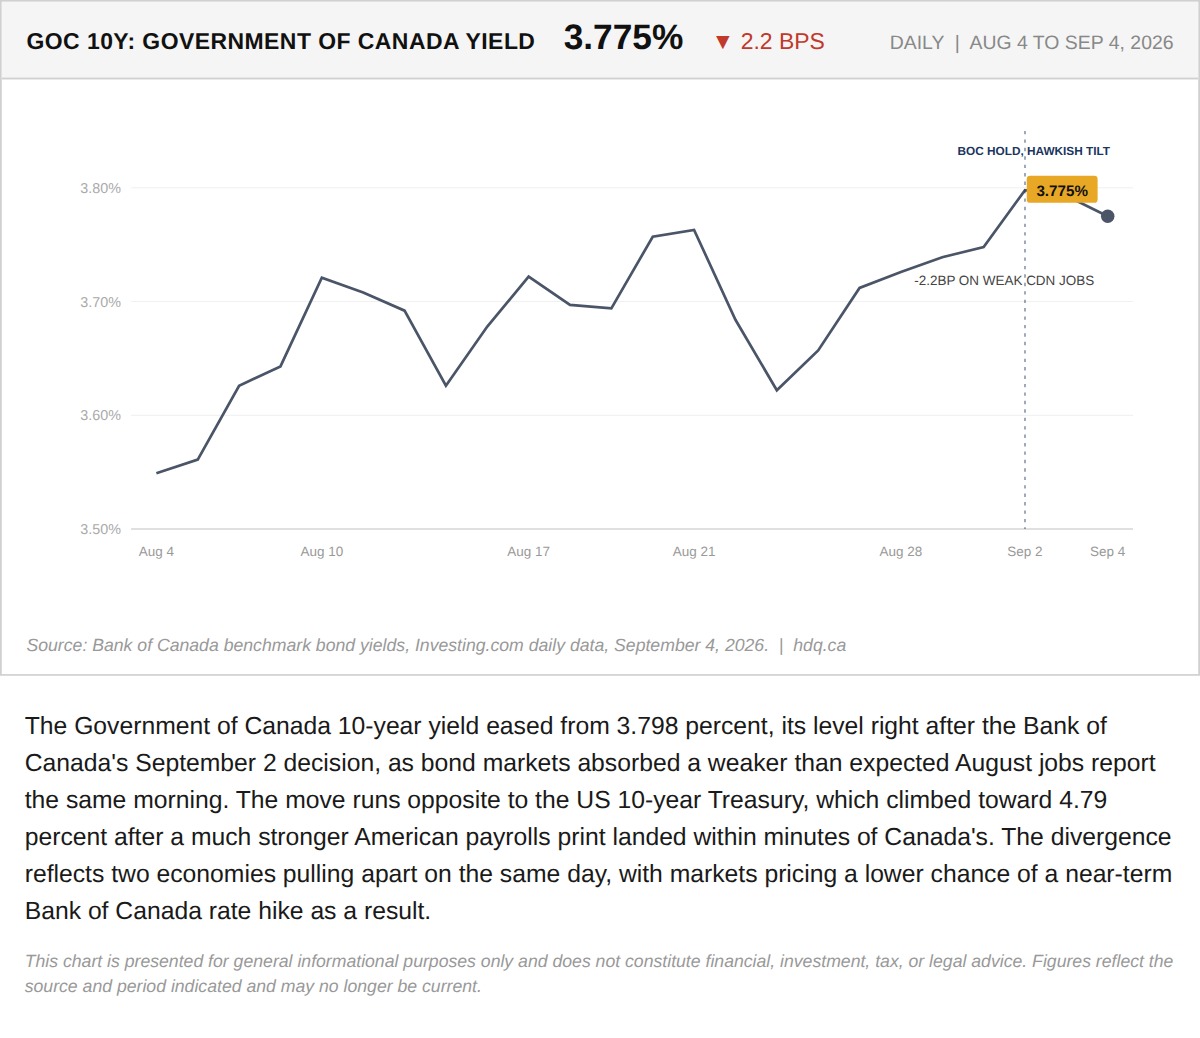
The Government of Canada 10-year yield eased from 3.798 percent, its level right after the Bank of Canada's September 2 decision, as bond…
Government of Canada 10-Year Yield Eases to 3.775% After August Jobs Miss
September 4, 2026
View chart & download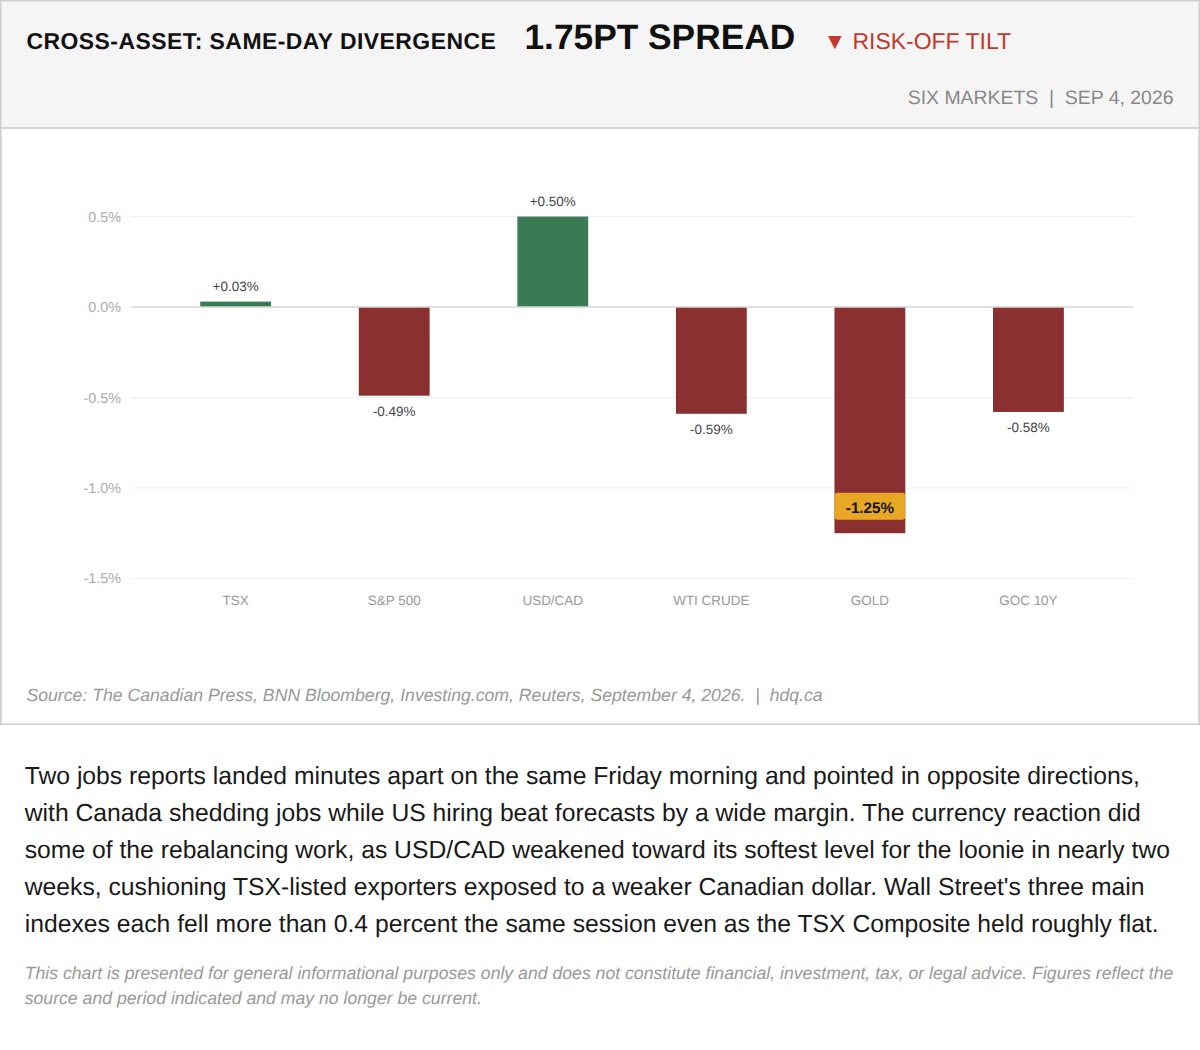
Two jobs reports landed minutes apart on the same Friday morning and pointed in opposite directions, with Canada shedding jobs while US hiring beat forecasts by a wide margin.
Six Markets Diverge in the Same Session as Canada and US Jobs Data Split
September 4, 2026
View chart & download