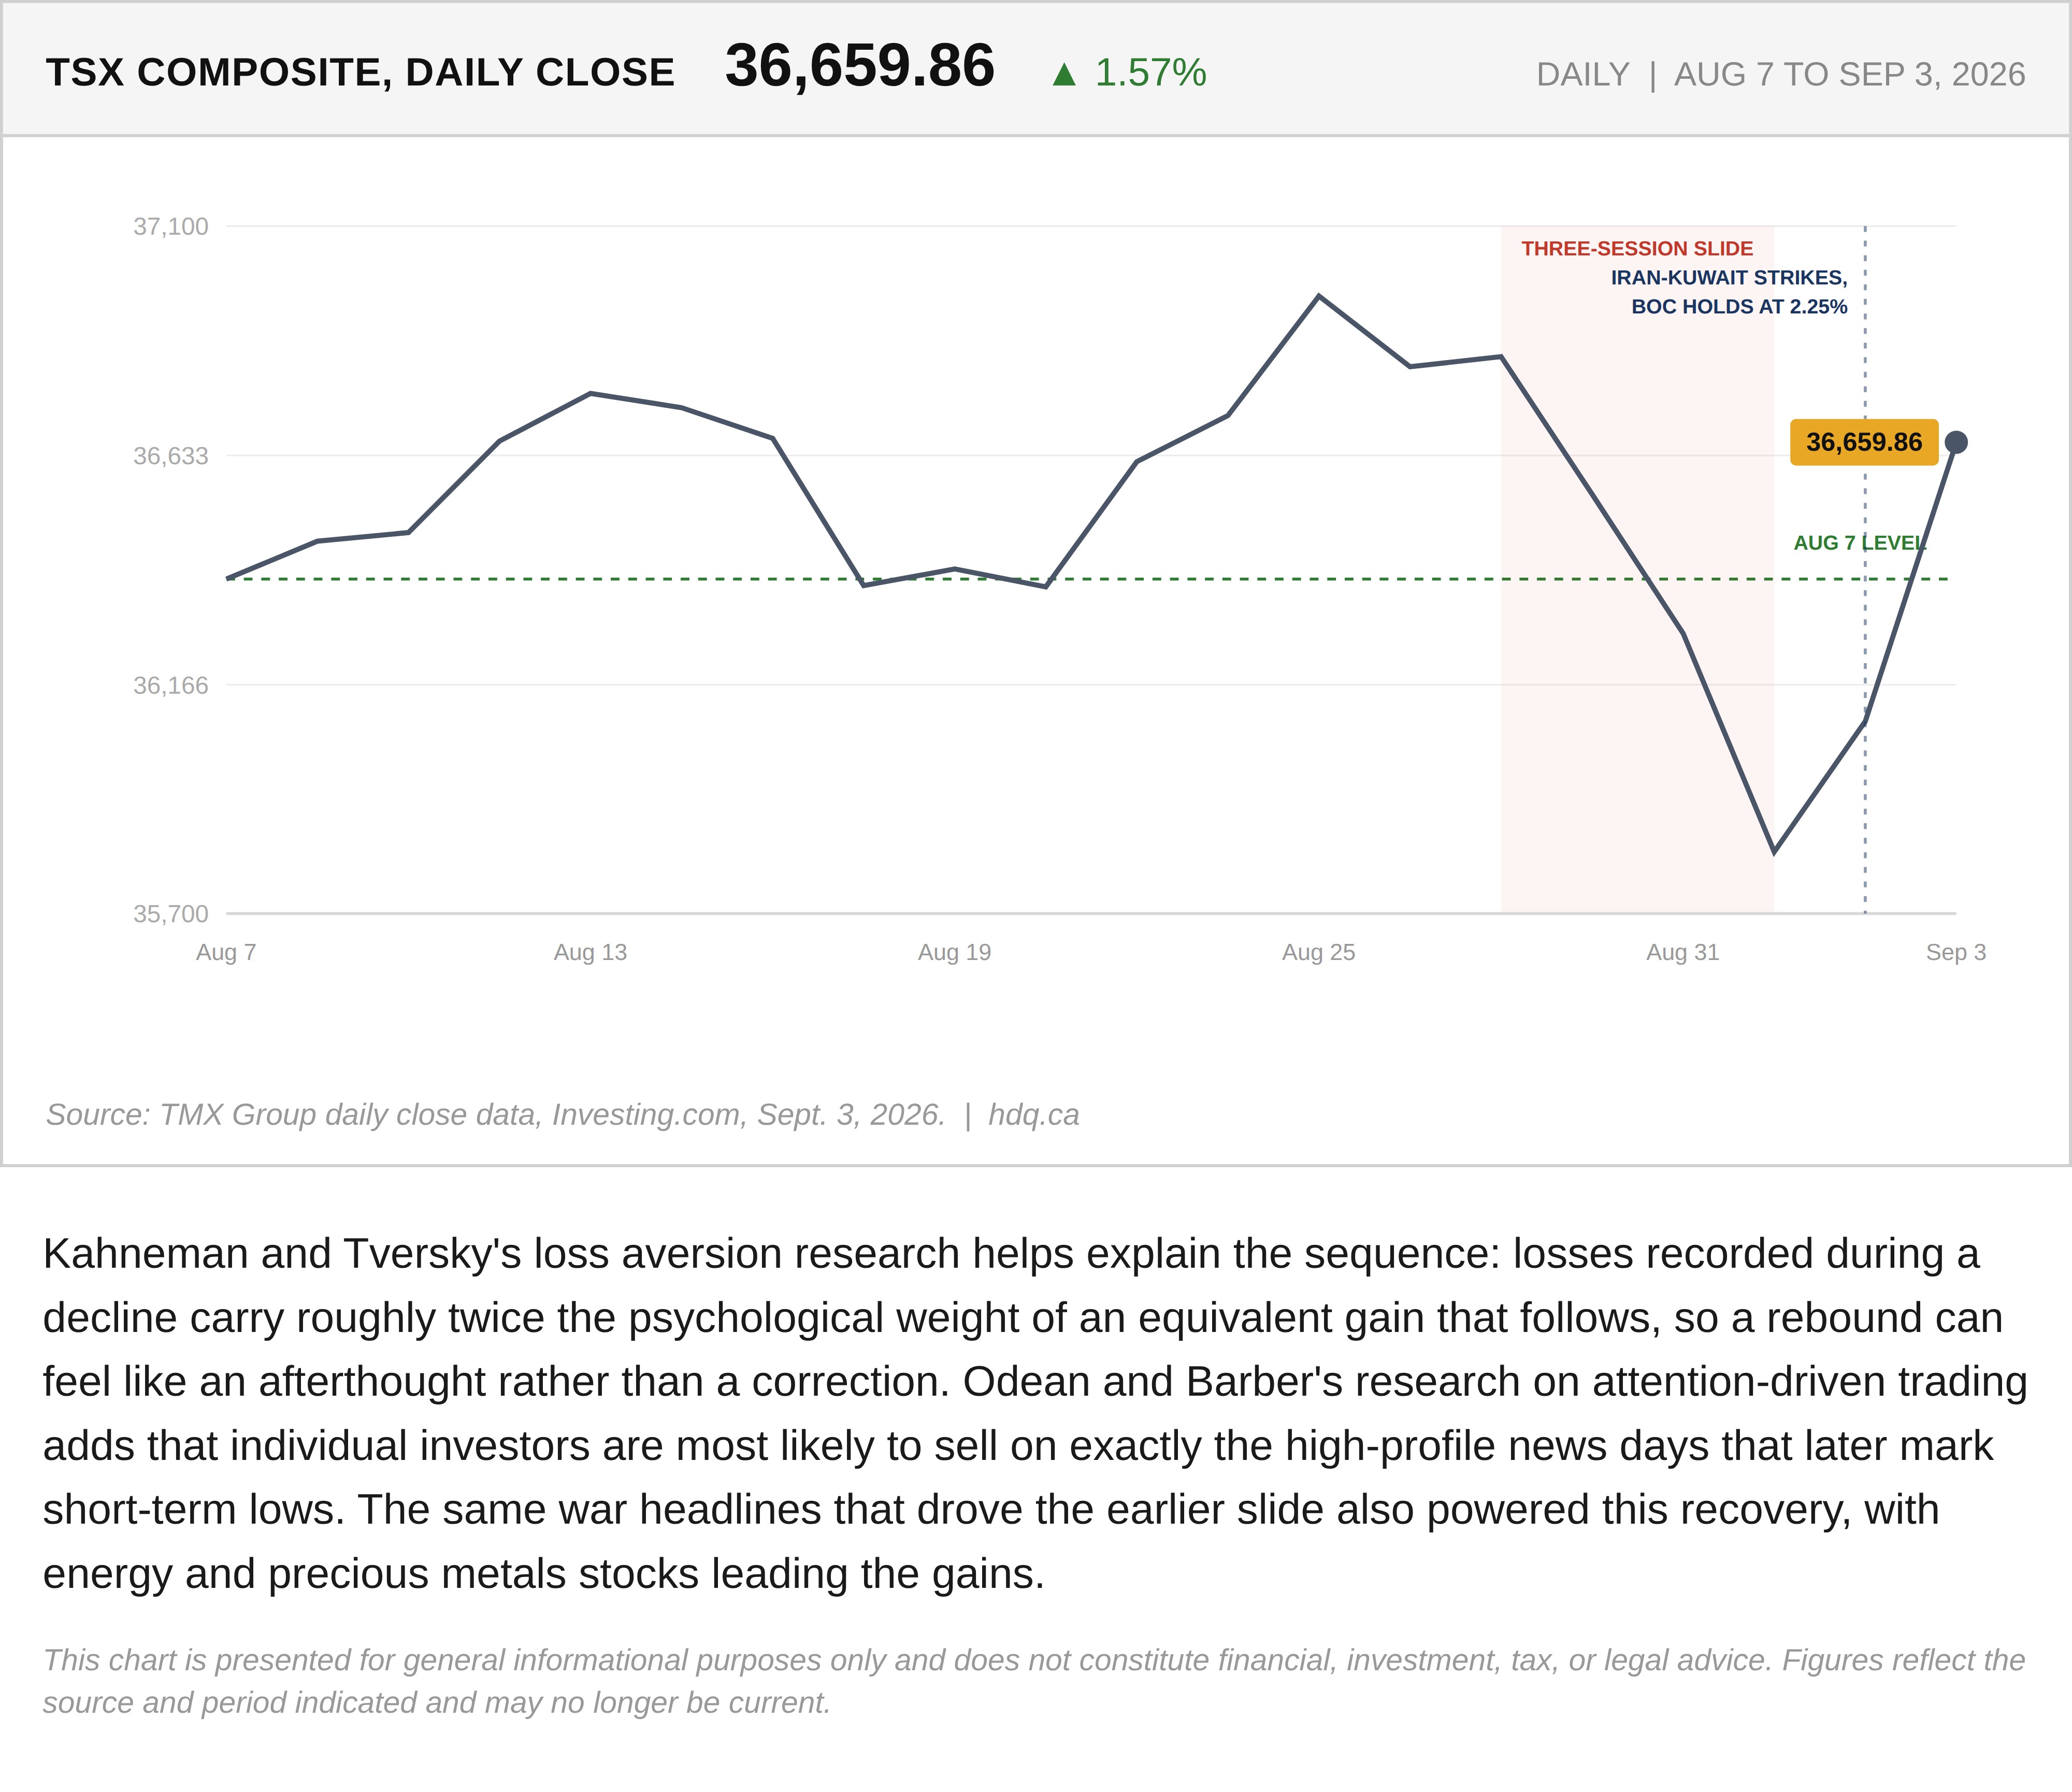
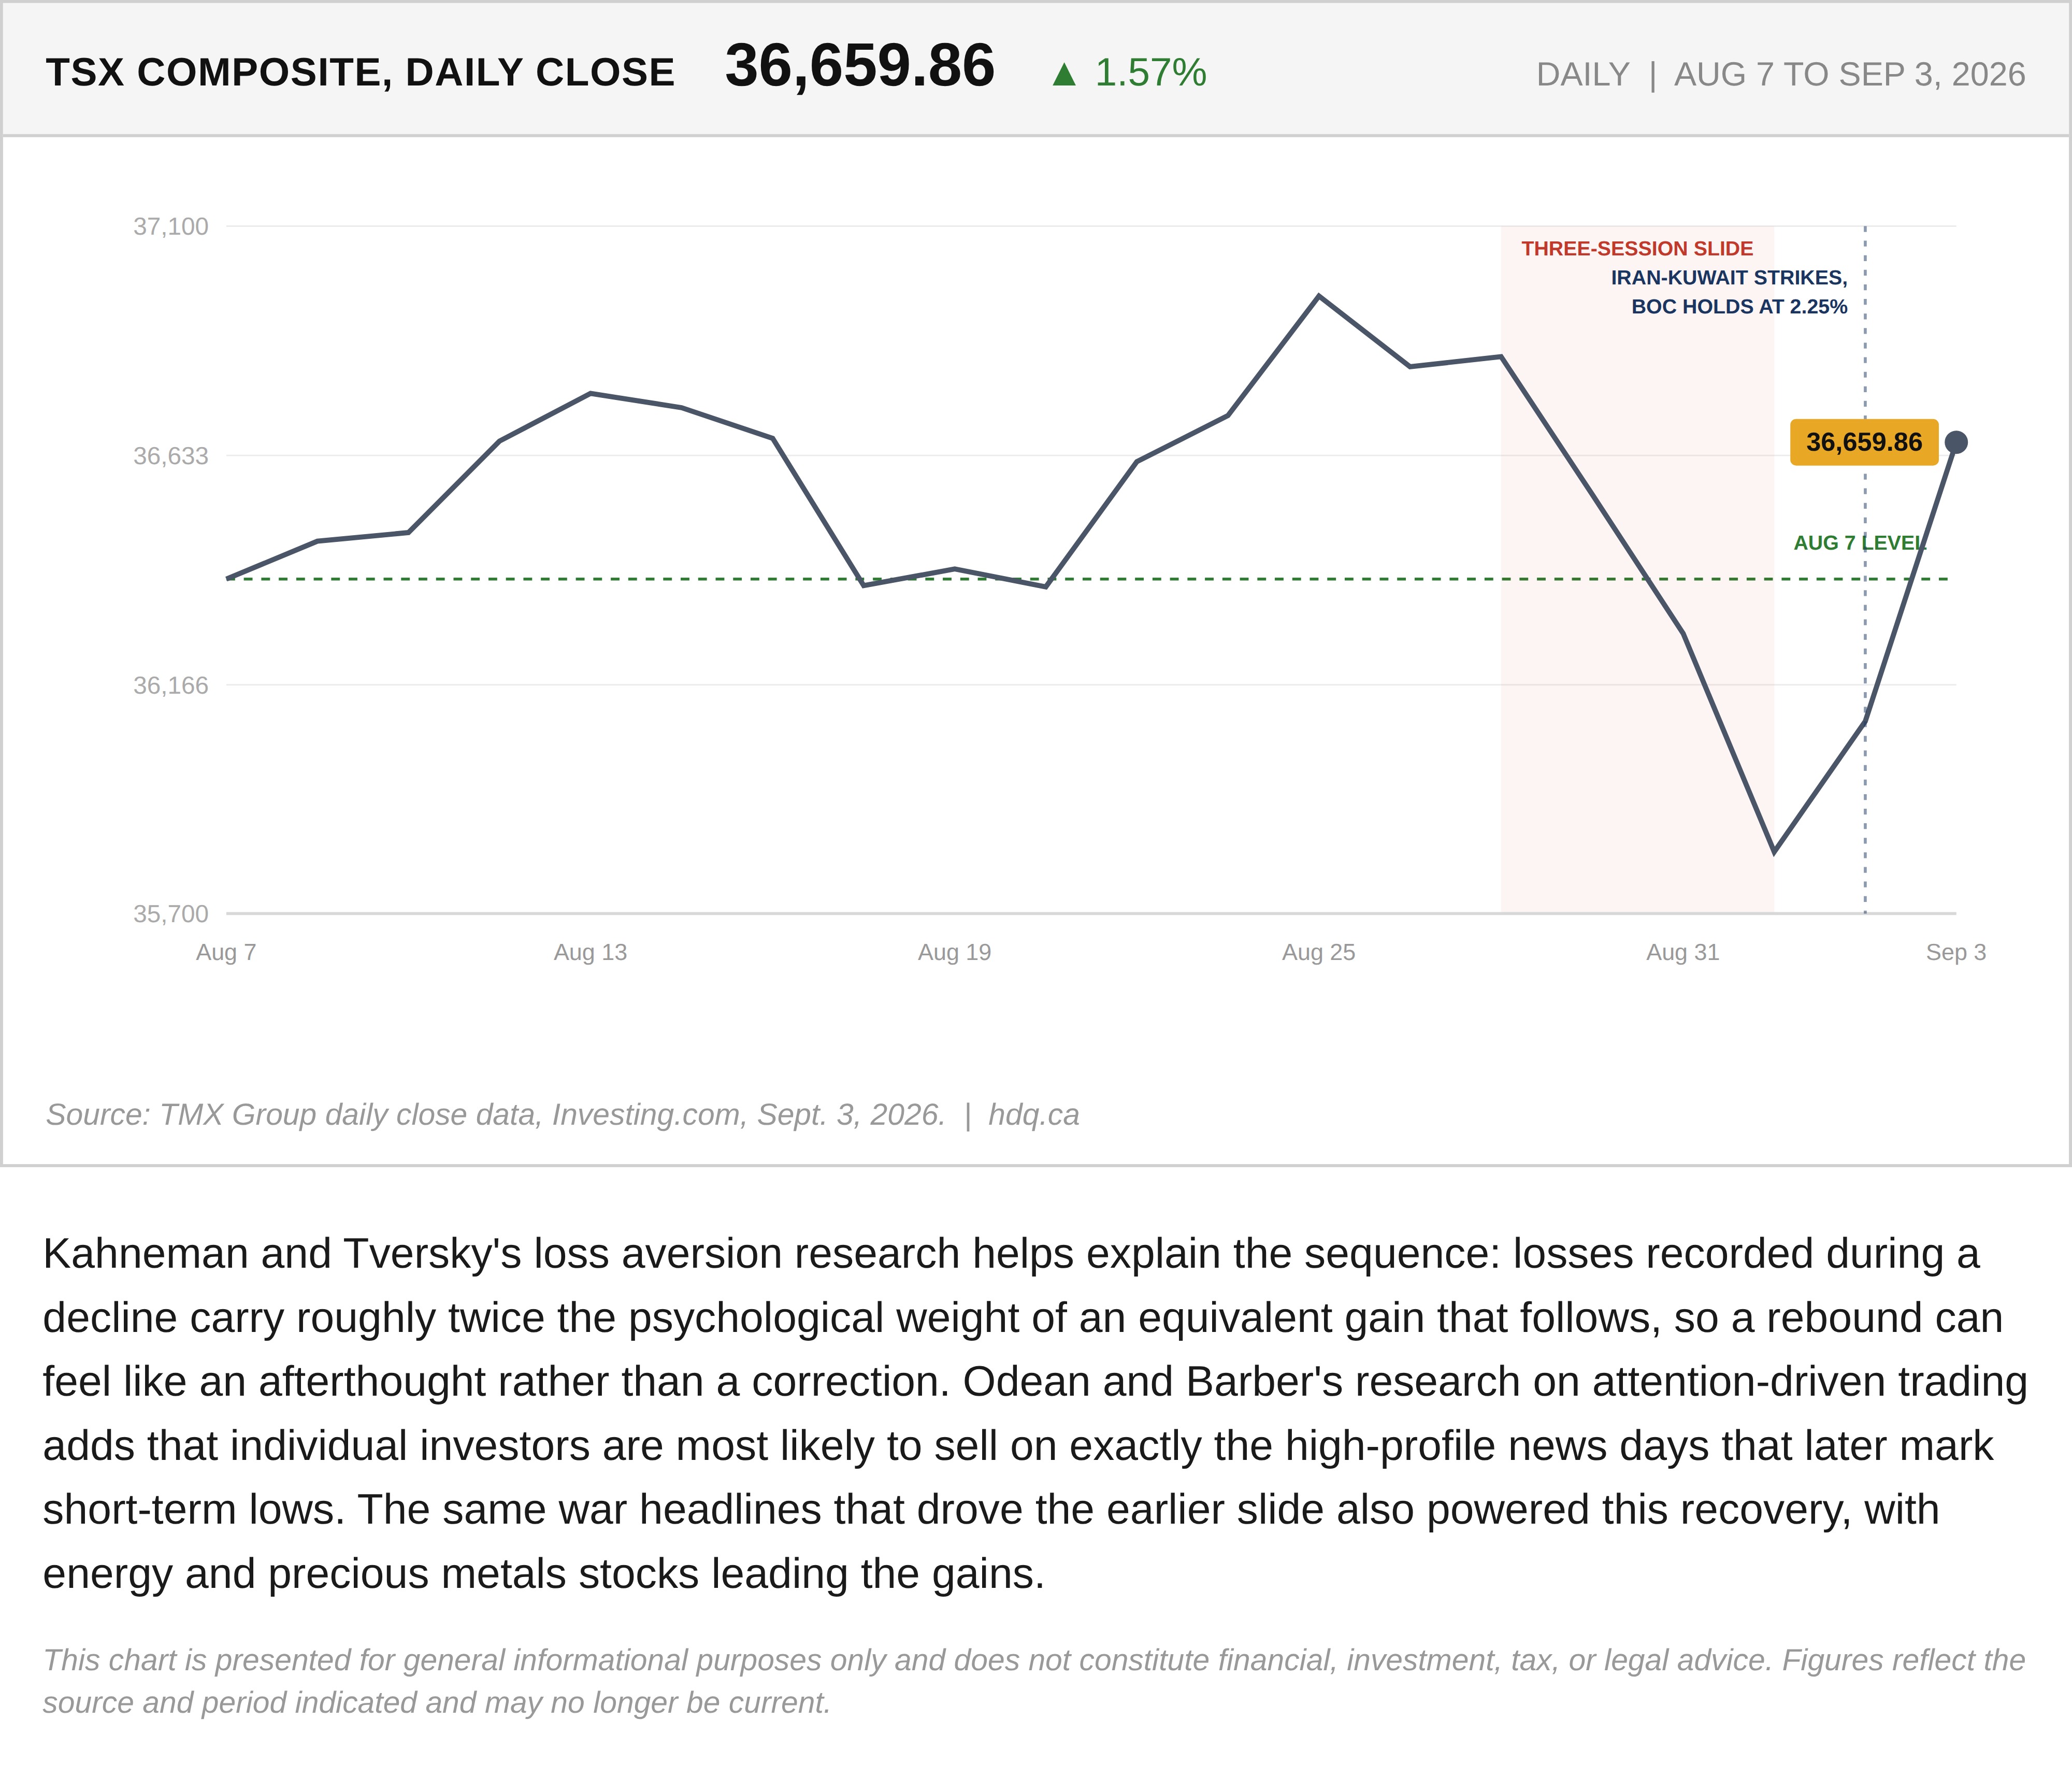
Kahneman and Tversky's loss aversion research helps explain the sequence: losses recorded during a decline carry roughly twice the psychological weight of an equivalent gain that follows, so a rebound can feel like an afterthought rather than a correction. Odean and Barber's research on attention-driven trading adds that individual investors are most likely to sell on exactly the high-profile news days that later mark short-term lows. The same war headlines that drove the earlier slide also powered this recovery, with energy and precious metals stocks leading the gains.
This chart is presented for general informational purposes only and does not constitute financial, investment, tax, or legal advice. Figures reflect the source and period indicated and may no longer be current.
Related charts
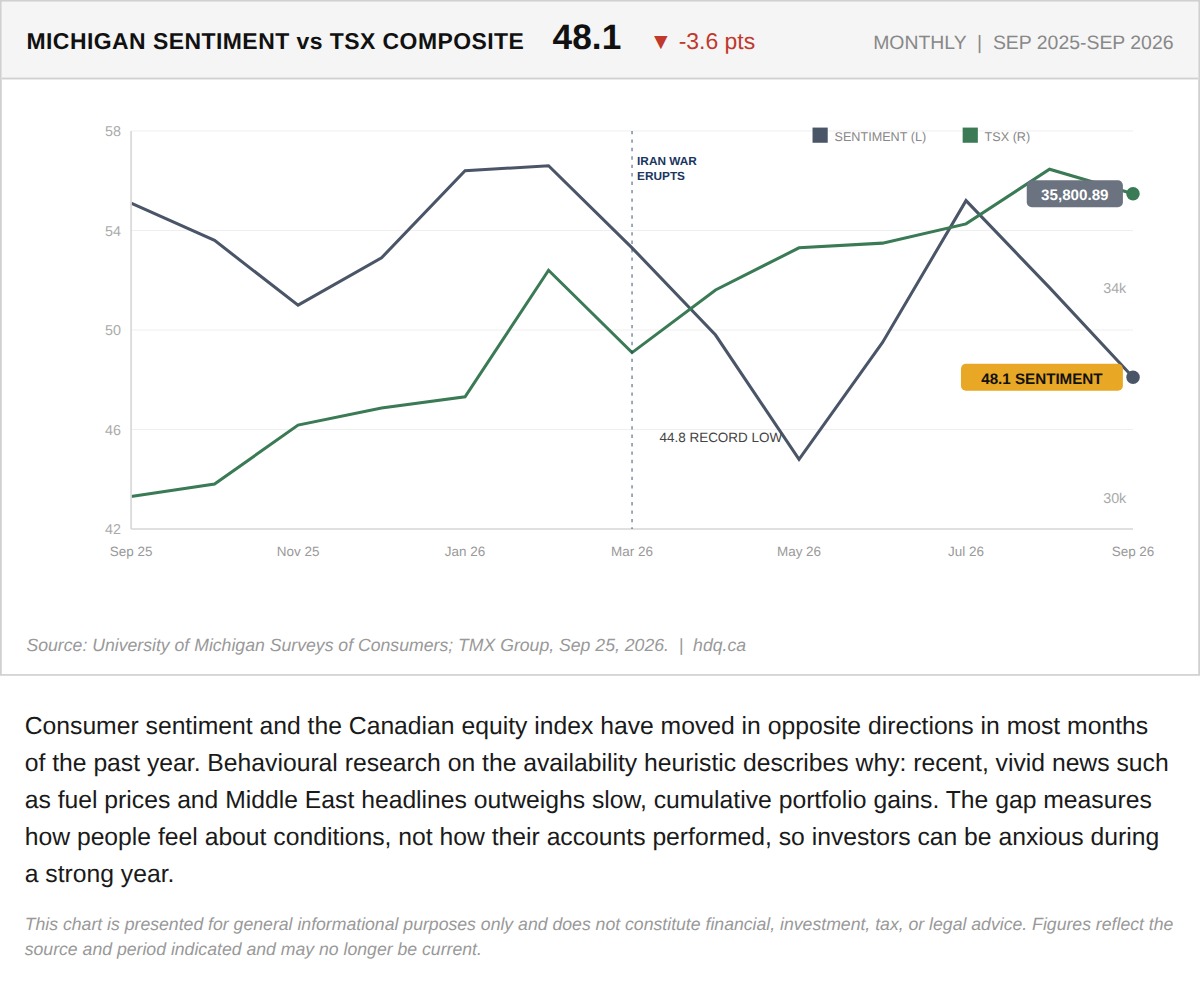
Consumer sentiment and the Canadian equity index have moved in opposite directions in most months of the past year.
Consumer Sentiment Falls While the TSX Rises
September 28, 2026
View chart & download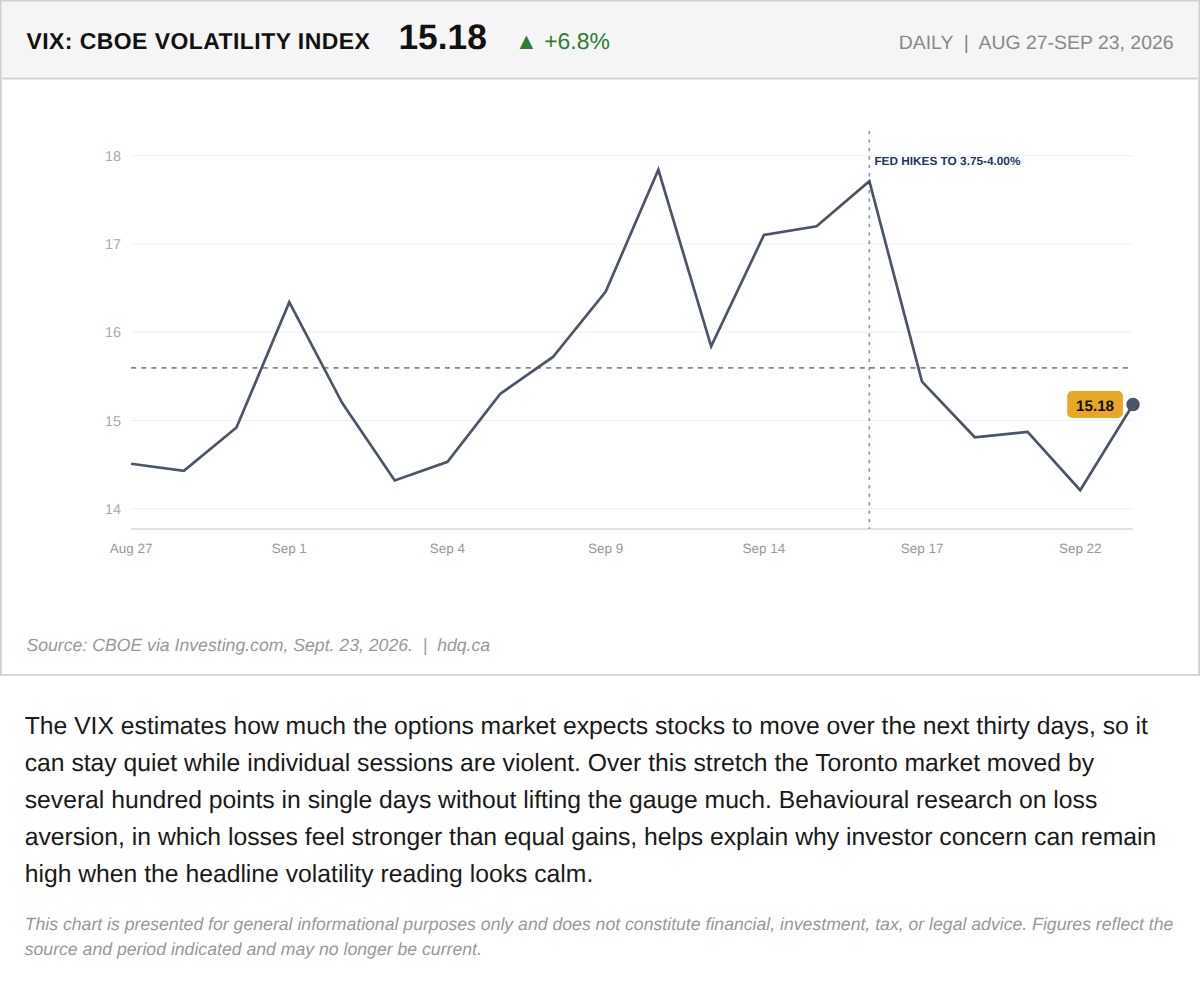
The VIX estimates how much the options market expects stocks to move over the next thirty days, so it can stay quiet while individual sessions are violent.
VIX Stays Subdued While the TSX Swings
September 24, 2026
View chart & download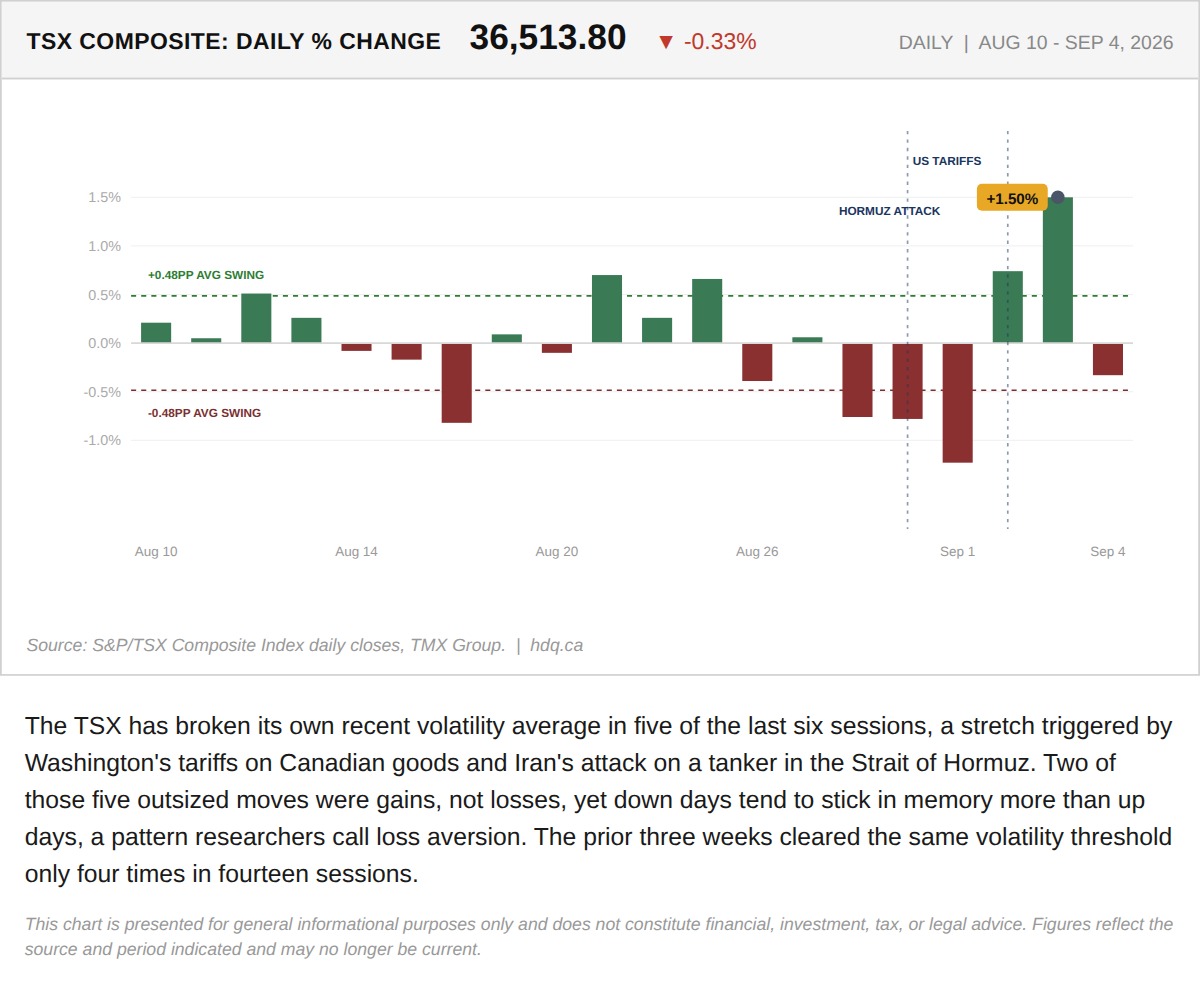
The TSX has broken its own recent volatility average in five of the last six sessions, a stretch triggered by Washington's tariffs on…
Why This Week Feels Worse Than the TSX Actually Performed
September 8, 2026
View chart & download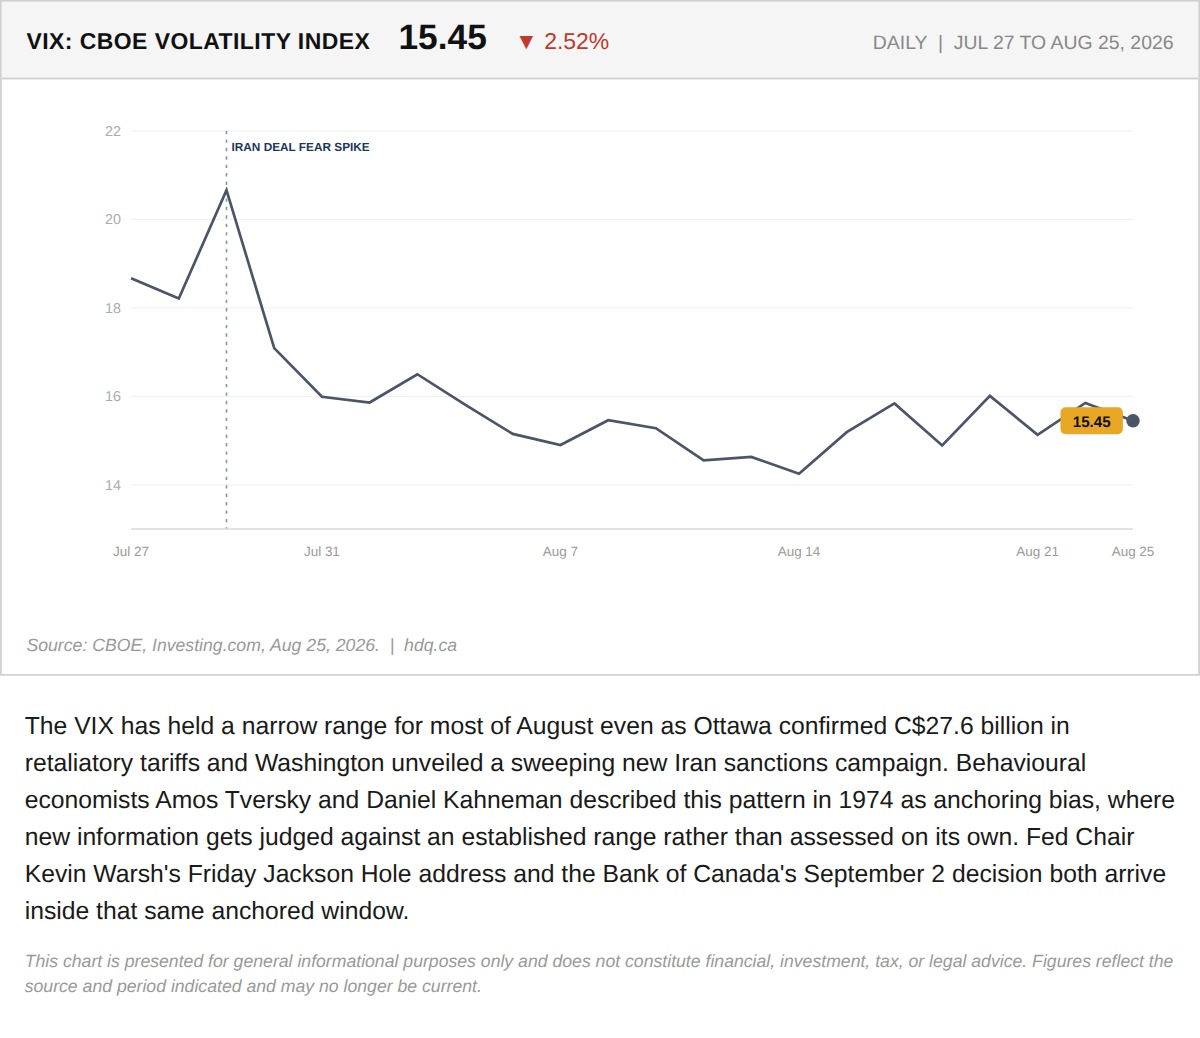
The VIX has held a narrow range for most of August even as Ottawa confirmed C$27.6 billion in retaliatory tariffs and Washington unveiled a sweeping new Iran sanctions campaign.
The VIX Has Not Moved in Three Weeks. That Is Not the Same as Markets Judging the Trade War Small.
August 26, 2026
View chart & download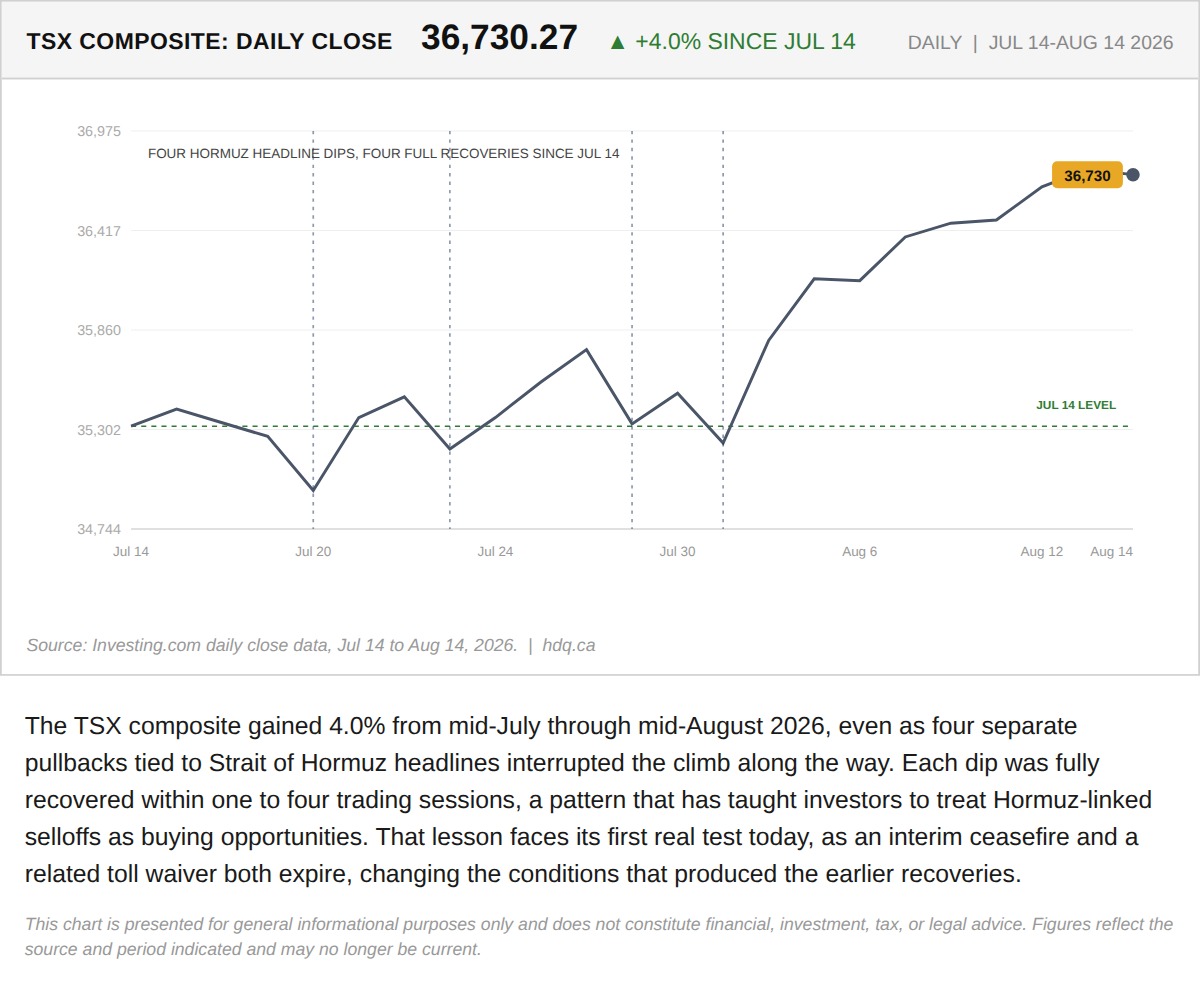
The TSX composite gained 4.0% from mid-July through mid-August 2026, even as four separate pullbacks tied to Strait of Hormuz headlines interrupted the climb along the way.
Four Hormuz Dips Recovered in a Month. Today Tests Whether the Pattern Holds.
August 17, 2026
View chart & download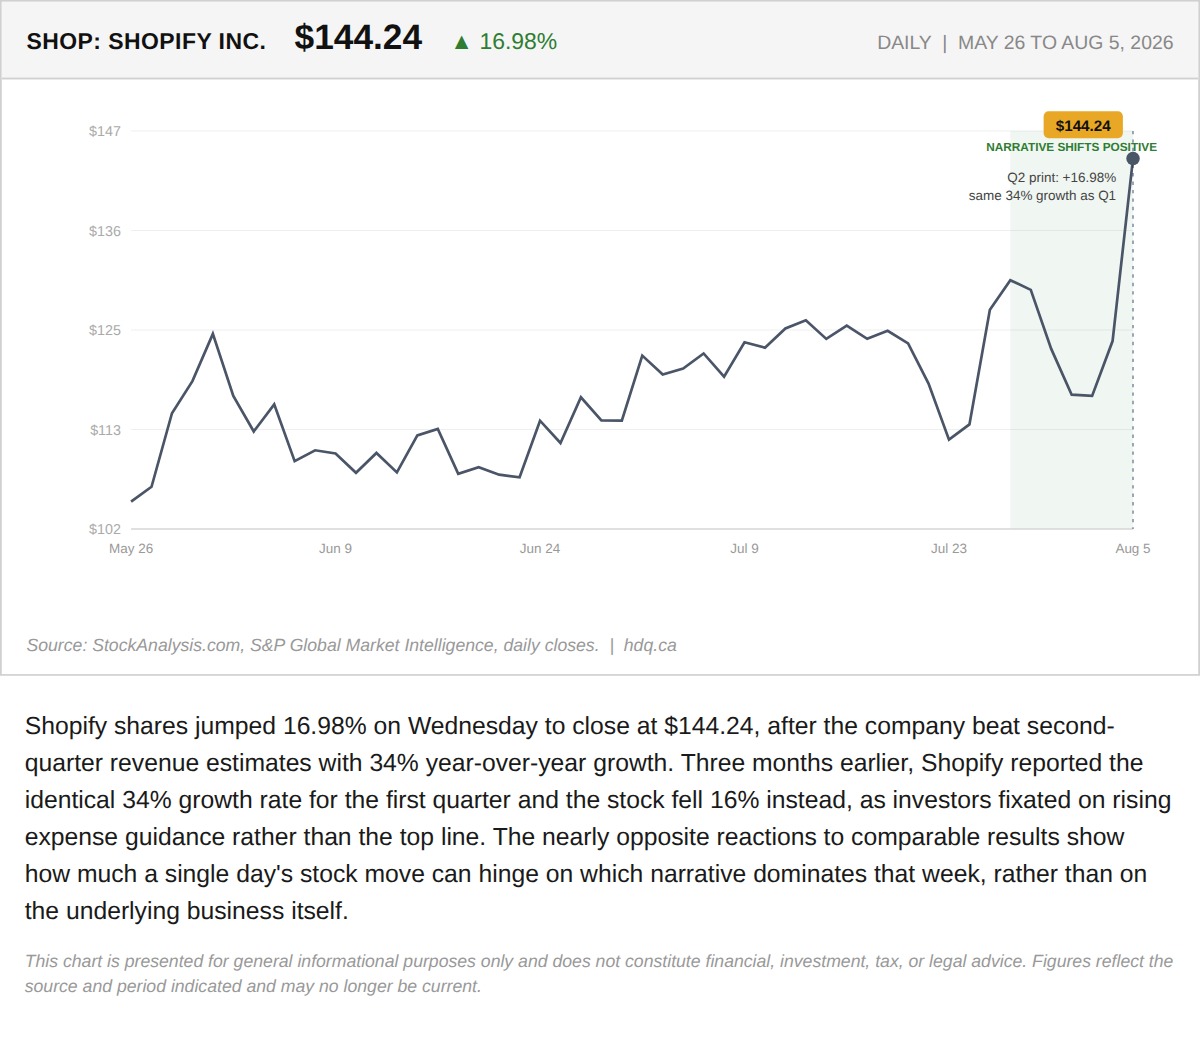
Shopify shares jumped 16.98% on Wednesday to close at $144.24, after the company beat second-quarter revenue estimates with 34% year-over-year growth.
Shopify's Stock Swung 33 Points on Nearly Identical Earnings Reports
August 5, 2026
View chart & download