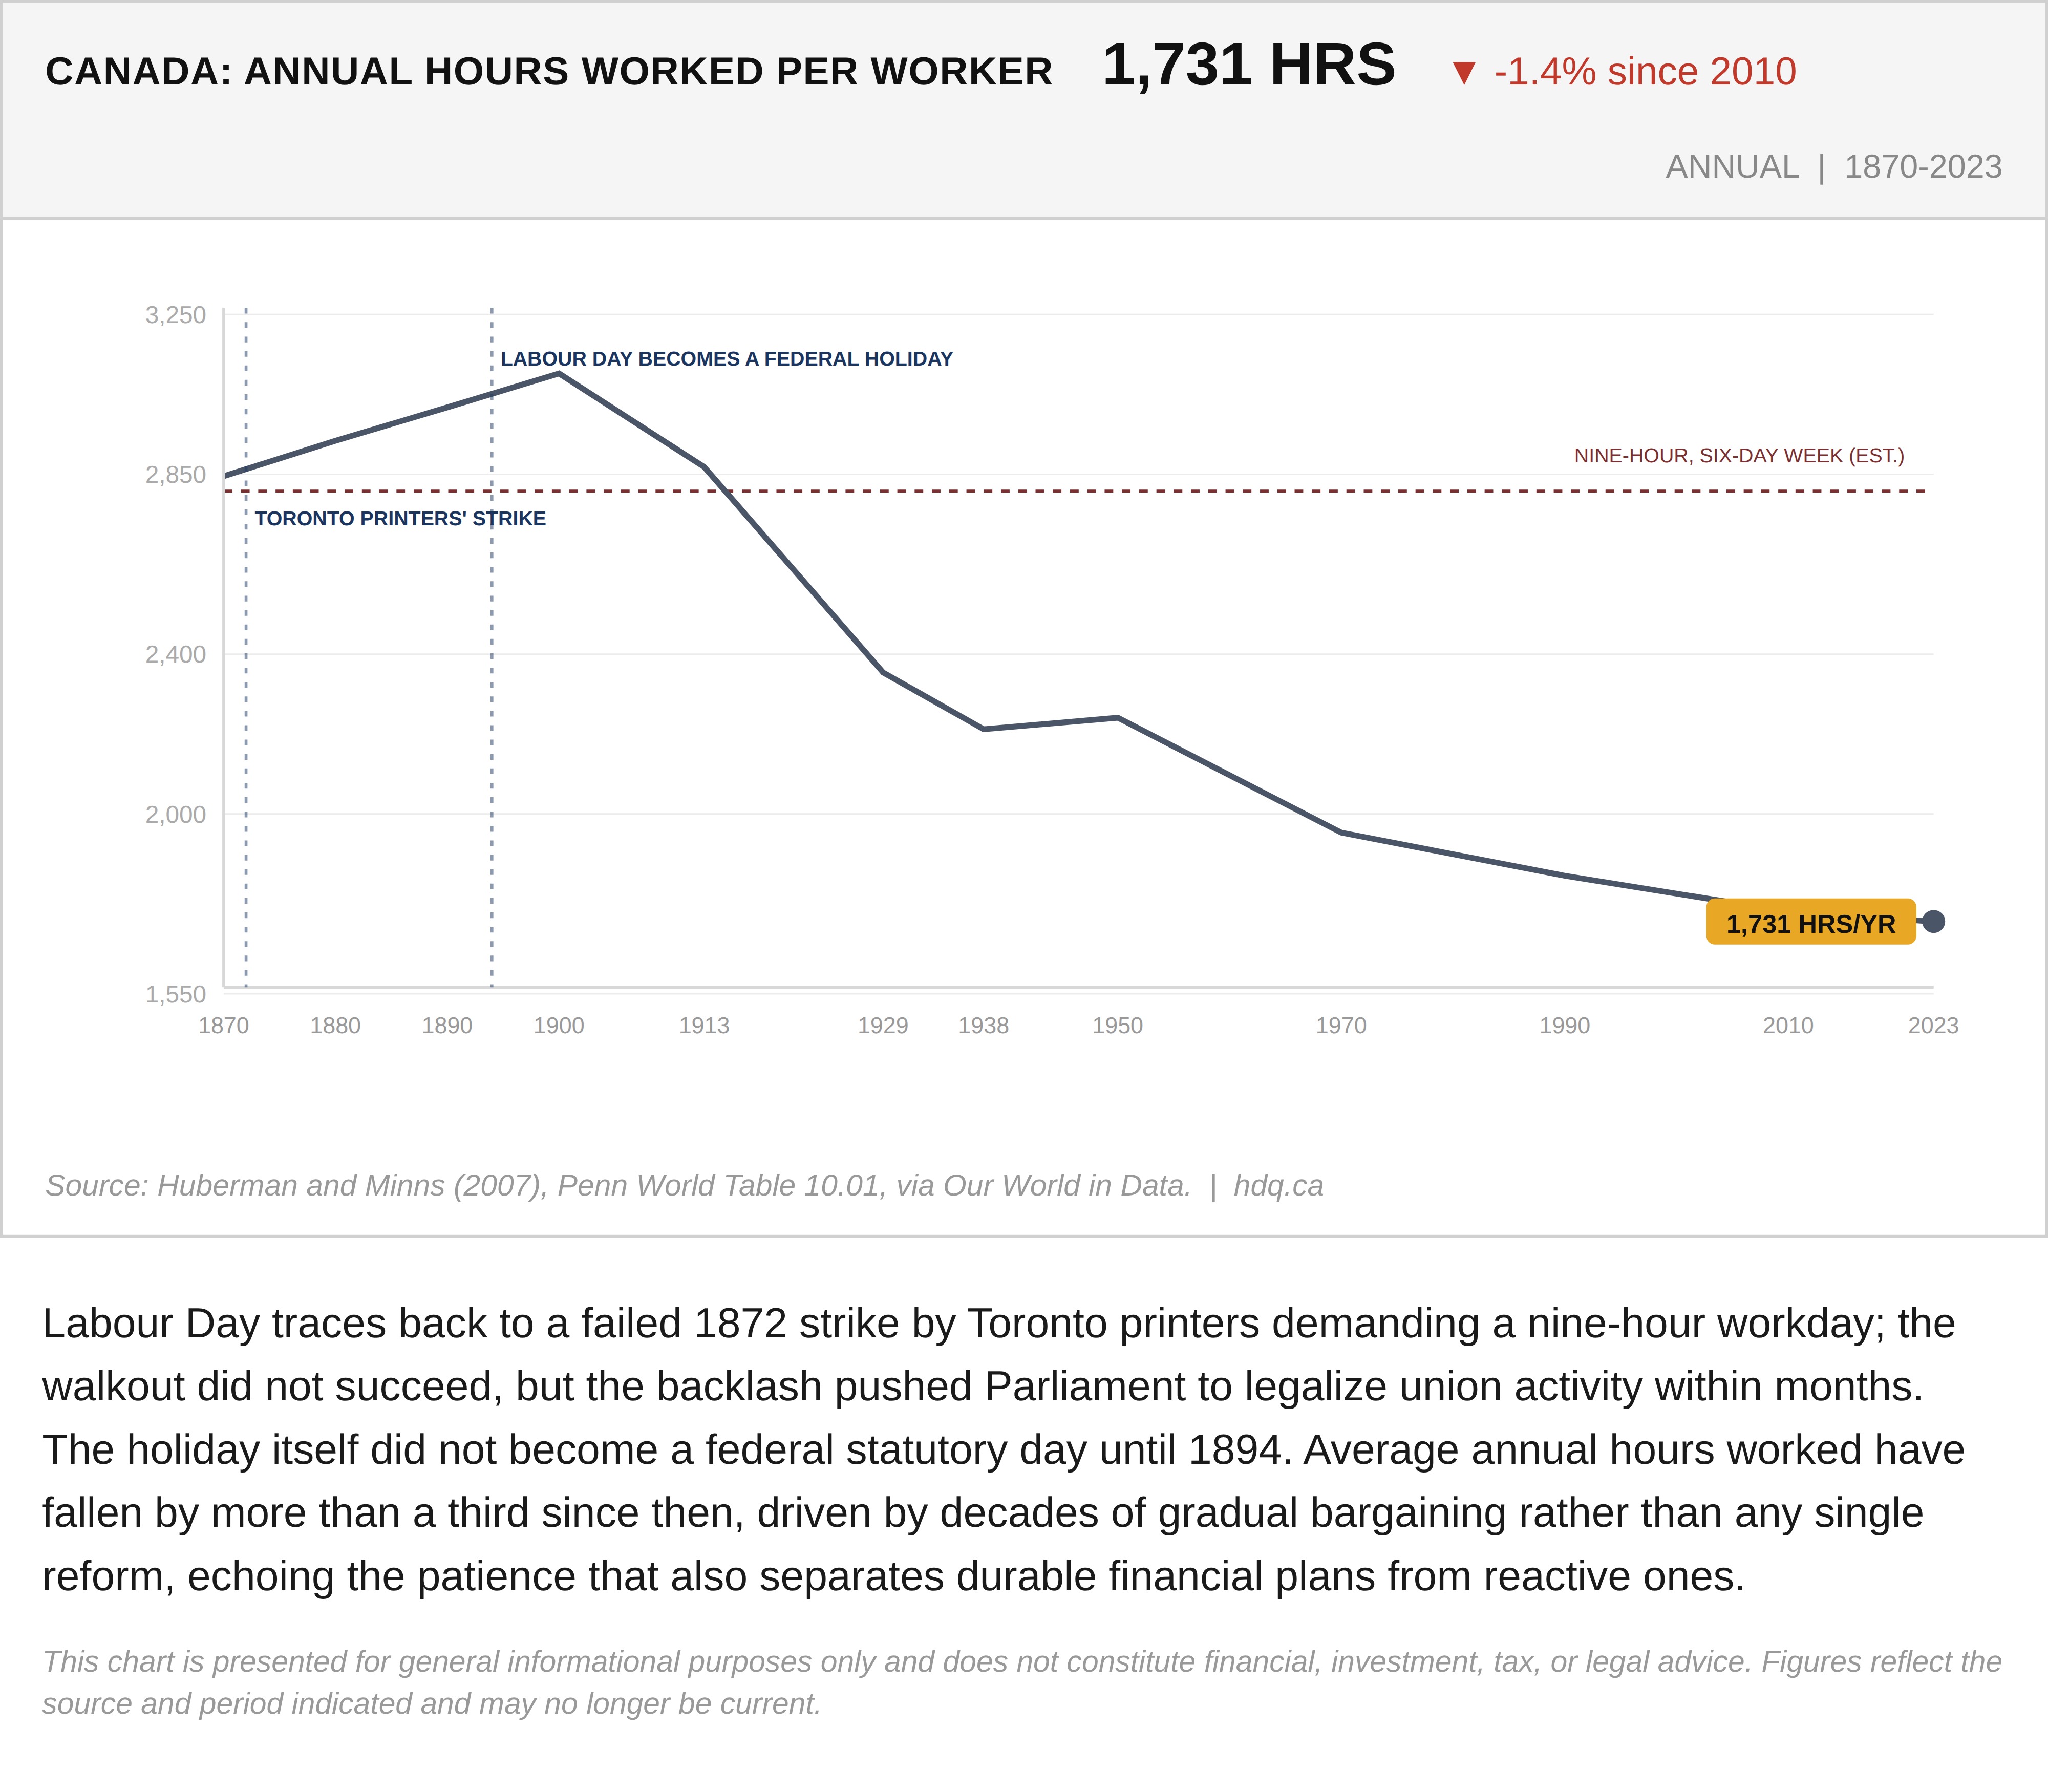
Labour Day traces back to a failed 1872 strike by Toronto printers demanding a nine-hour workday; the walkout did not succeed, but the backlash pushed Parliament to legalize union activity within months. The holiday itself did not become a federal statutory day until 1894. Average annual hours worked have fallen by more than a third since then, driven by decades of gradual bargaining rather than any single reform, echoing the patience that also separates durable financial plans from reactive ones.
This chart is presented for general informational purposes only and does not constitute financial, investment, tax, or legal advice. Figures reflect the source and period indicated and may no longer be current.
Related charts
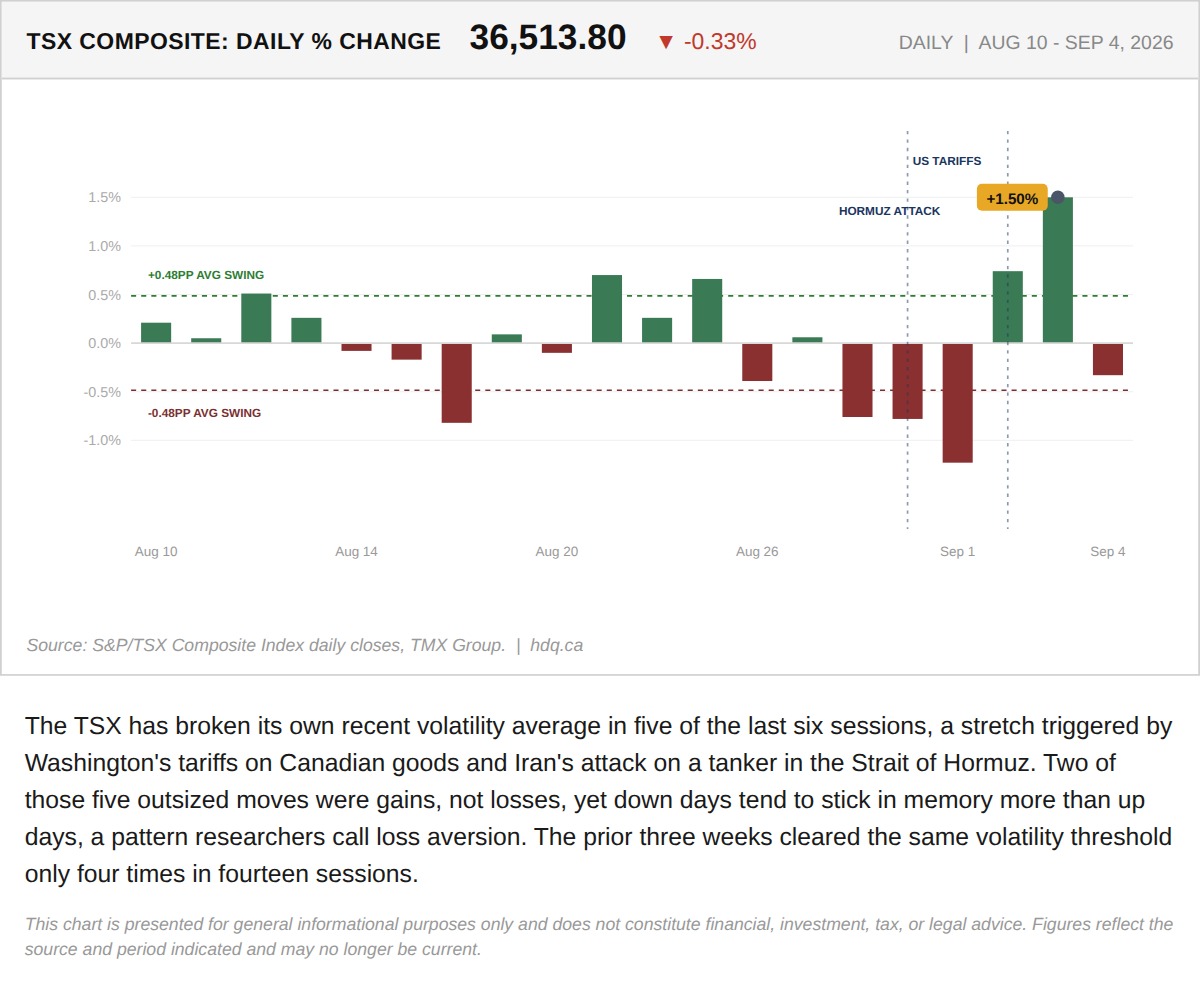
The TSX has broken its own recent volatility average in five of the last six sessions, a stretch triggered by Washington's tariffs on…
Why This Week Feels Worse Than the TSX Actually Performed
September 8, 2026
View chart & download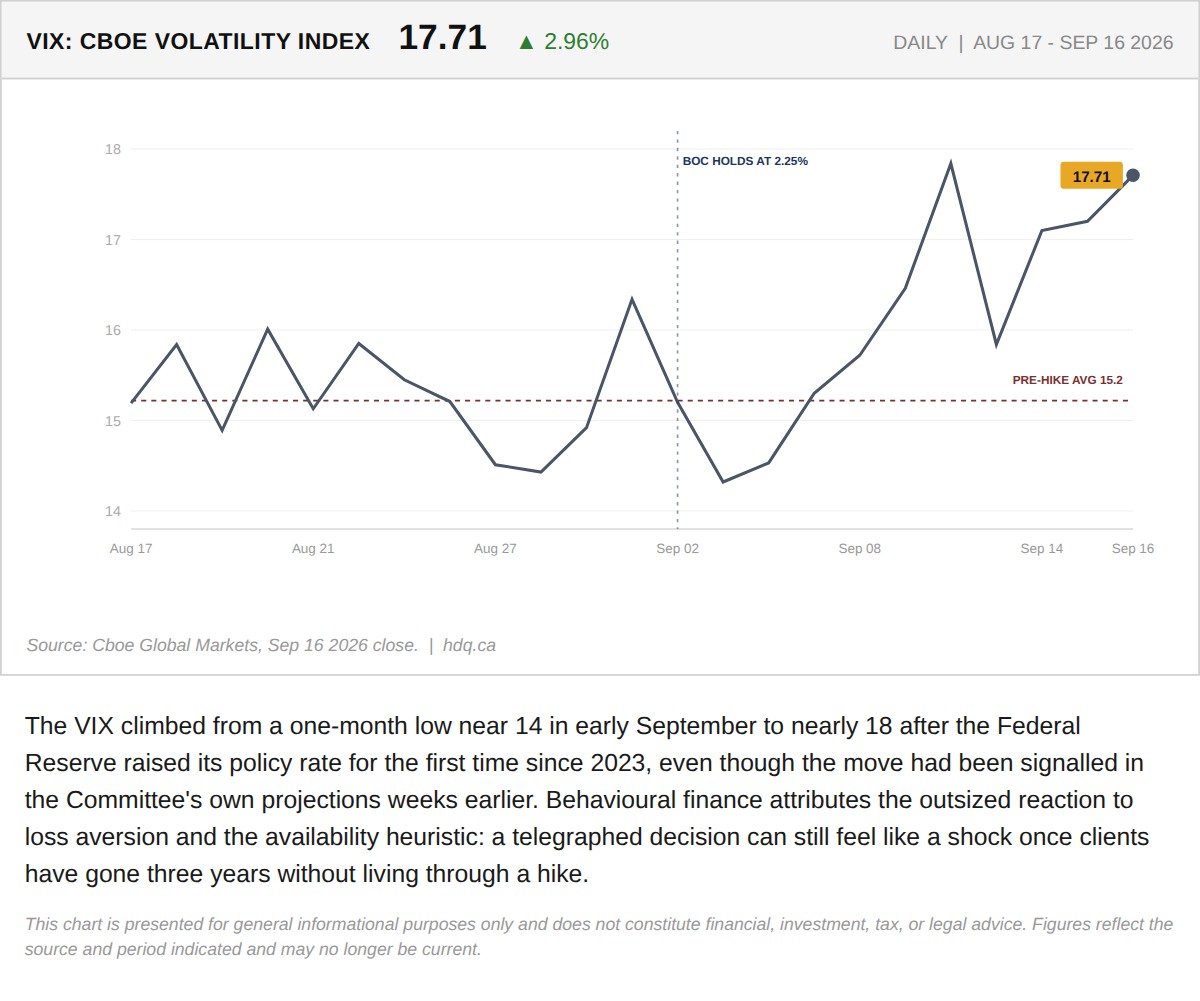
The VIX climbed from a one-month low near 14 in early September to nearly 18 after the Federal Reserve raised its policy rate for the first…
Why an Expected Rate Hike Still Triggered a 631-Point Selloff
September 17, 2026
View chart & download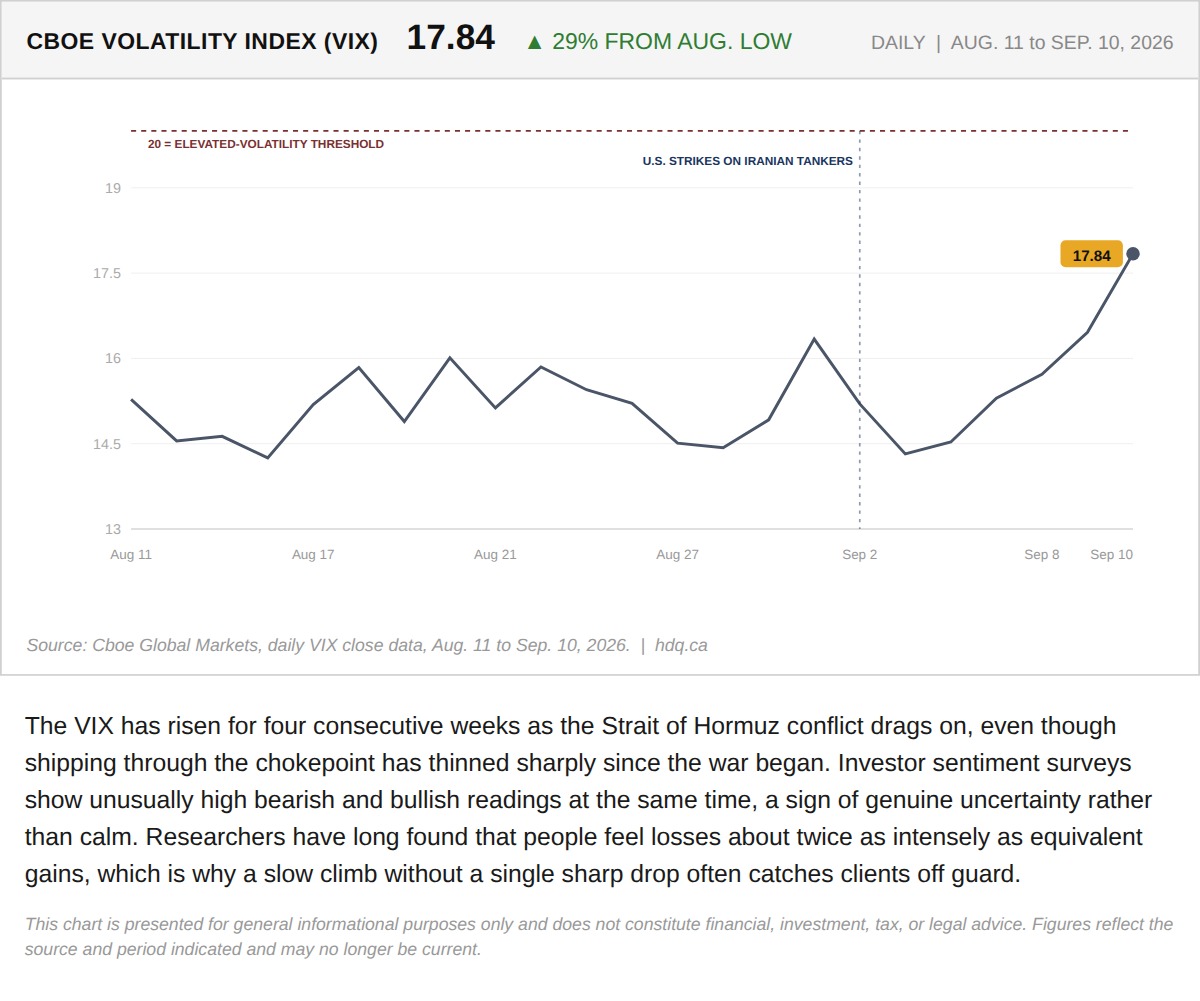
The VIX has risen for four consecutive weeks as the Strait of Hormuz conflict drags on, even though shipping through the chokepoint has thinned sharply since the war began.
The VIX's Quiet Four-Week Climb Is a Textbook Case of Recency Bias in Reverse
September 11, 2026
View chart & download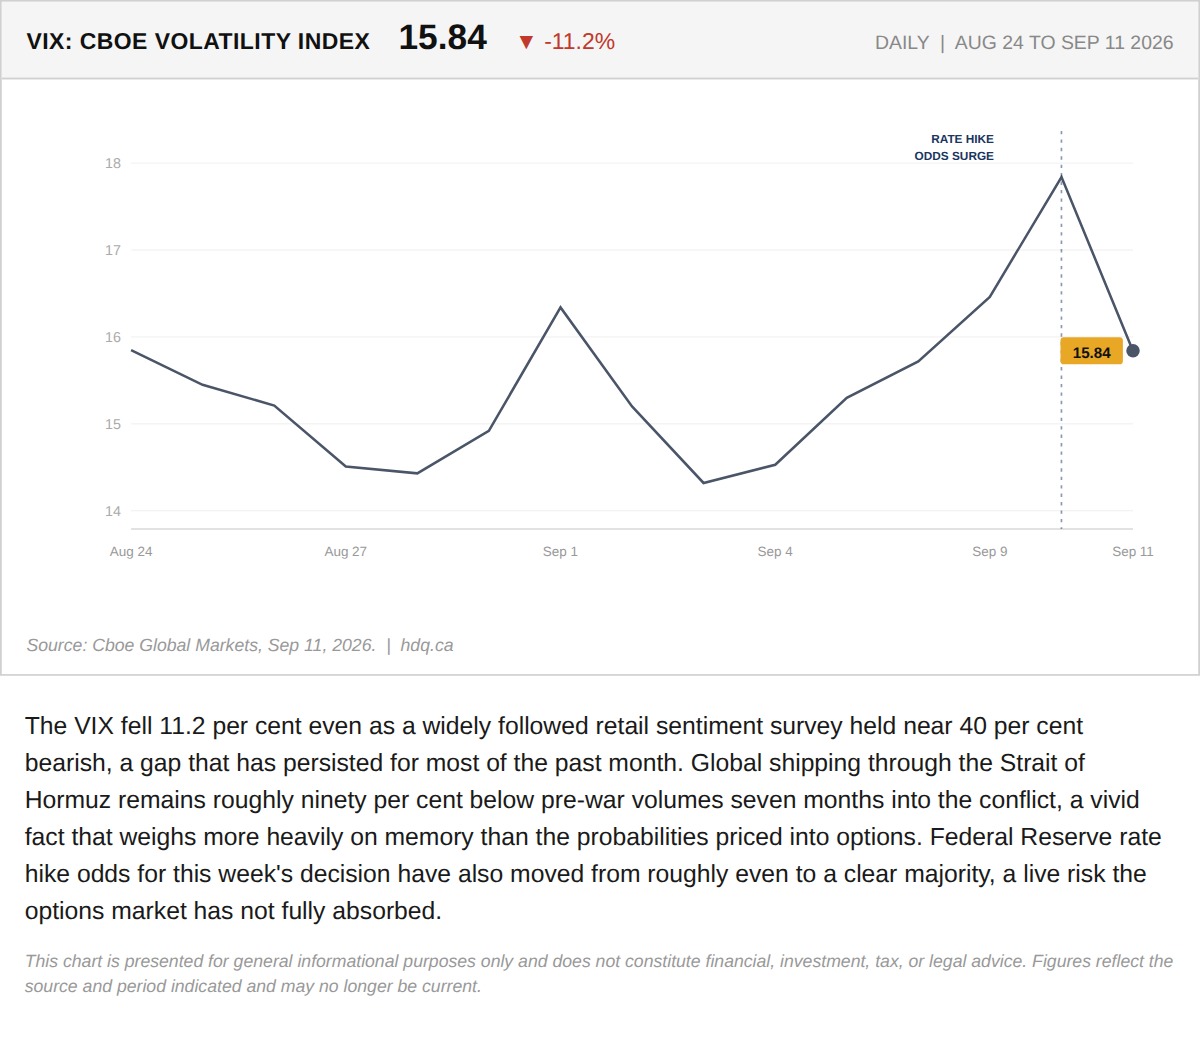
The VIX fell 11.2 per cent even as a widely followed retail sentiment survey held near 40 per cent bearish, a gap that has persisted for most of the past month.
Retail Investors Are More Afraid of the Hormuz War Than the Market Is
September 14, 2026
View chart & download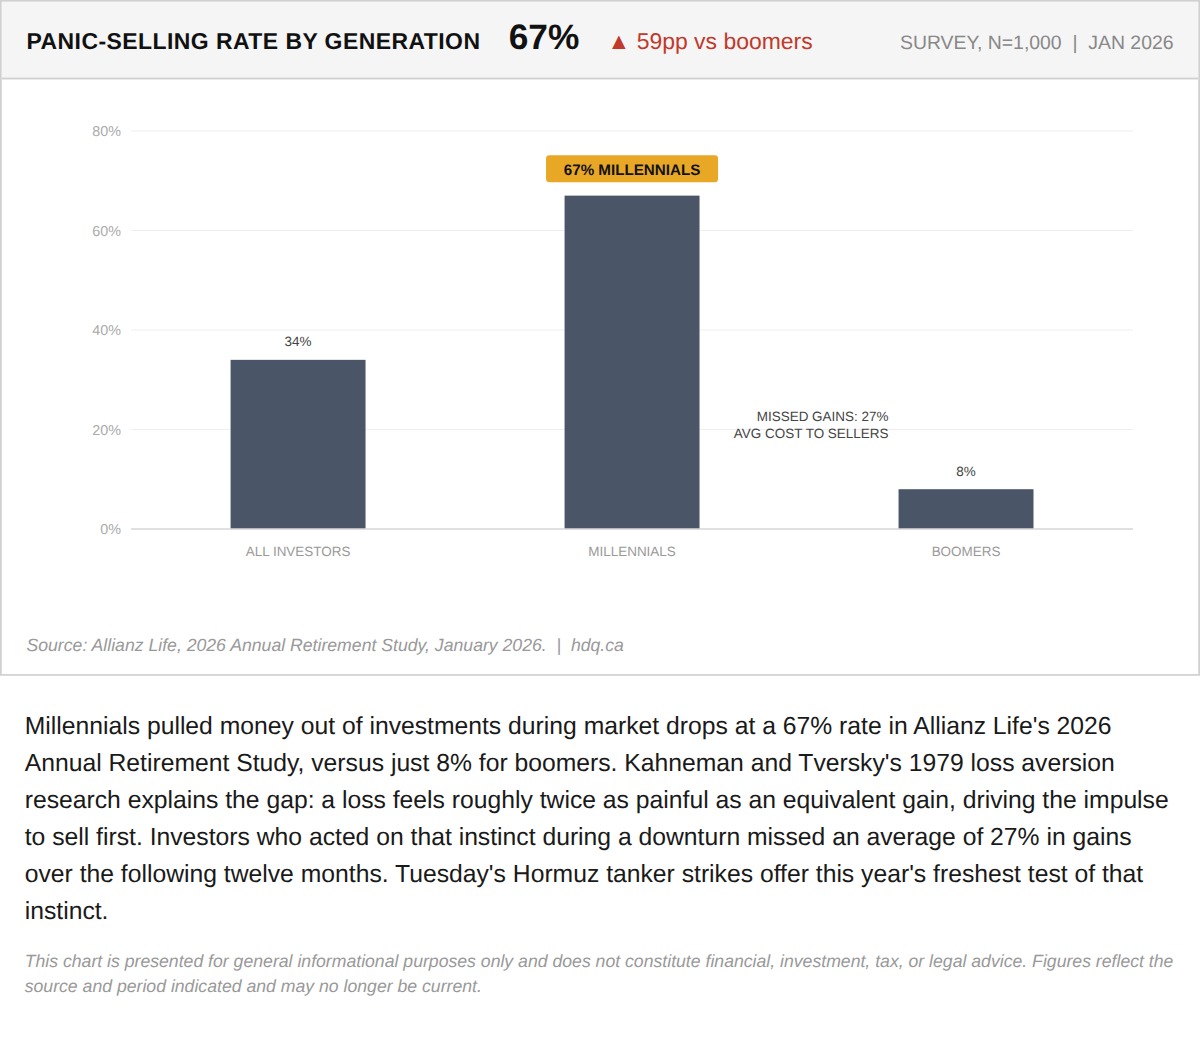
Millennials pulled money out of investments during market drops at a 67% rate in Allianz Life's 2026 Annual Retirement Study, versus just 8% for boomers.
Why Millennials Panic-Sell Eight Times More Than Boomers
September 1, 2026
View chart & download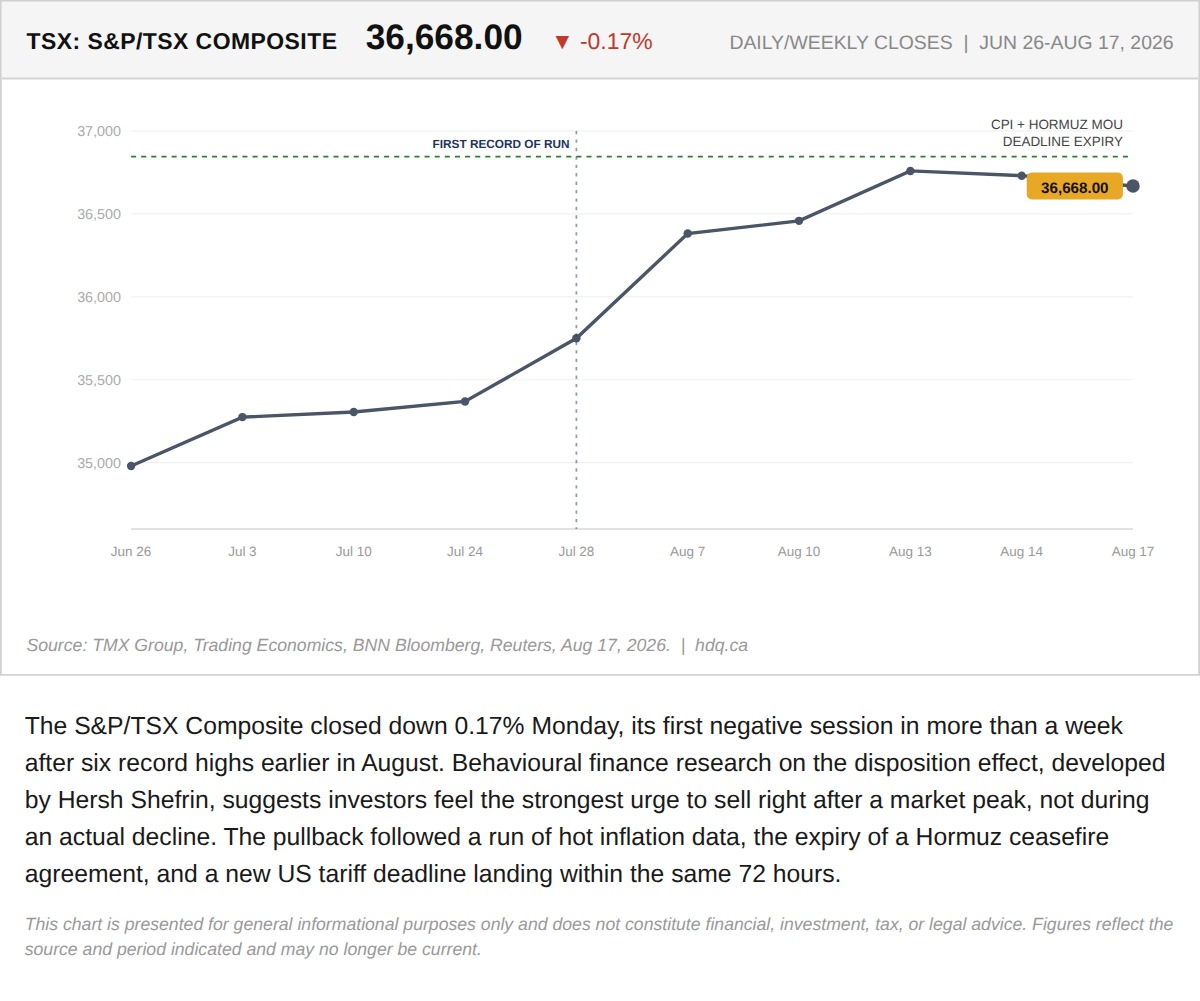
The S&P/TSX Composite closed down 0.17% Monday, its first negative session in more than a week after six record highs earlier in August.
TSX Pullback Tests the Disposition Effect
August 18, 2026
View chart & download