October 2026
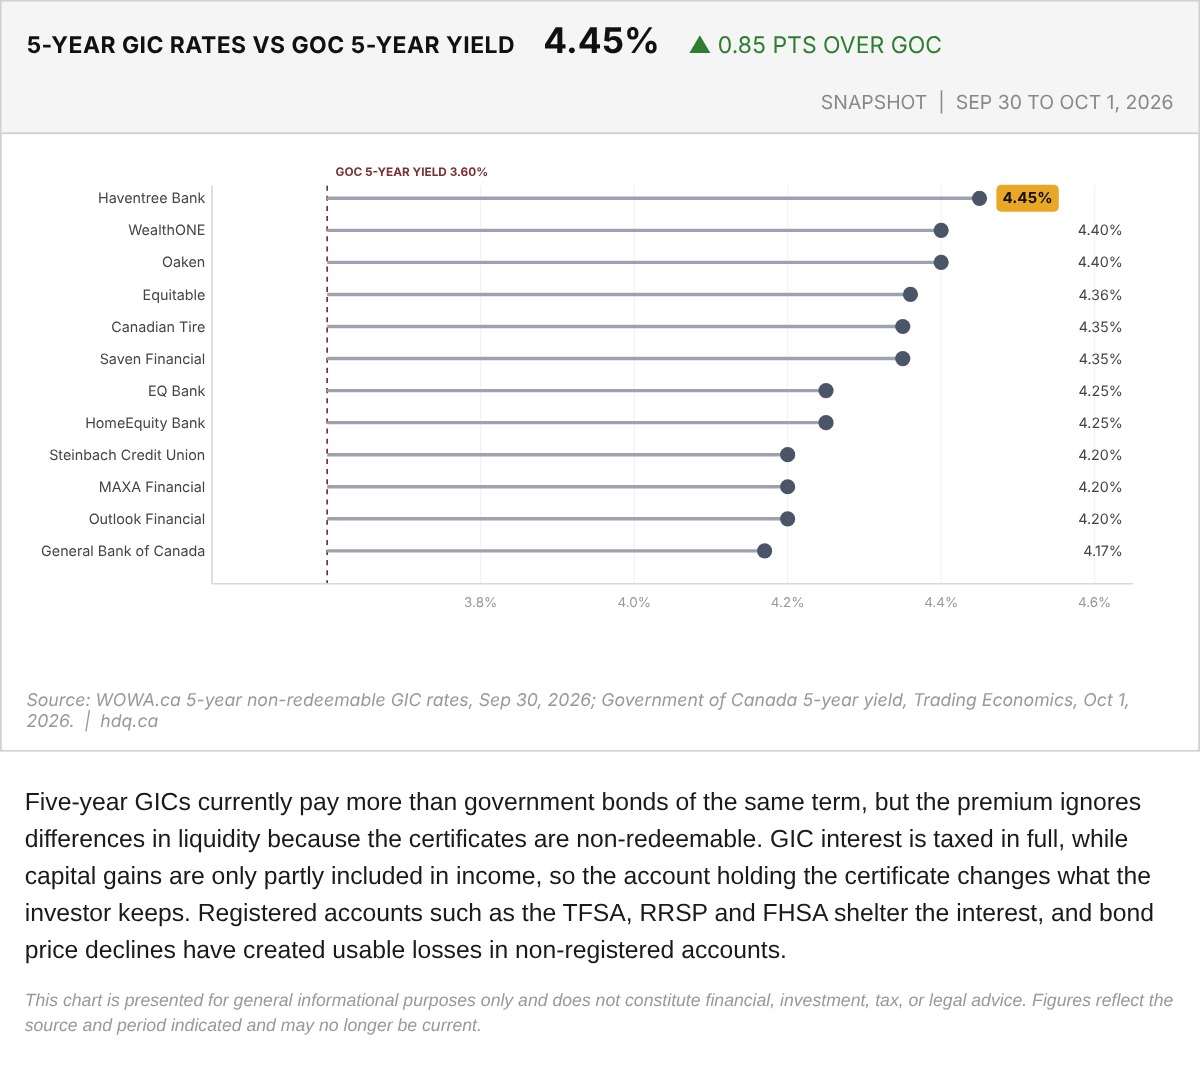
Five-year GICs currently pay more than government bonds of the same term, but the premium ignores differences in liquidity because the certificates are non-redeemable.
Five-Year GIC Rates Versus the Government of Canada 5-Year Yield, September 30 to October 1, 2026
October 2, 2026
View chart & download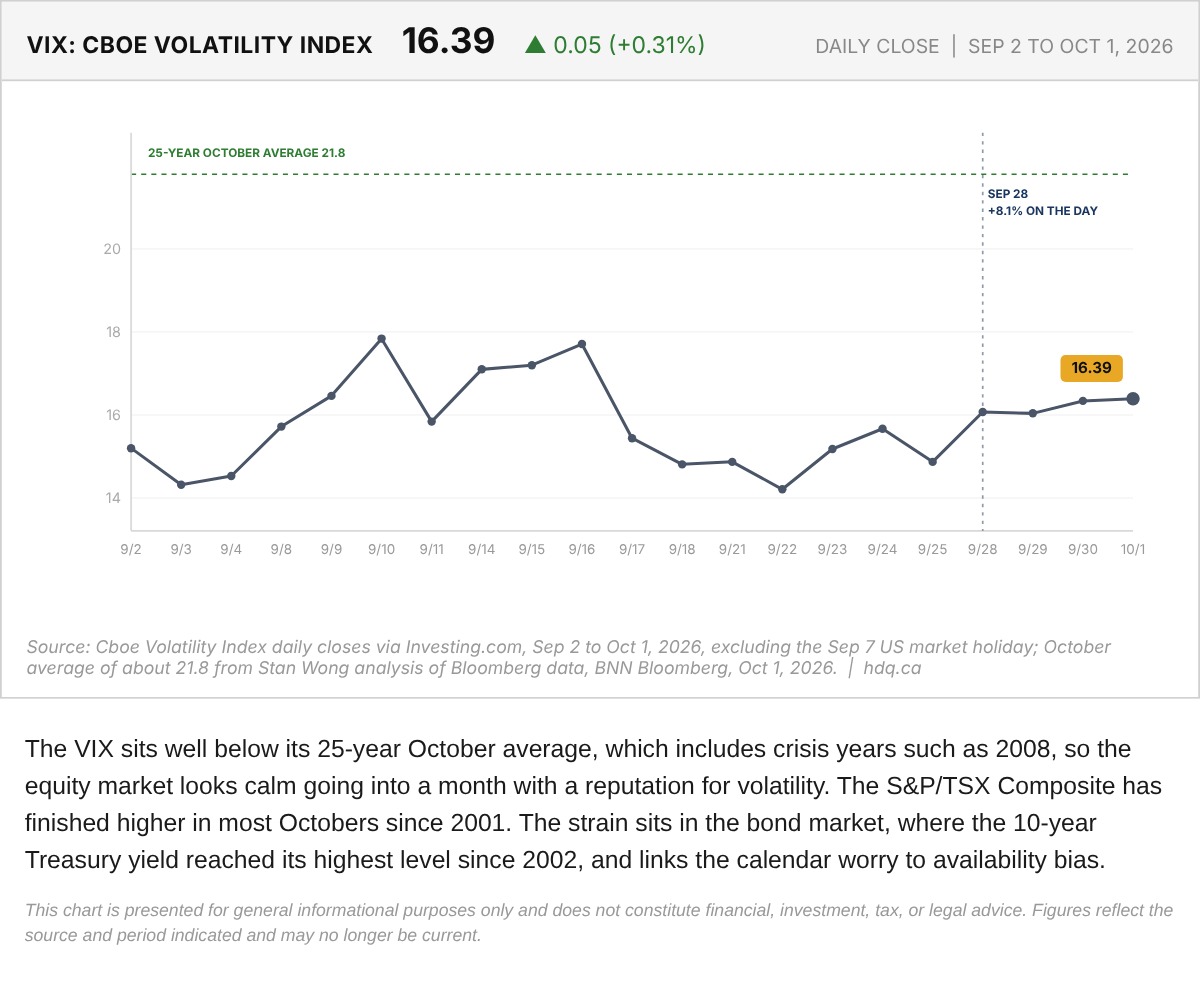
The VIX sits well below its 25-year October average, which includes crisis years such as 2008, so the equity market looks calm going into a month with a reputation for volatility.
Cboe Volatility Index (VIX) and the October Average, September 2 to October 1, 2026
October 2, 2026
View chart & download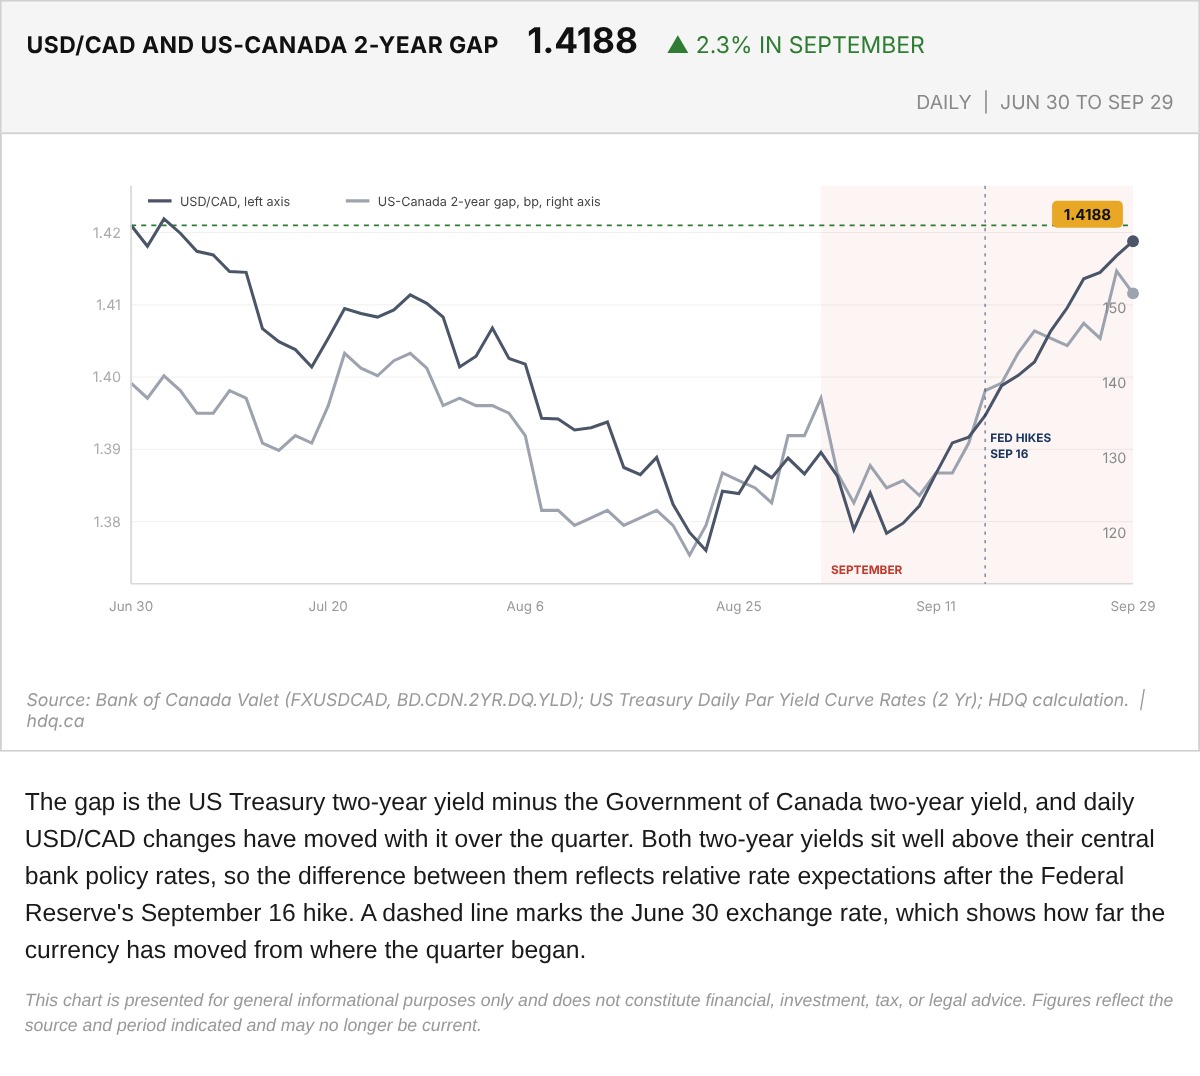
The gap is the US Treasury two-year yield minus the Government of Canada two-year yield, and daily USD/CAD changes have moved with it over the quarter.
USD/CAD and the US-Canada Two-Year Yield Gap, June 30 to September 29, 2026
October 1, 2026
View chart & download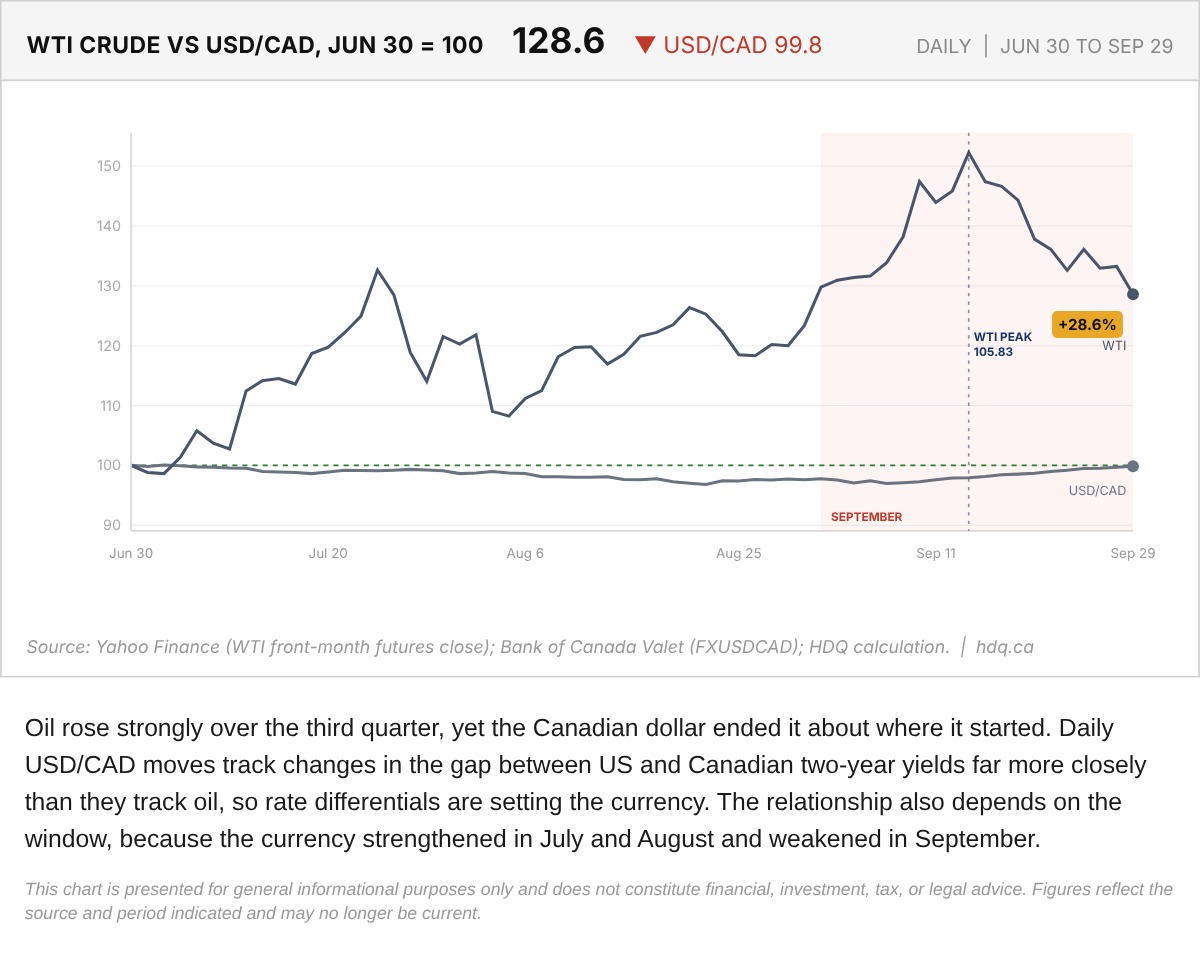
Oil rose strongly over the third quarter, yet the Canadian dollar ended it about where it started.
WTI Crude Oil and USD/CAD Indexed to June 30, 2026
October 1, 2026
View chart & download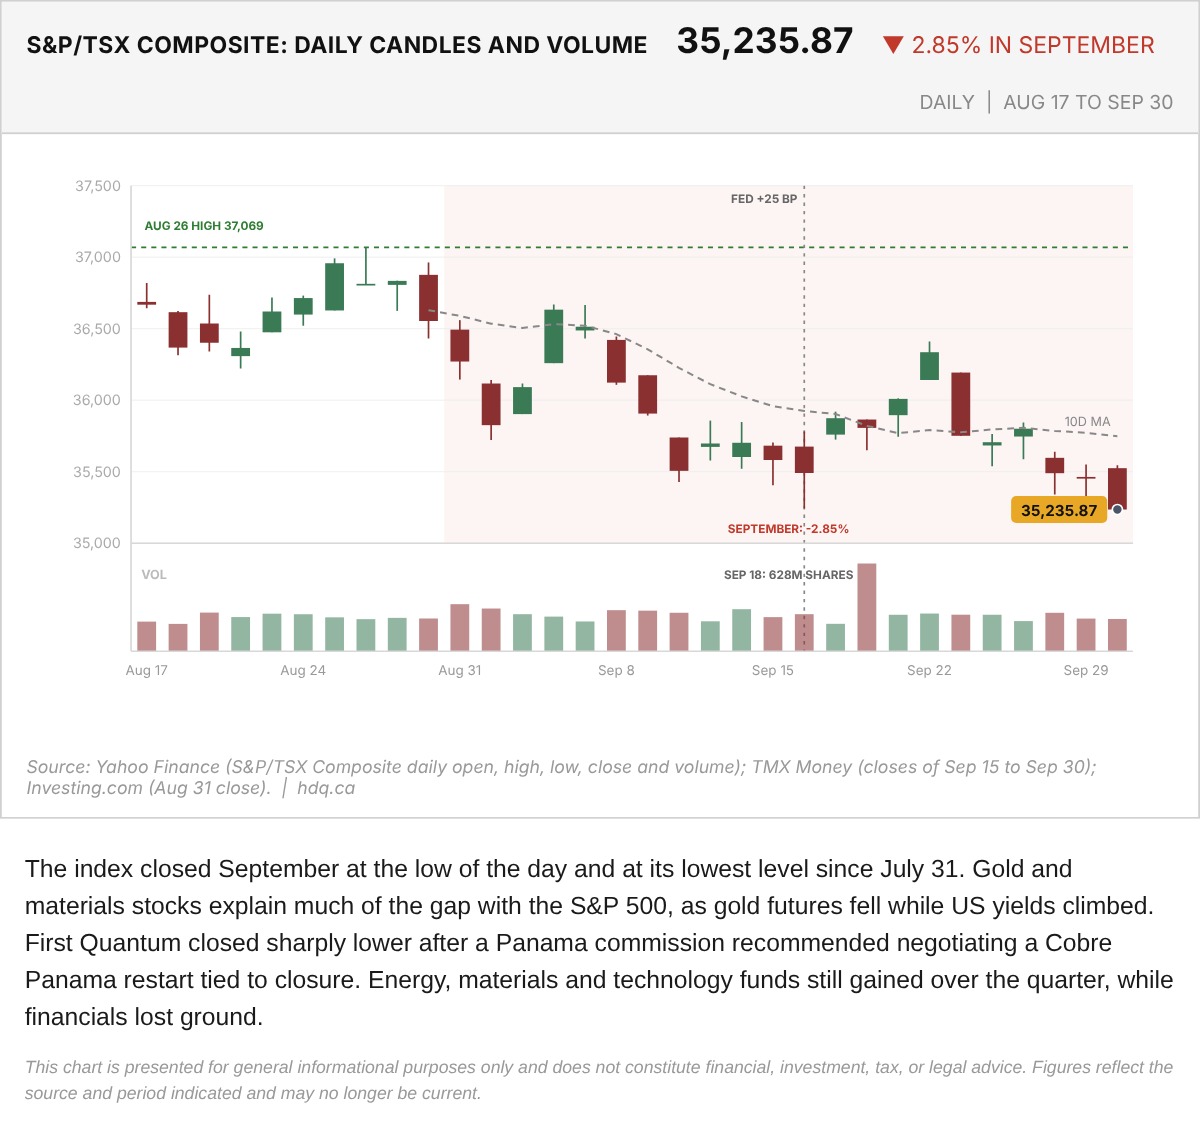
The index closed September at the low of the day and at its lowest level since July 31.
S&P/TSX Composite Daily Candles and Volume, August 17 to September 30, 2026
October 1, 2026
View chart & download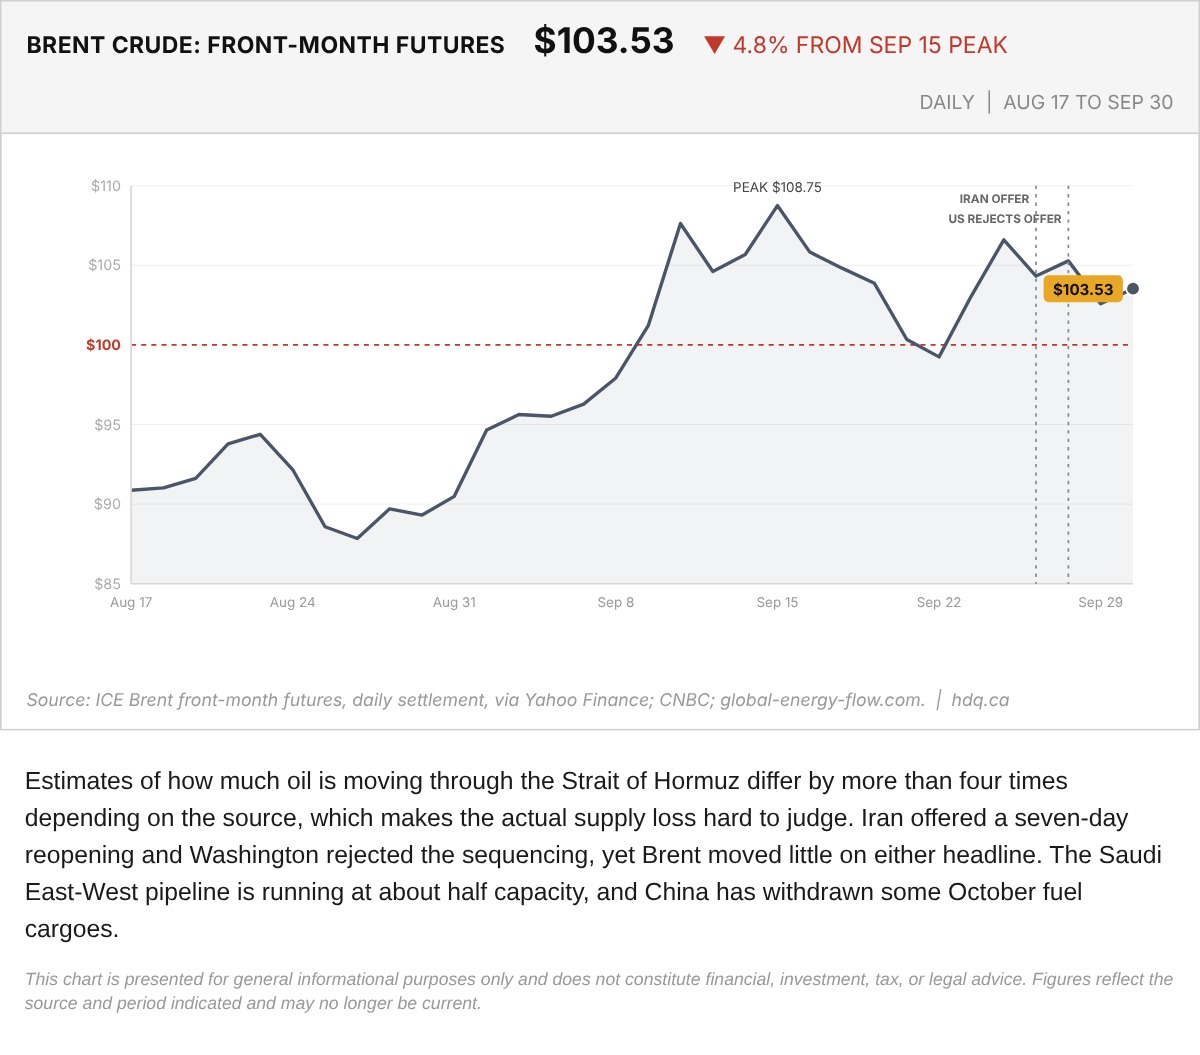
Estimates of how much oil is moving through the Strait of Hormuz differ by more than four times depending on the source, which makes the actual supply loss hard to judge.
Brent Crude Front-Month Futures, August 17 to September 30, 2026
October 1, 2026
View chart & download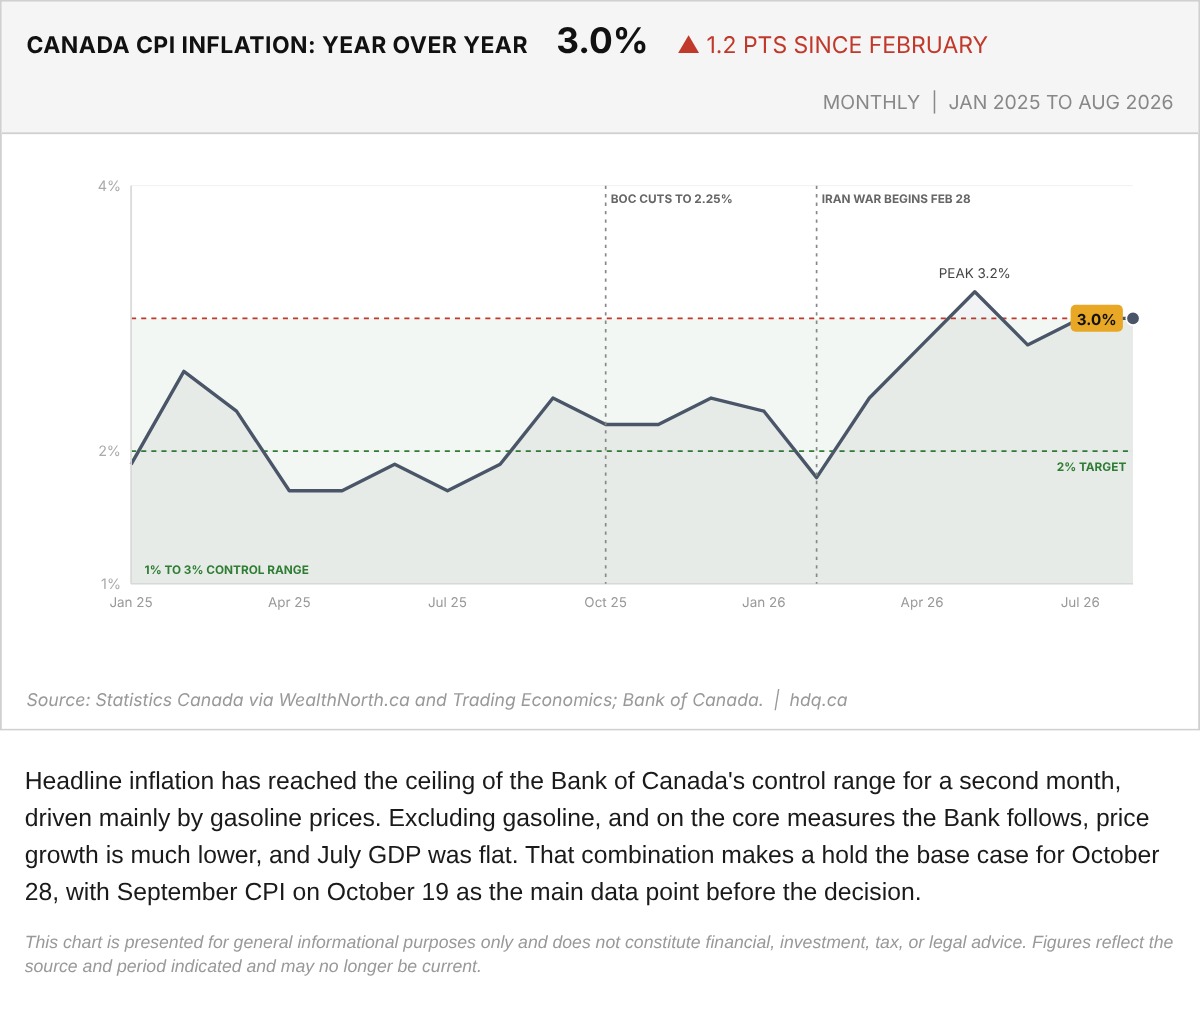
Headline inflation has reached the ceiling of the Bank of Canada's control range for a second month, driven mainly by gasoline prices.
Canada Consumer Price Index Inflation, January 2025 to August 2026
October 1, 2026
View chart & download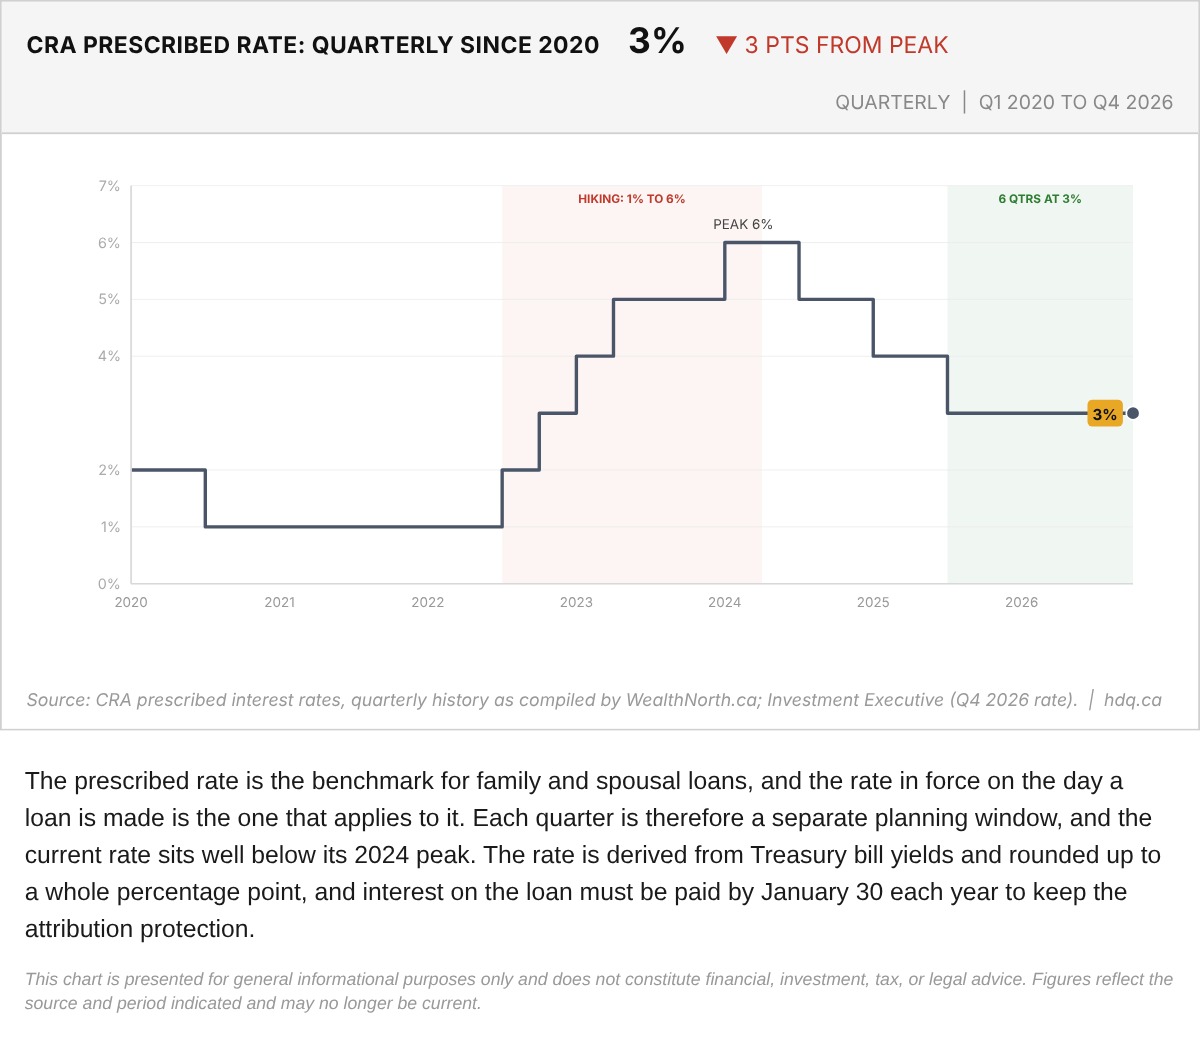
The prescribed rate is the benchmark for family and spousal loans, and the rate in force on the day a loan is made is the one that applies to it.
CRA Prescribed Interest Rate, Quarterly, Q1 2020 to Q4 2026
October 1, 2026
View chart & download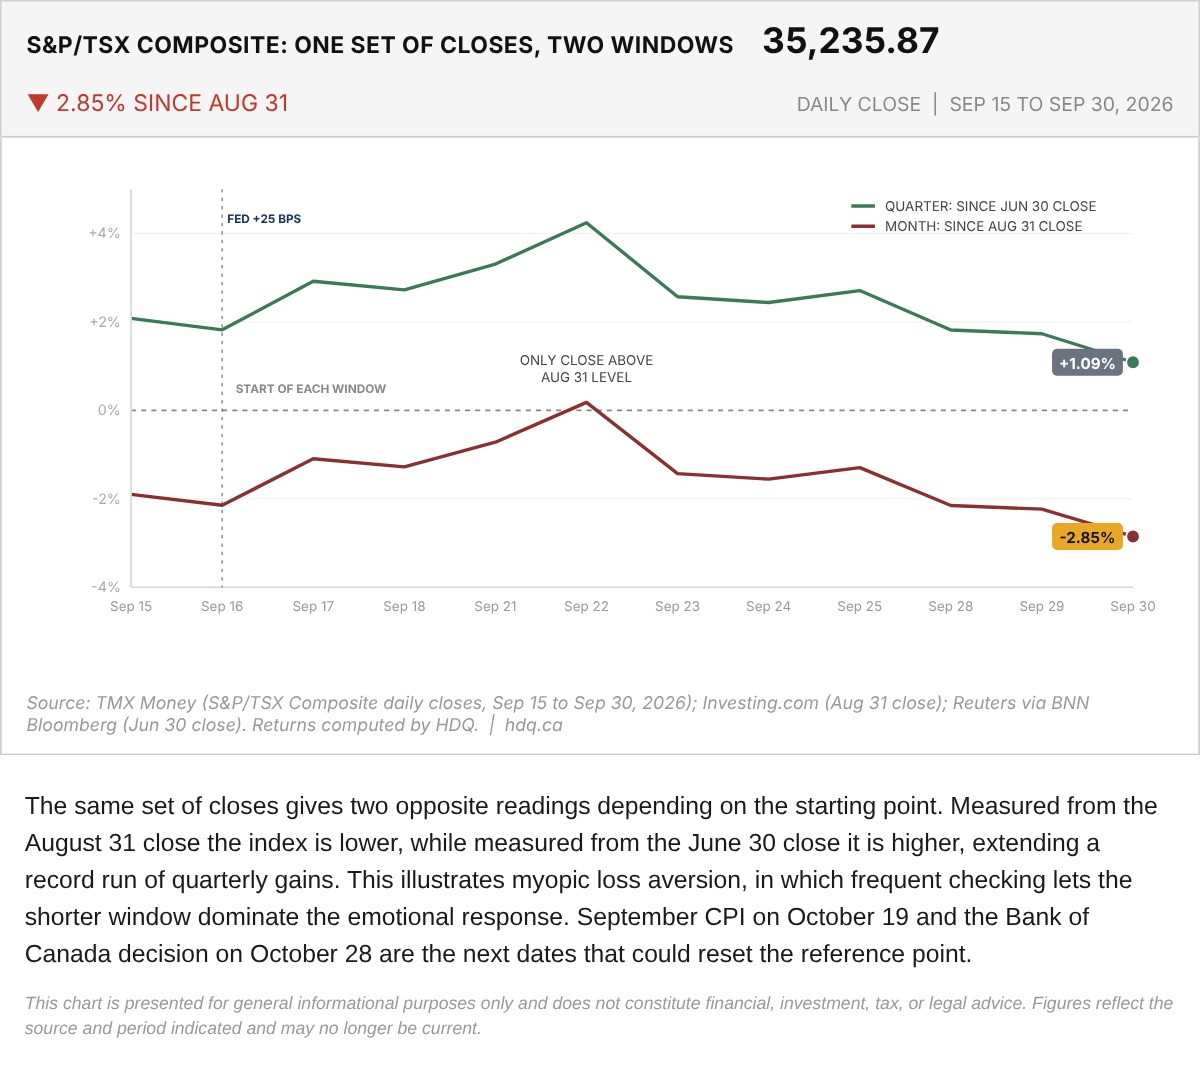
The same set of closes gives two opposite readings depending on the starting point.
S&P/TSX Composite: Monthly and Quarterly Returns From the Same Closes
October 1, 2026
View chart & download