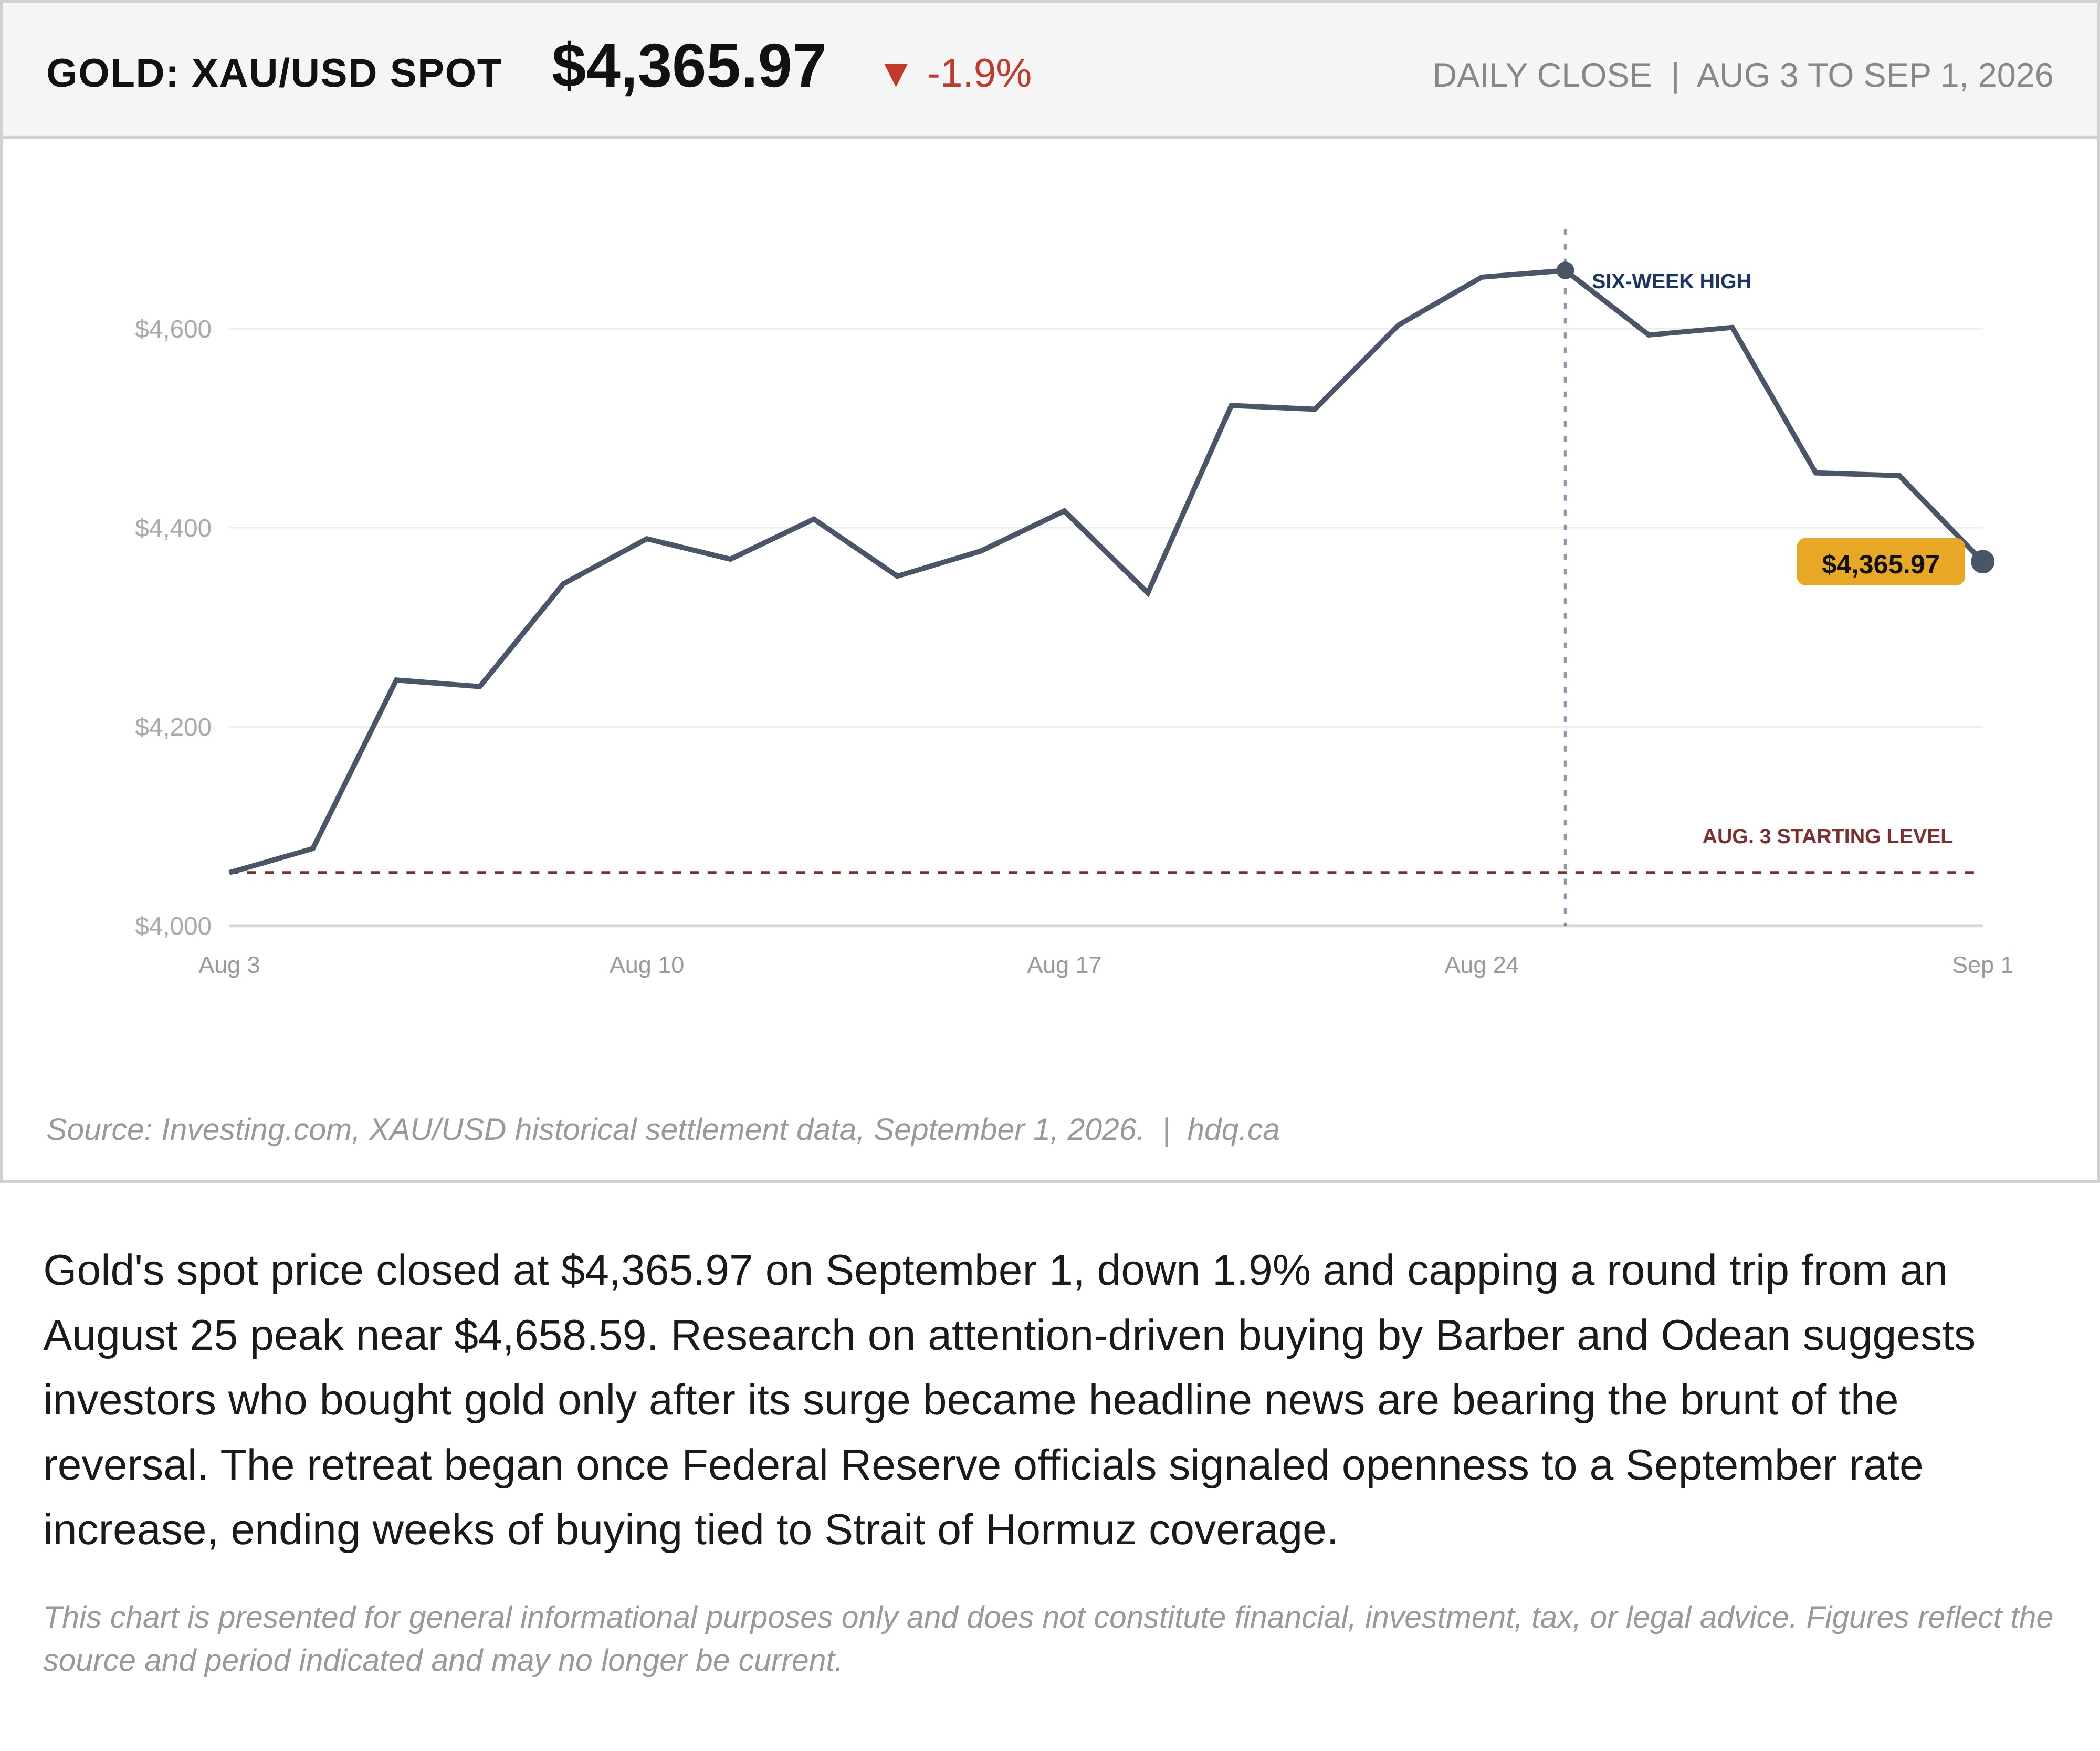
Gold's spot price closed at $4,365.97 on September 1, down 1.9% and capping a round trip from an August 25 peak near $4,658.59. Research on attention-driven buying by Barber and Odean suggests investors who bought gold only after its surge became headline news are bearing the brunt of the reversal. The retreat began once Federal Reserve officials signaled openness to a September rate increase, ending weeks of buying tied to Strait of Hormuz coverage.
This chart is presented for general informational purposes only and does not constitute financial, investment, tax, or legal advice. Figures reflect the source and period indicated and may no longer be current.
Related charts
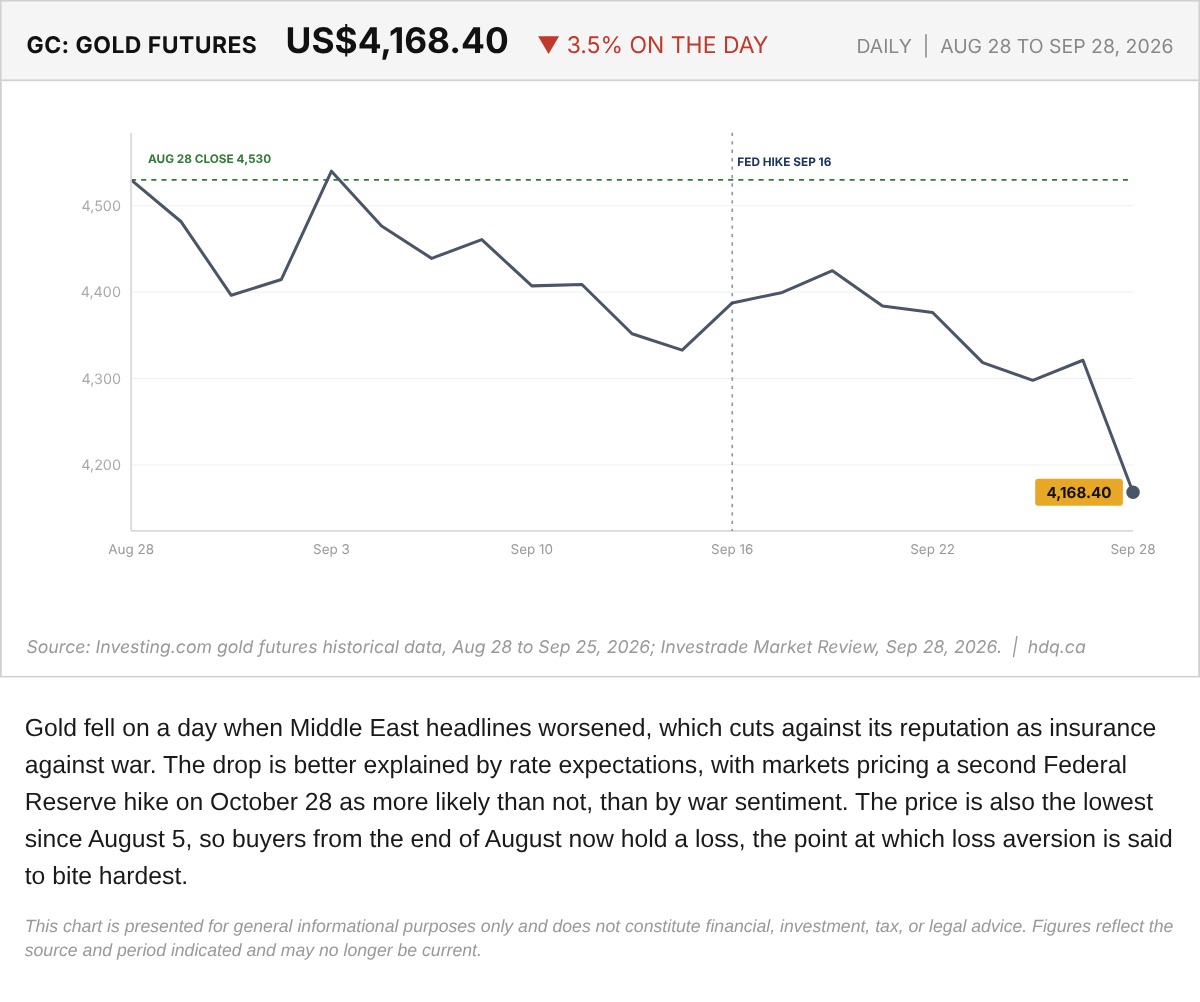
Gold fell on a day when Middle East headlines worsened, which cuts against its reputation as insurance against war.
Gold Futures After the September 28 Selloff, August 28 to September 28, 2026
September 29, 2026
View chart & download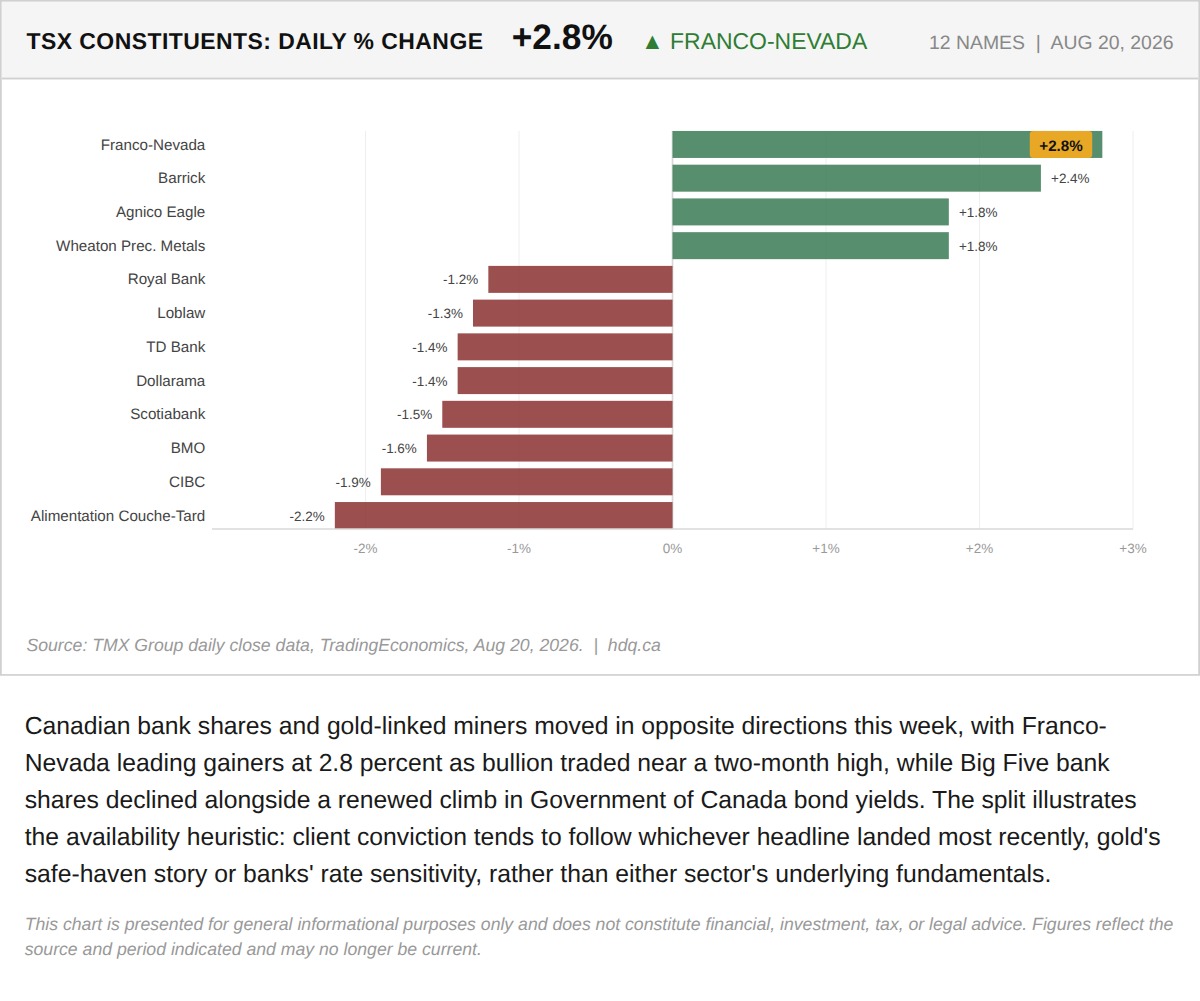
Canadian bank shares and gold-linked miners moved in opposite directions this week, with Franco-Nevada leading gainers at 2.8 percent as…
Gold Miners and Bank Shares Split as Availability Heuristic Takes Hold
August 21, 2026
View chart & download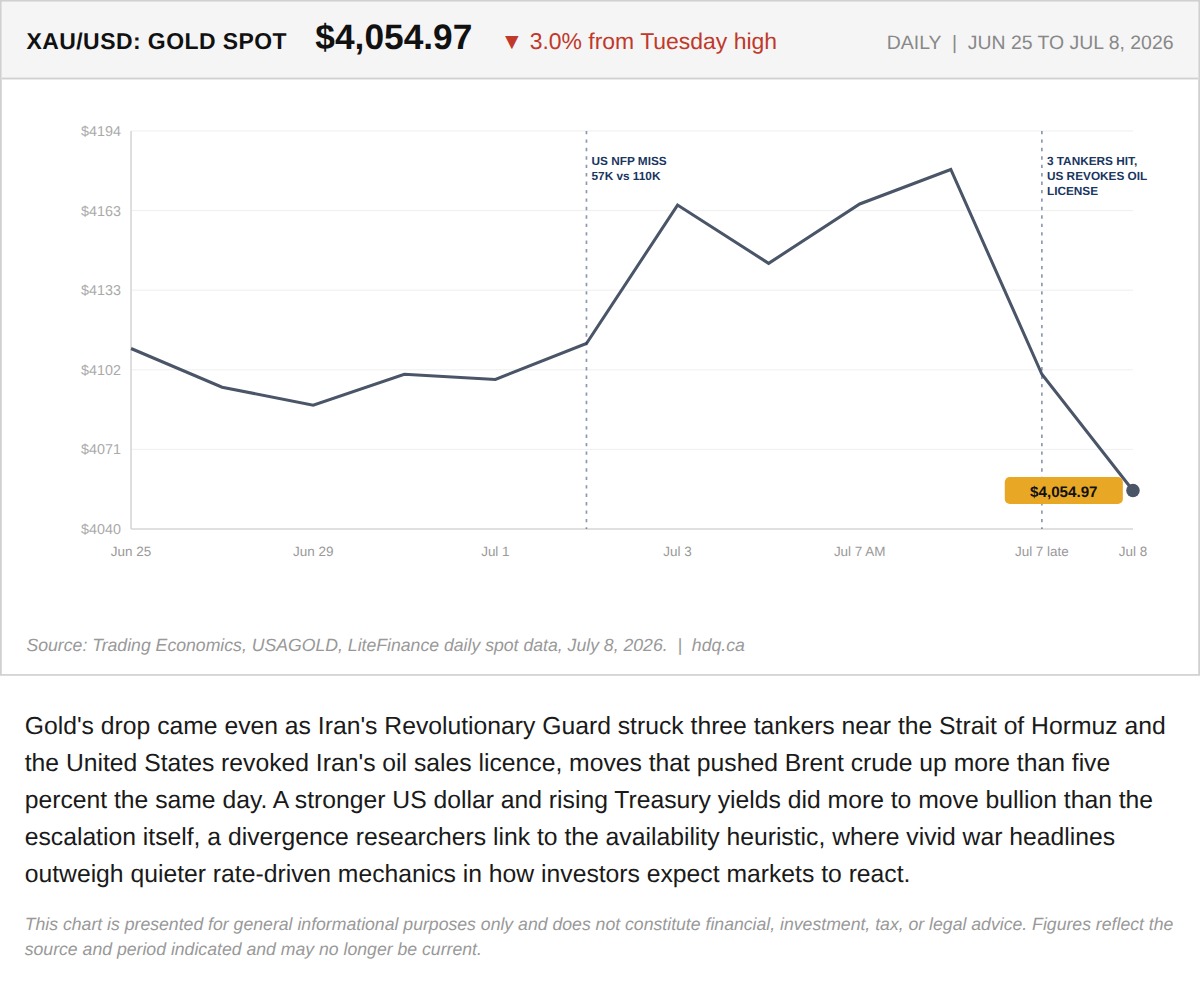
Gold's drop came even as Iran's Revolutionary Guard struck three tankers near the Strait of Hormuz and the United States revoked Iran's oil…
Gold Fell 3% While Iran Attacked Tankers in the Strait of Hormuz
July 8, 2026
View chart & download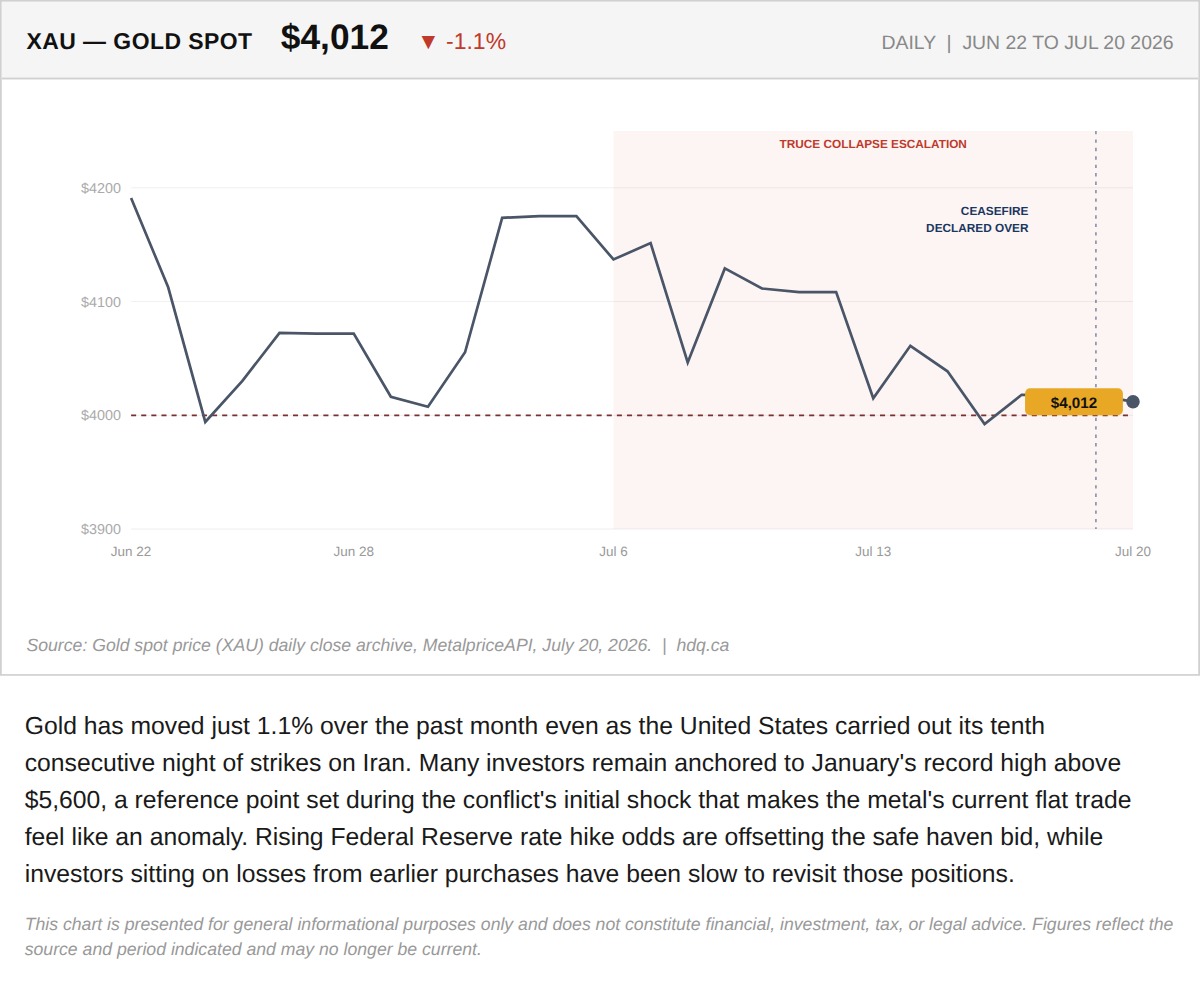
Gold has moved just 1.1% over the past month even as the United States carried out its tenth consecutive night of strikes on Iran.
Gold Has Not Moved in a Month, Even as the Iran War Intensifies
July 21, 2026
View chart & download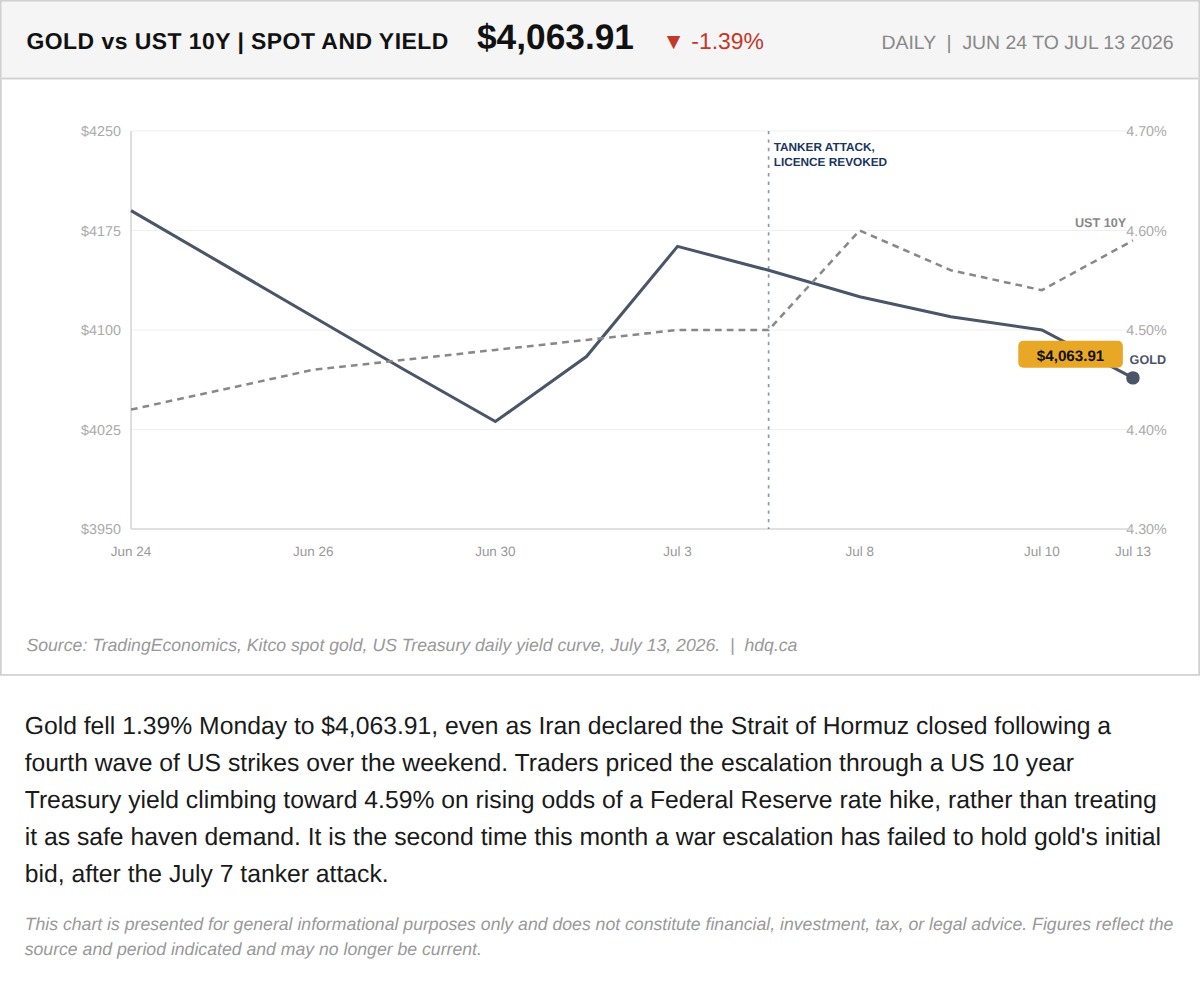
Gold fell 1.39% Monday to $4,063.91, even as Iran declared the Strait of Hormuz closed following a fourth wave of US strikes over the weekend.
Gold Fell on the Worst Hormuz Escalation in Months. That Is Not a Contradiction.
July 13, 2026
View chart & download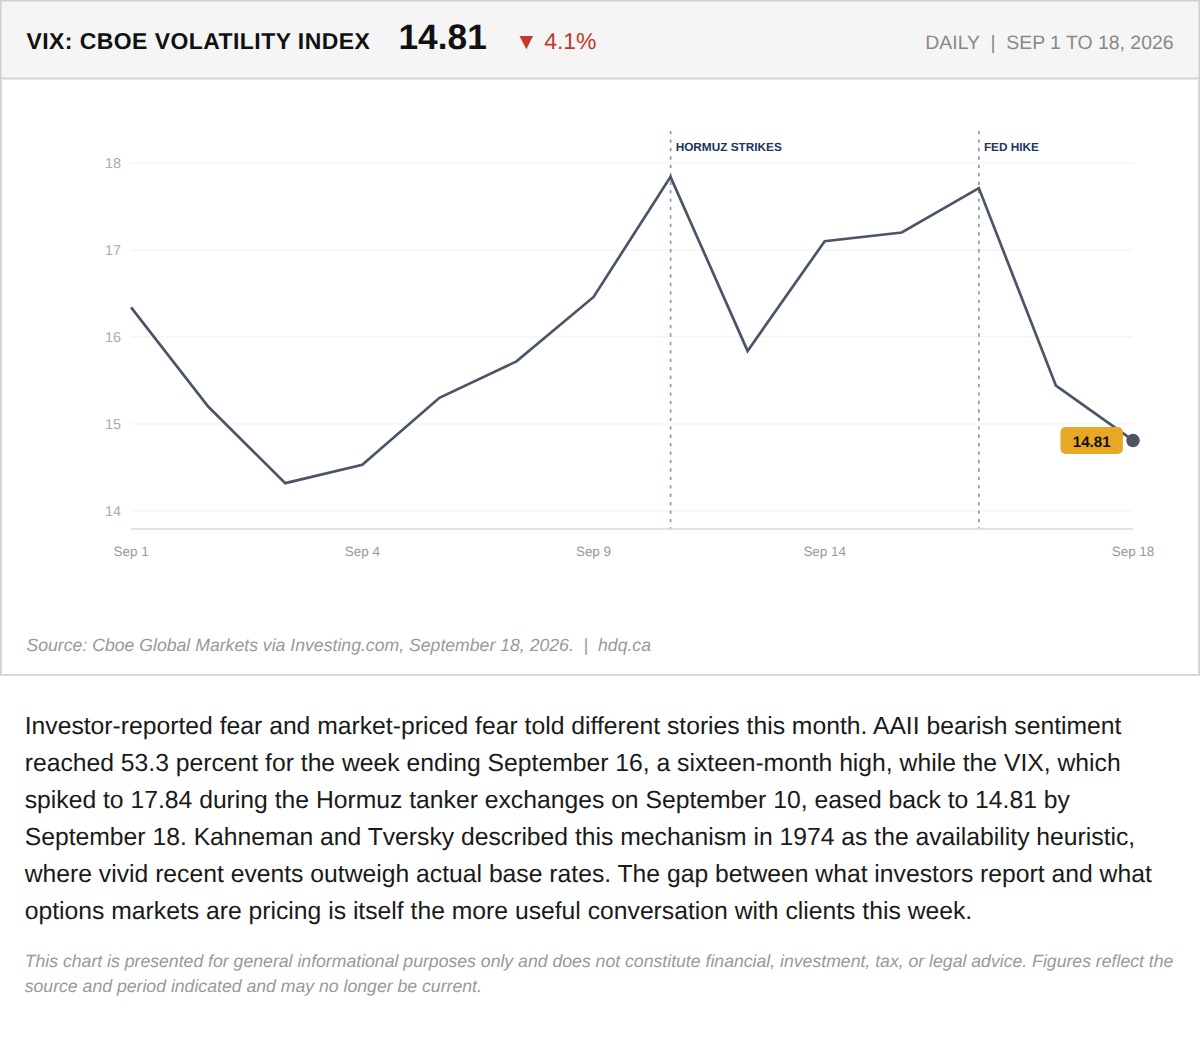
Investor-reported fear and market-priced fear told different stories this month.
The Fear Investors Report and the Fear the Market Is Pricing Have Split
September 21, 2026
View chart & download