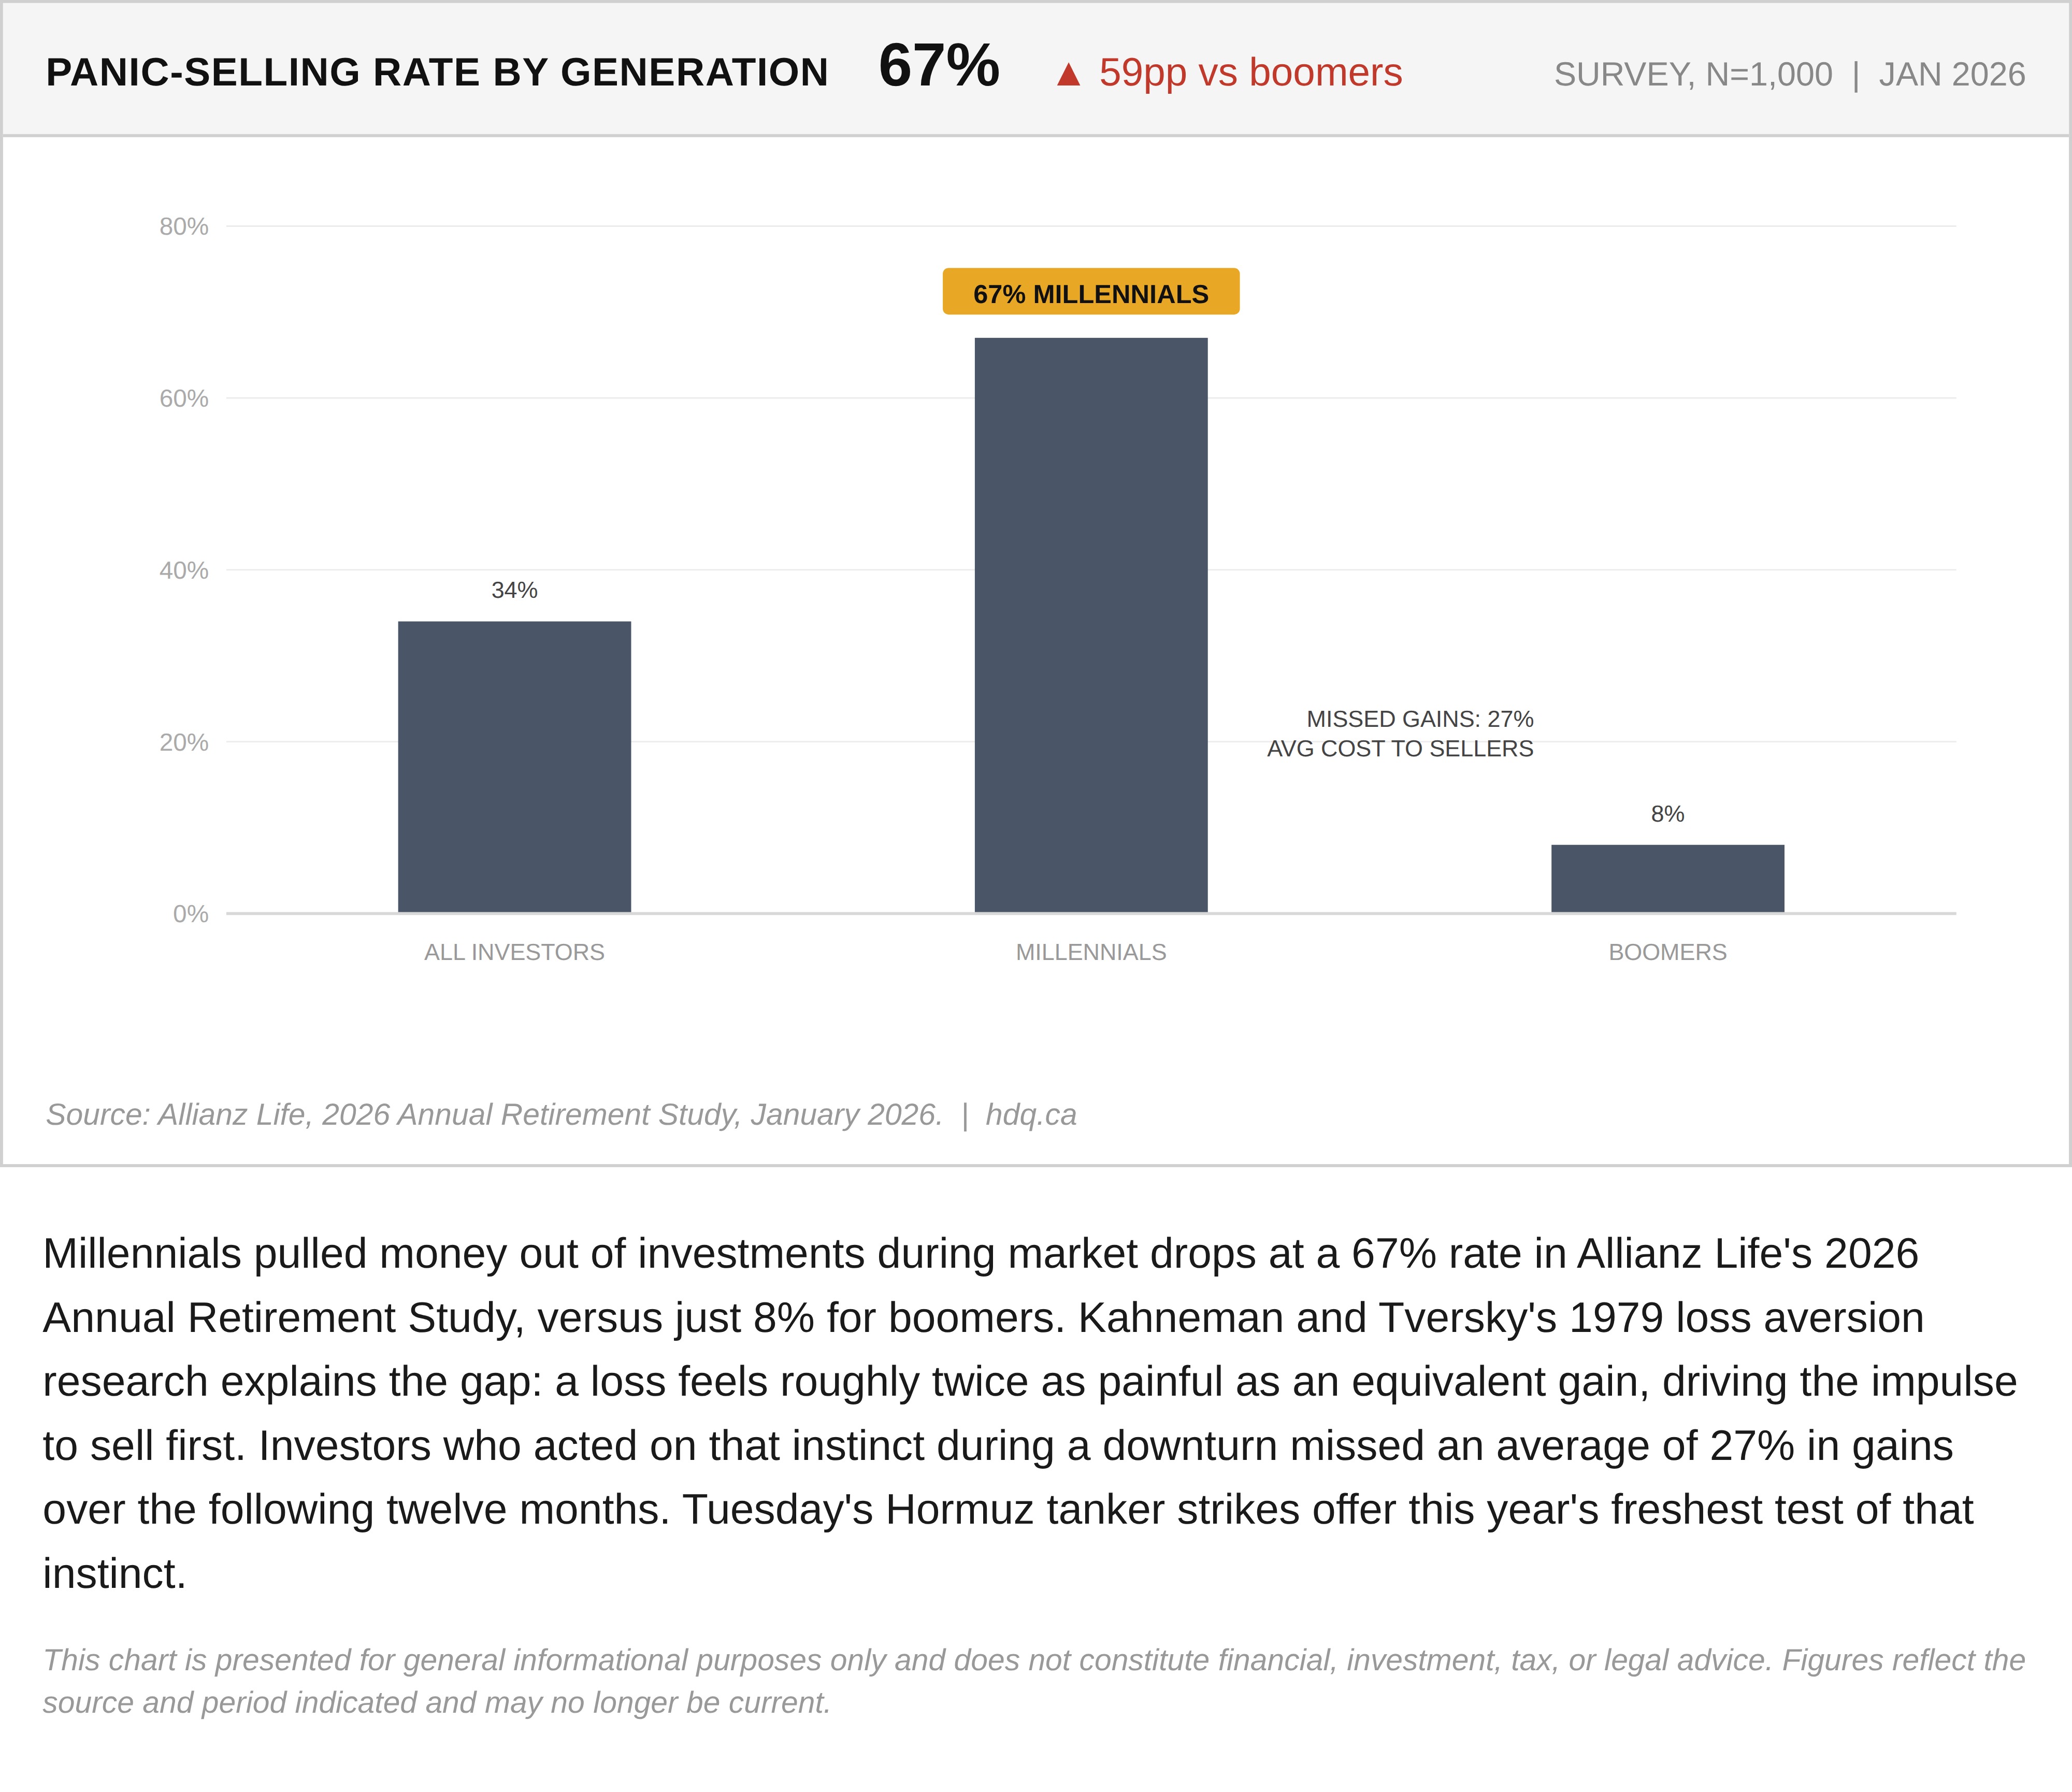
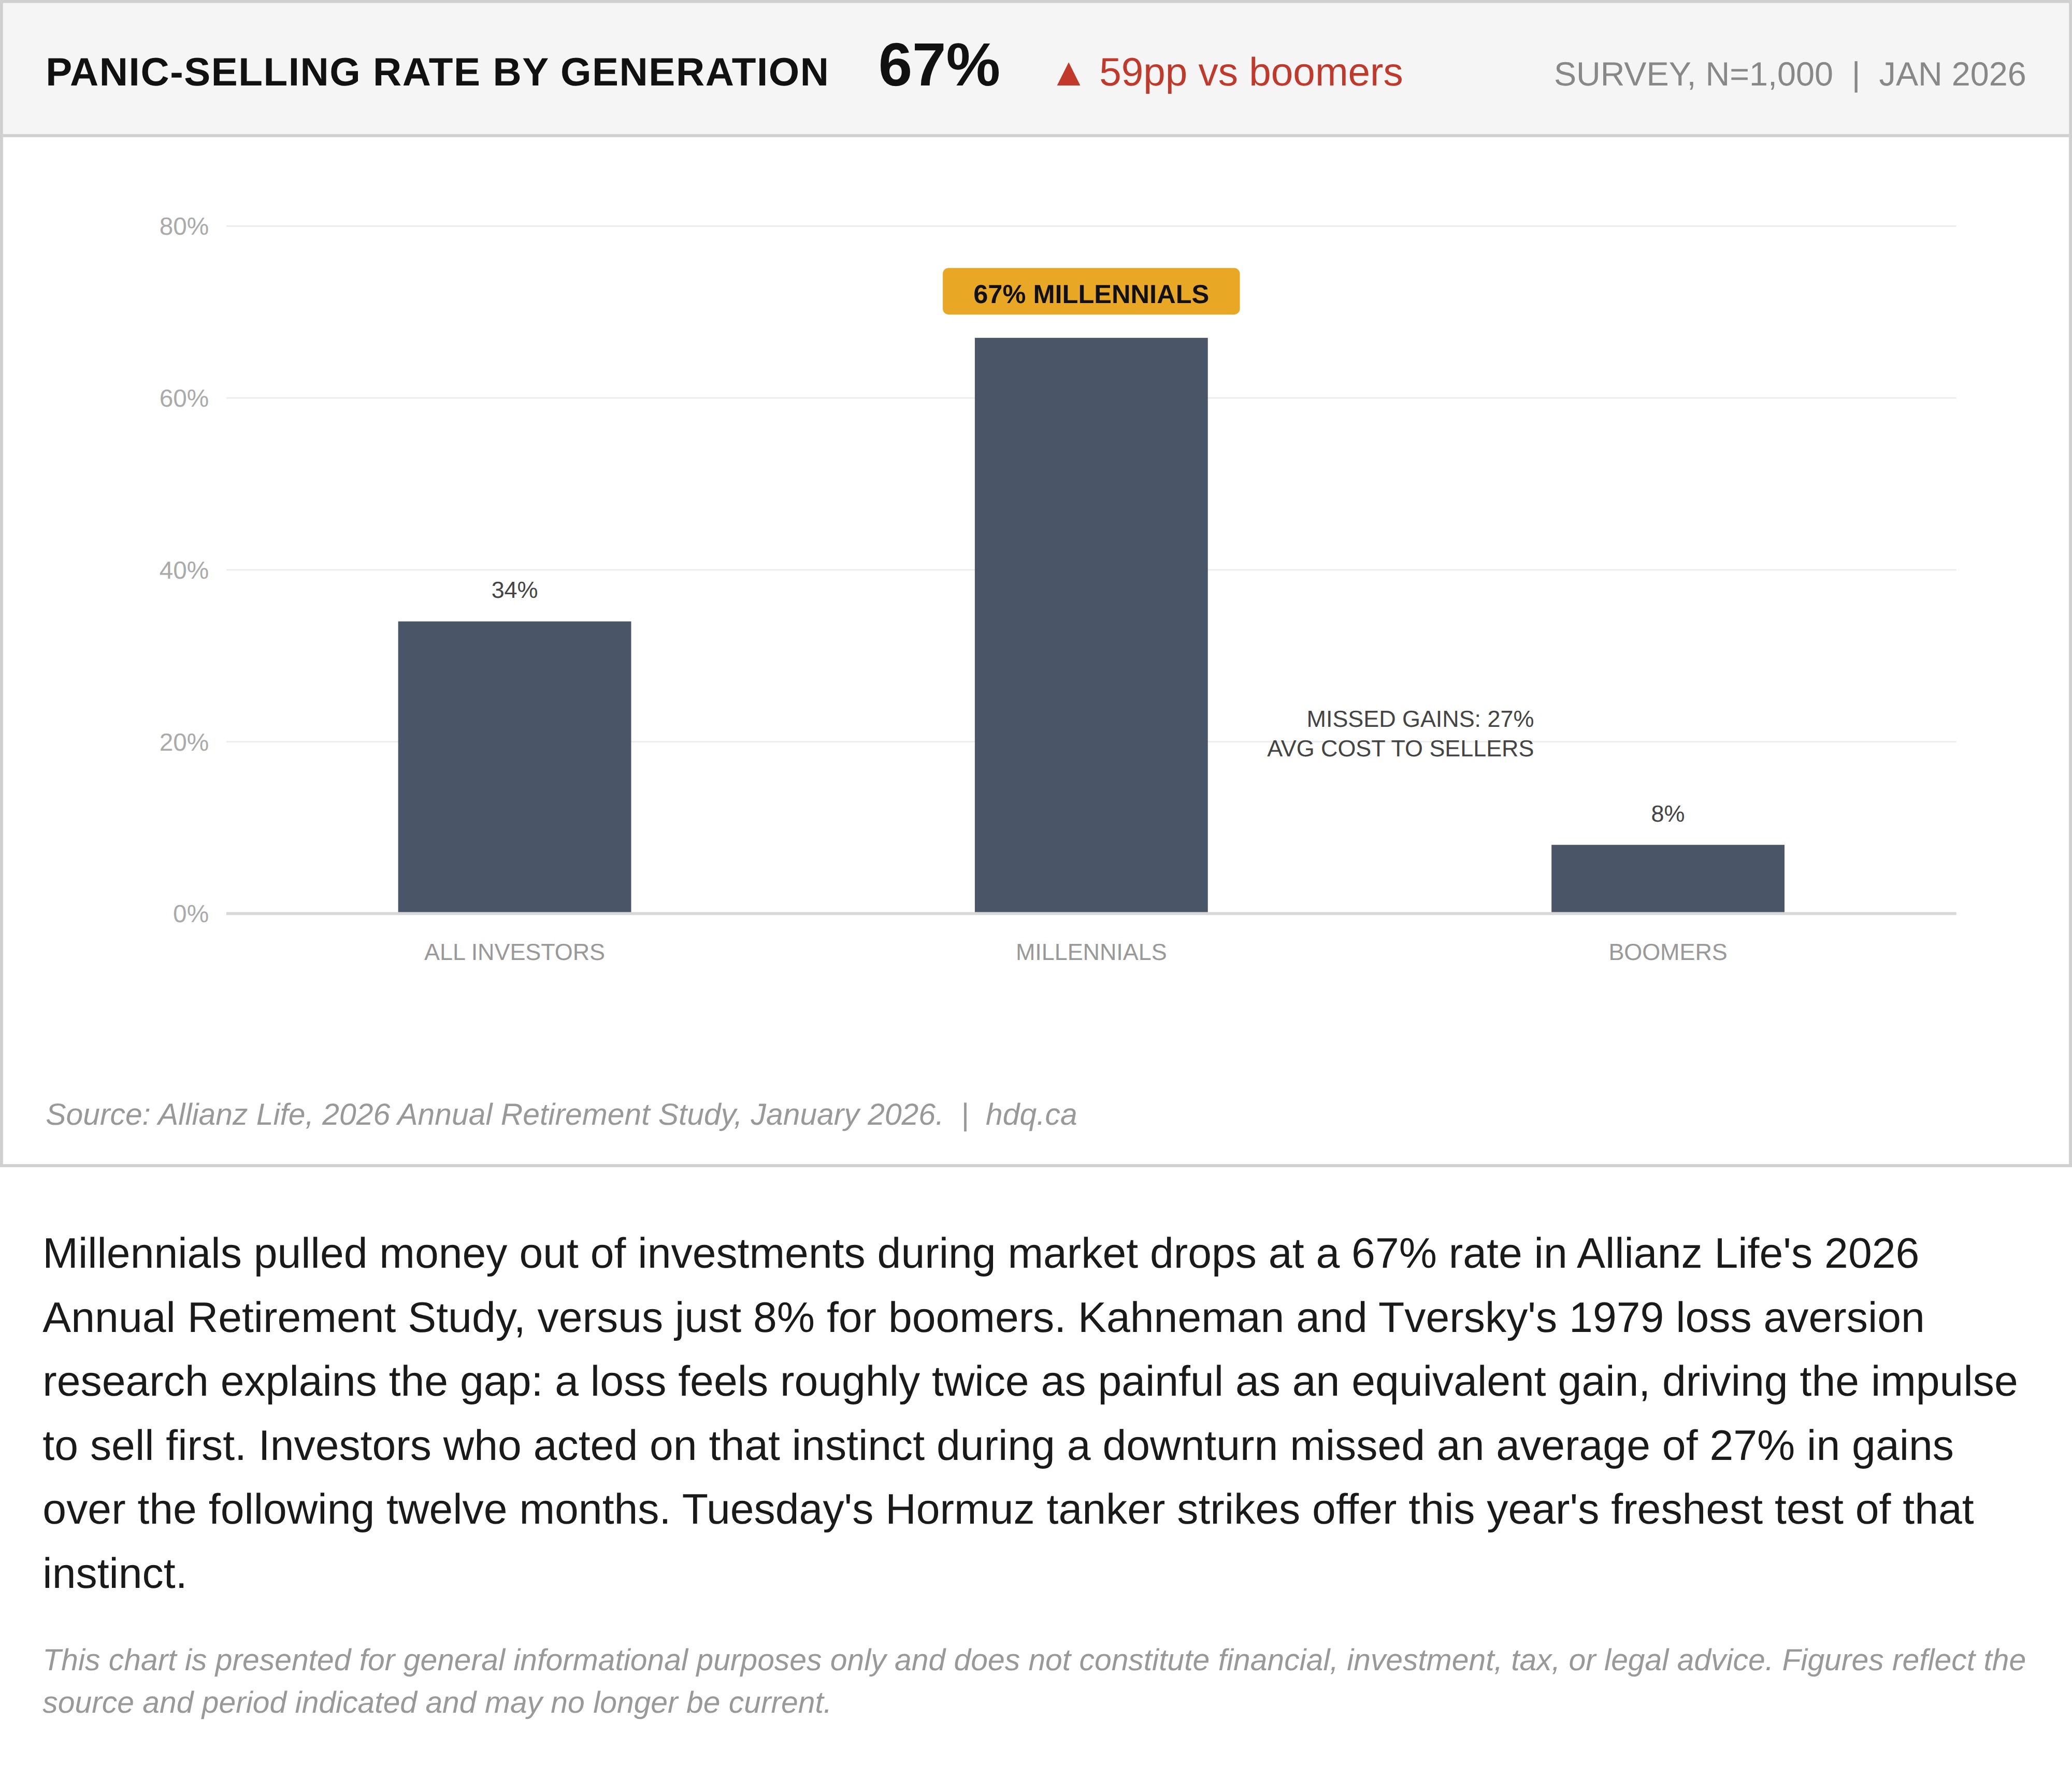
Millennials pulled money out of investments during market drops at a 67% rate in Allianz Life's 2026 Annual Retirement Study, versus just 8% for boomers. Kahneman and Tversky's 1979 loss aversion research explains the gap: a loss feels roughly twice as painful as an equivalent gain, driving the impulse to sell first. Investors who acted on that instinct during a downturn missed an average of 27% in gains over the following twelve months. Tuesday's Hormuz tanker strikes offer this year's freshest test of that instinct.
This chart is presented for general informational purposes only and does not constitute financial, investment, tax, or legal advice. Figures reflect the source and period indicated and may no longer be current.
Related charts
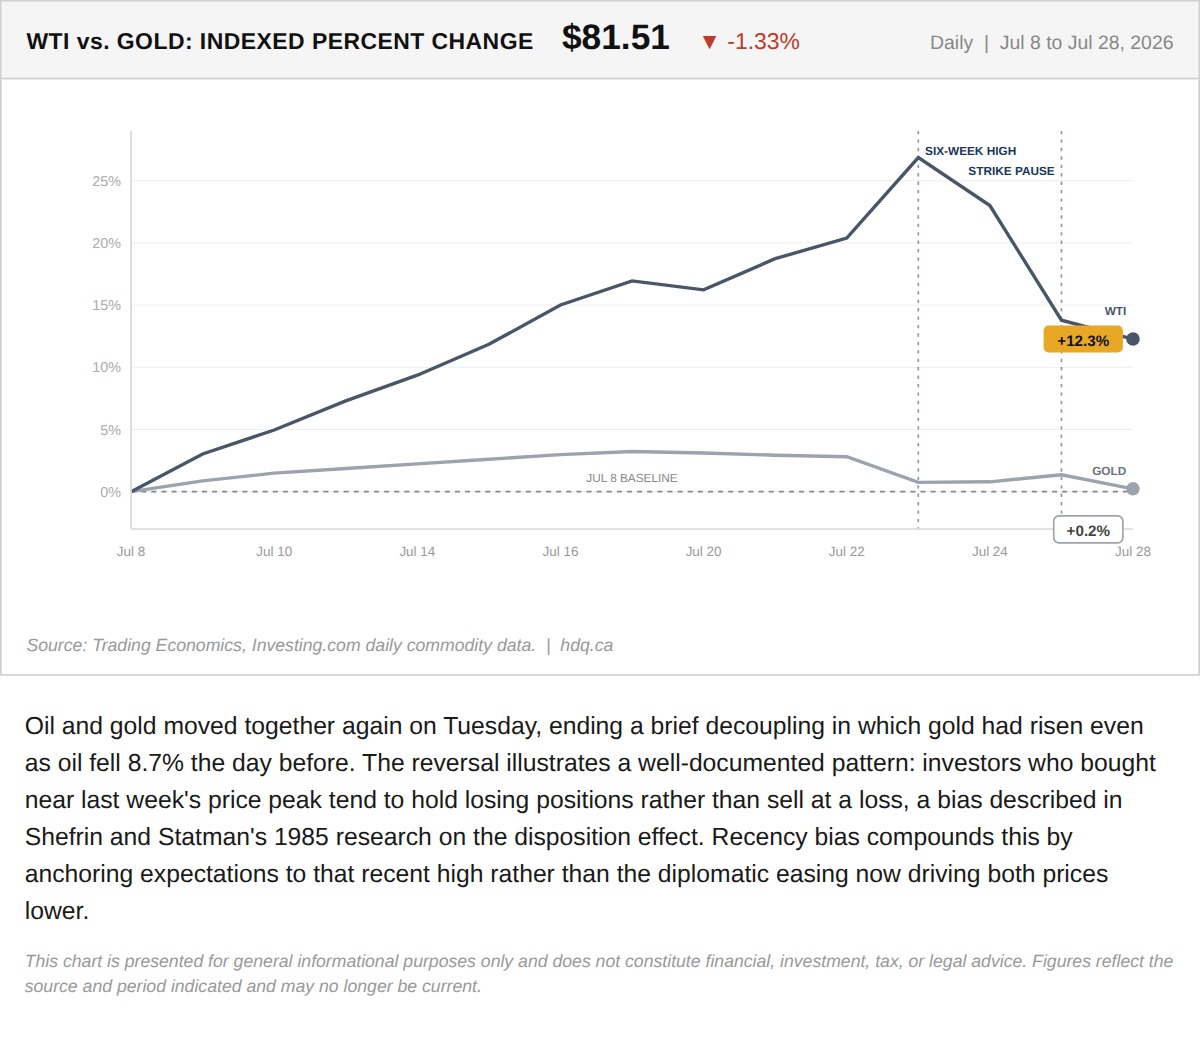
Oil and gold moved together again on Tuesday, ending a brief decoupling in which gold had risen even as oil fell 8.7% the day before.
July 28, 2026
View chart & download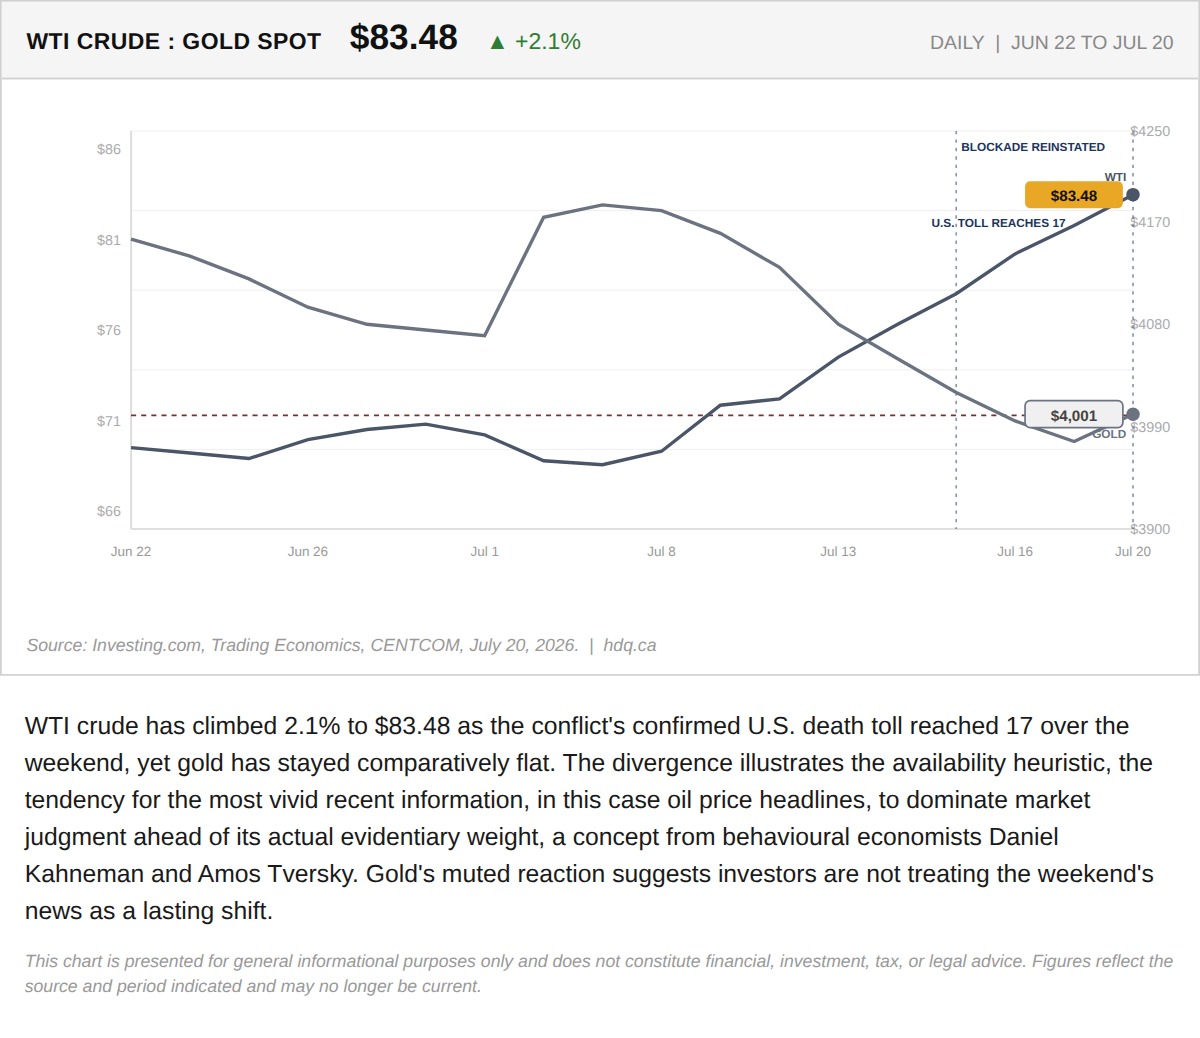
WTI crude has climbed 2.1% to $83.48 as the conflict's confirmed U.S.
Oil Spiked Past $85 as the War's U.S. Death Toll Hit 17. It Gave Back Most of the Move by Noon.
July 20, 2026
View chart & download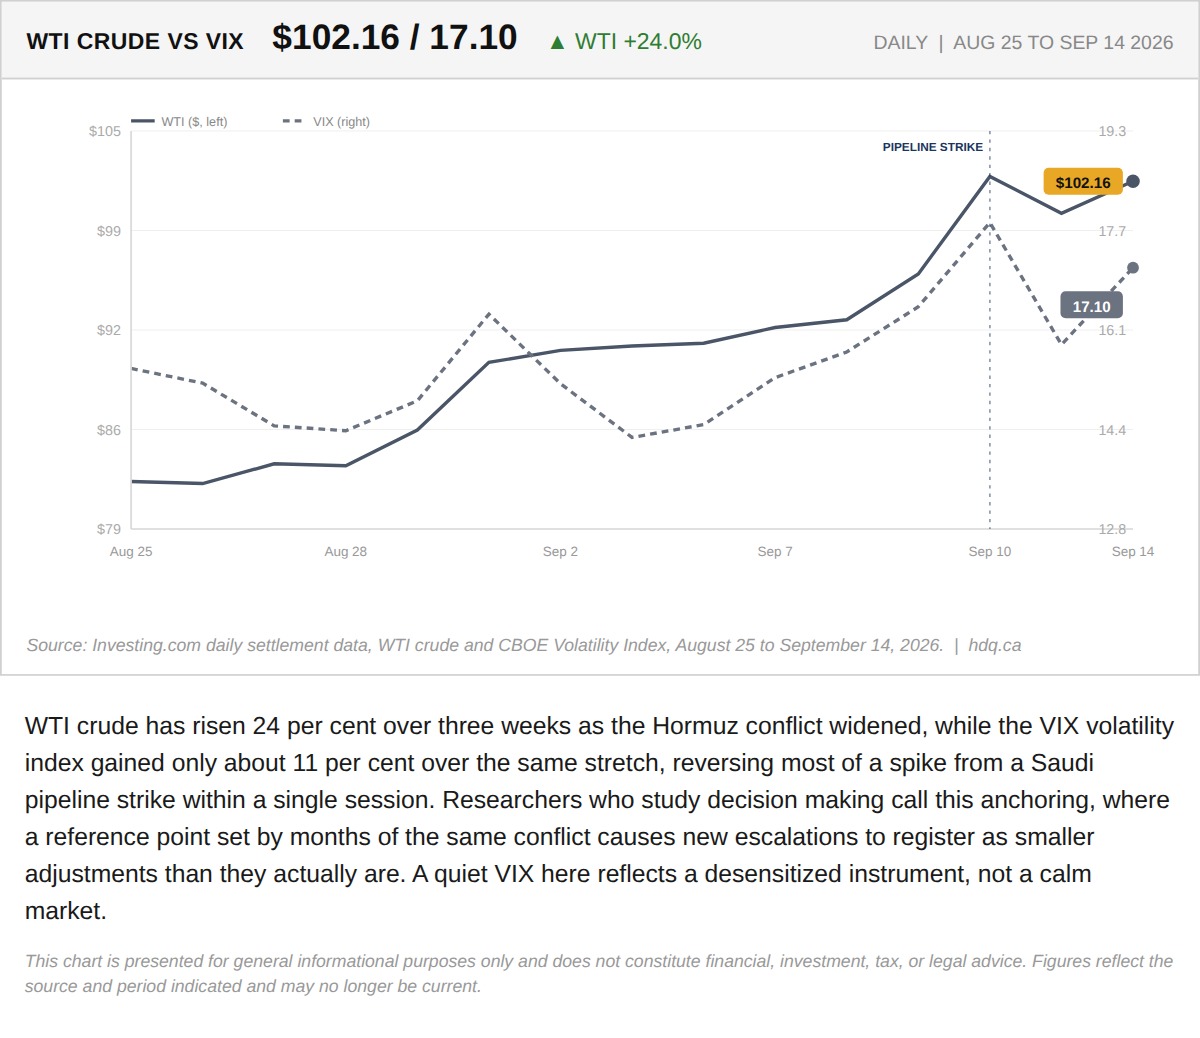
WTI crude has risen 24 per cent over three weeks as the Hormuz conflict widened, while the VIX volatility index gained only about 11 per…
Oil Has Risen 24 Per Cent in Three Weeks and the Fear Gauge Barely Moved
September 15, 2026
View chart & download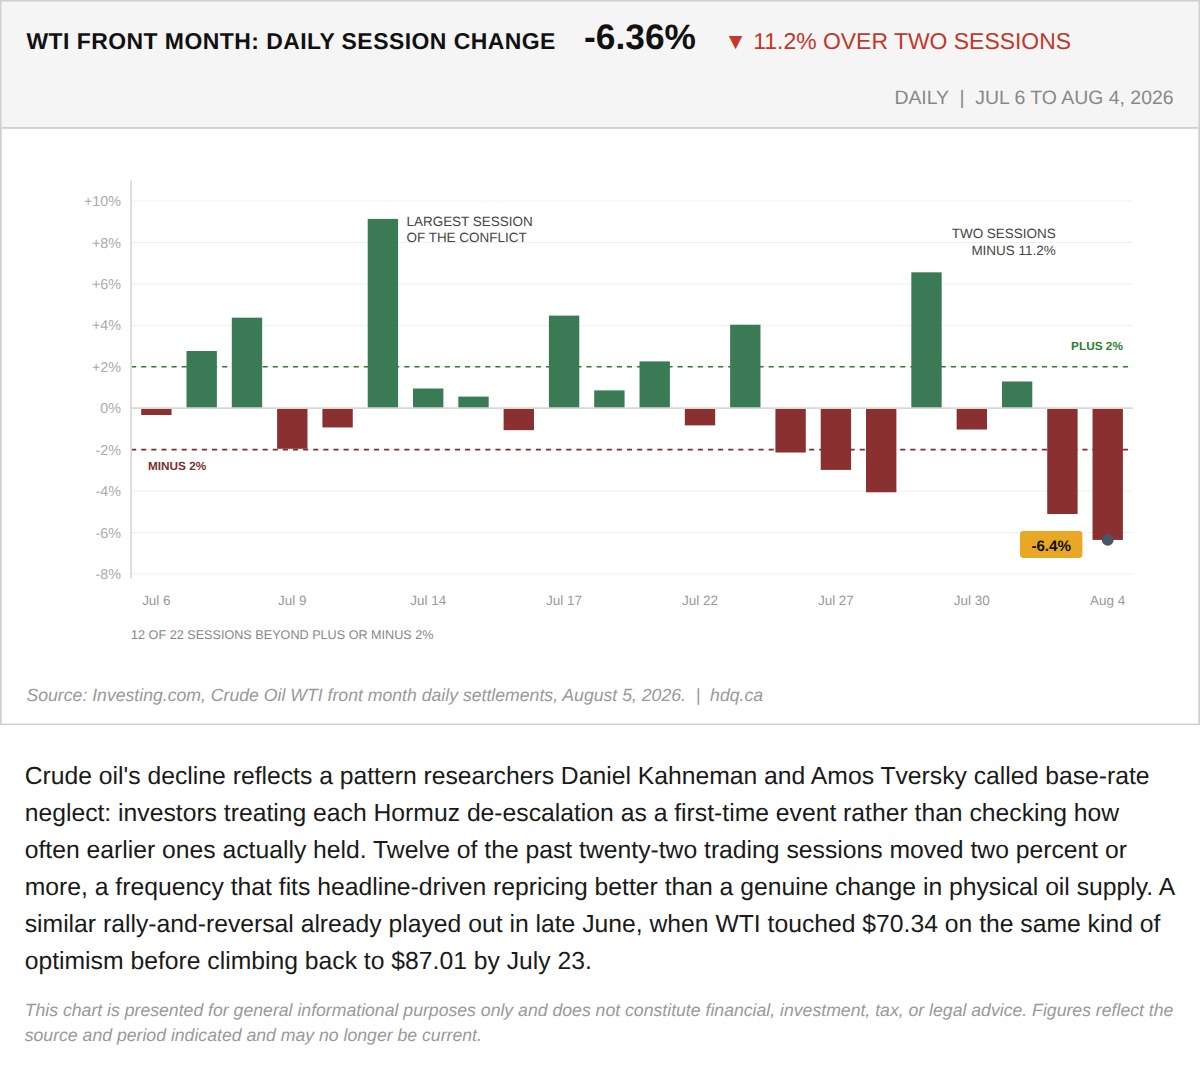
Crude oil's decline reflects a pattern researchers Daniel Kahneman and Amos Tversky called base-rate neglect: investors treating each…
August 5, 2026
View chart & download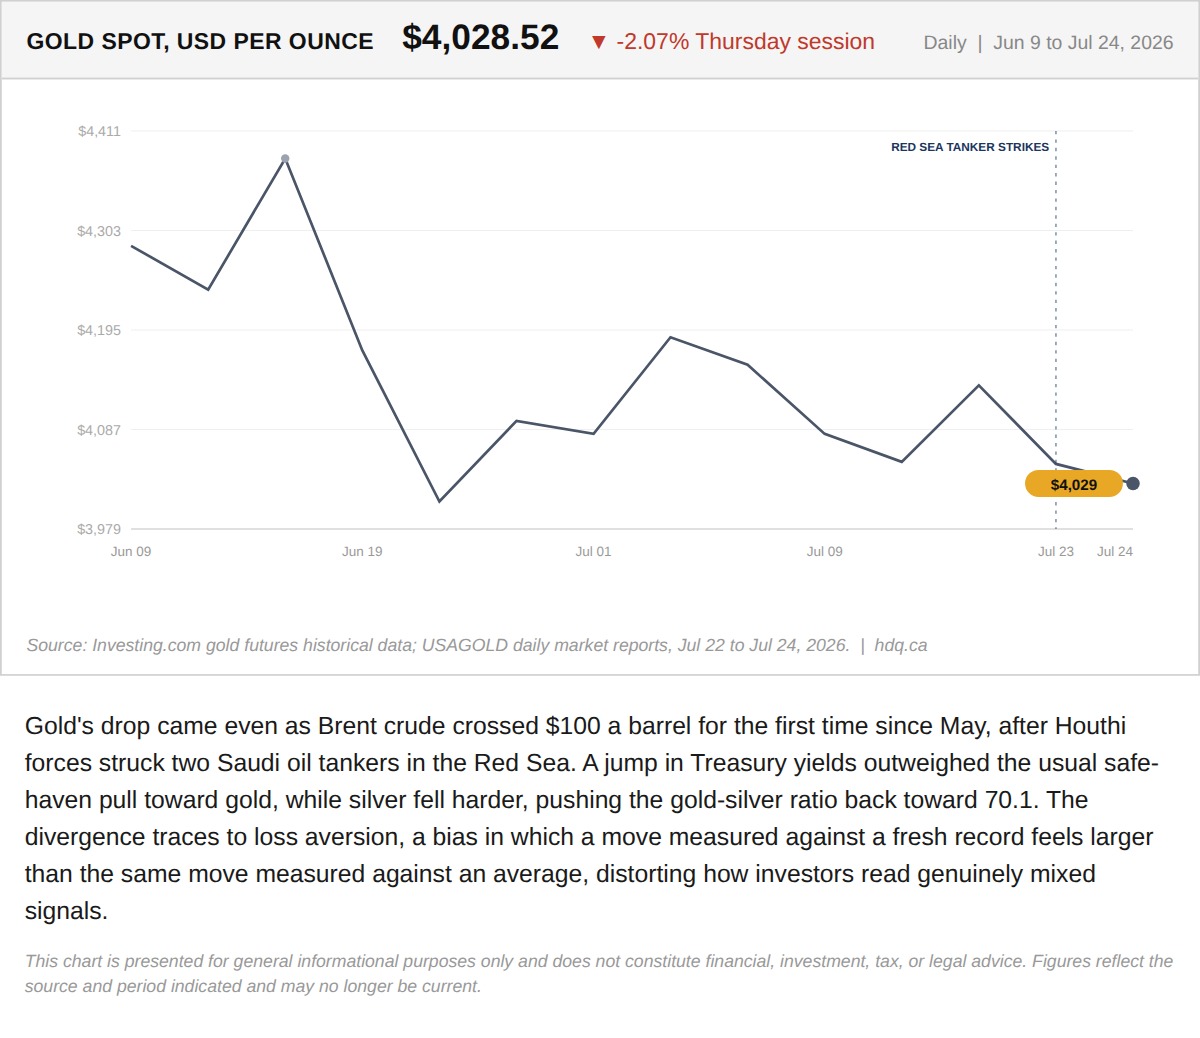
Gold's drop came even as Brent crude crossed $100 a barrel for the first time since May, after Houthi forces struck two Saudi oil tankers in the Red Sea.
Record High, Sharp Reversal: A Lesson in Loss Aversion
July 24, 2026
View chart & download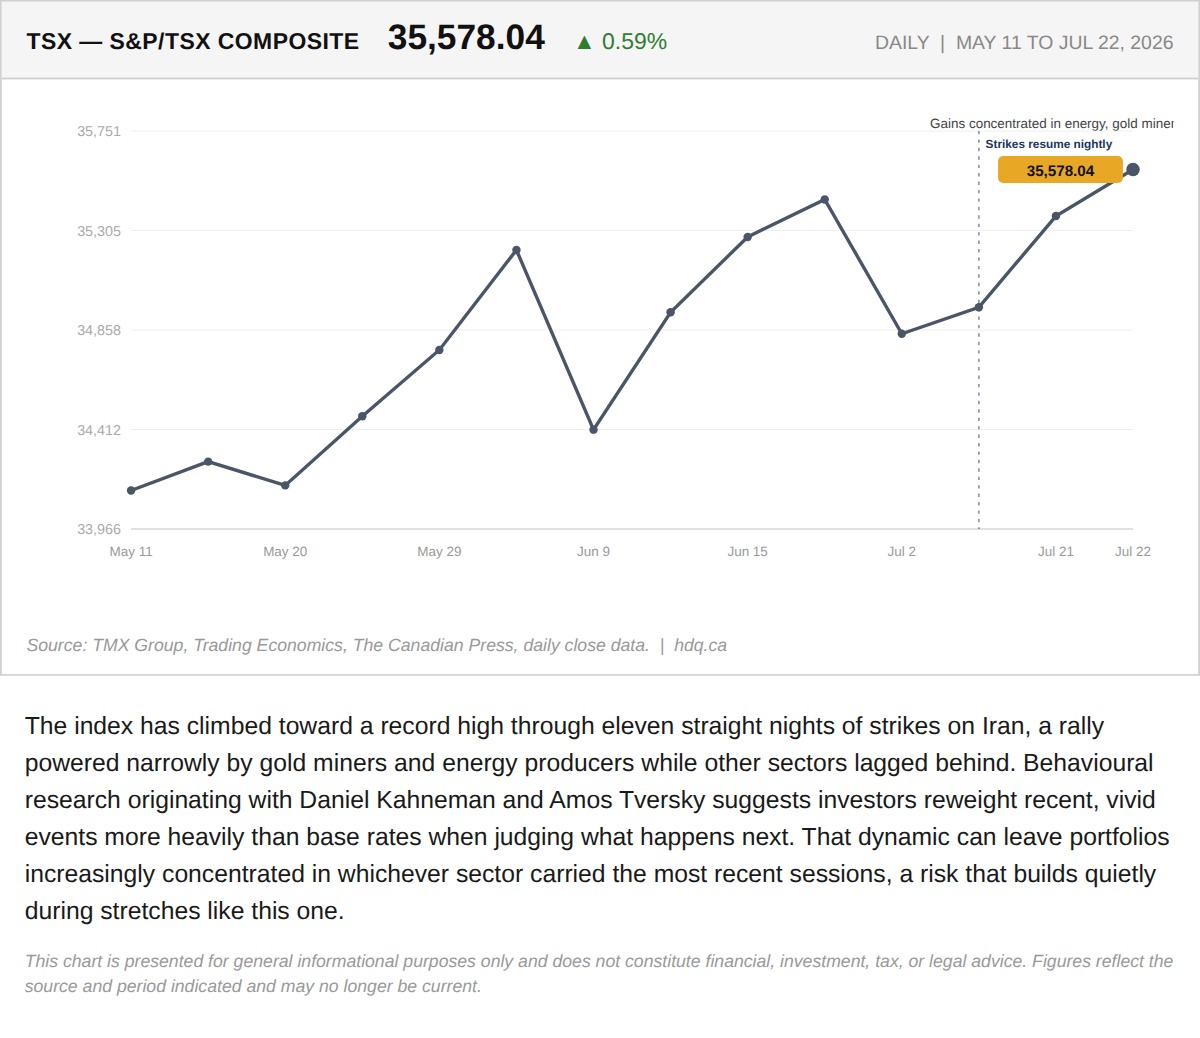
The index has climbed toward a record high through eleven straight nights of strikes on Iran, a rally powered narrowly by gold miners and…
The Recency Trap in a War-Driven Rally
July 23, 2026
View chart & download