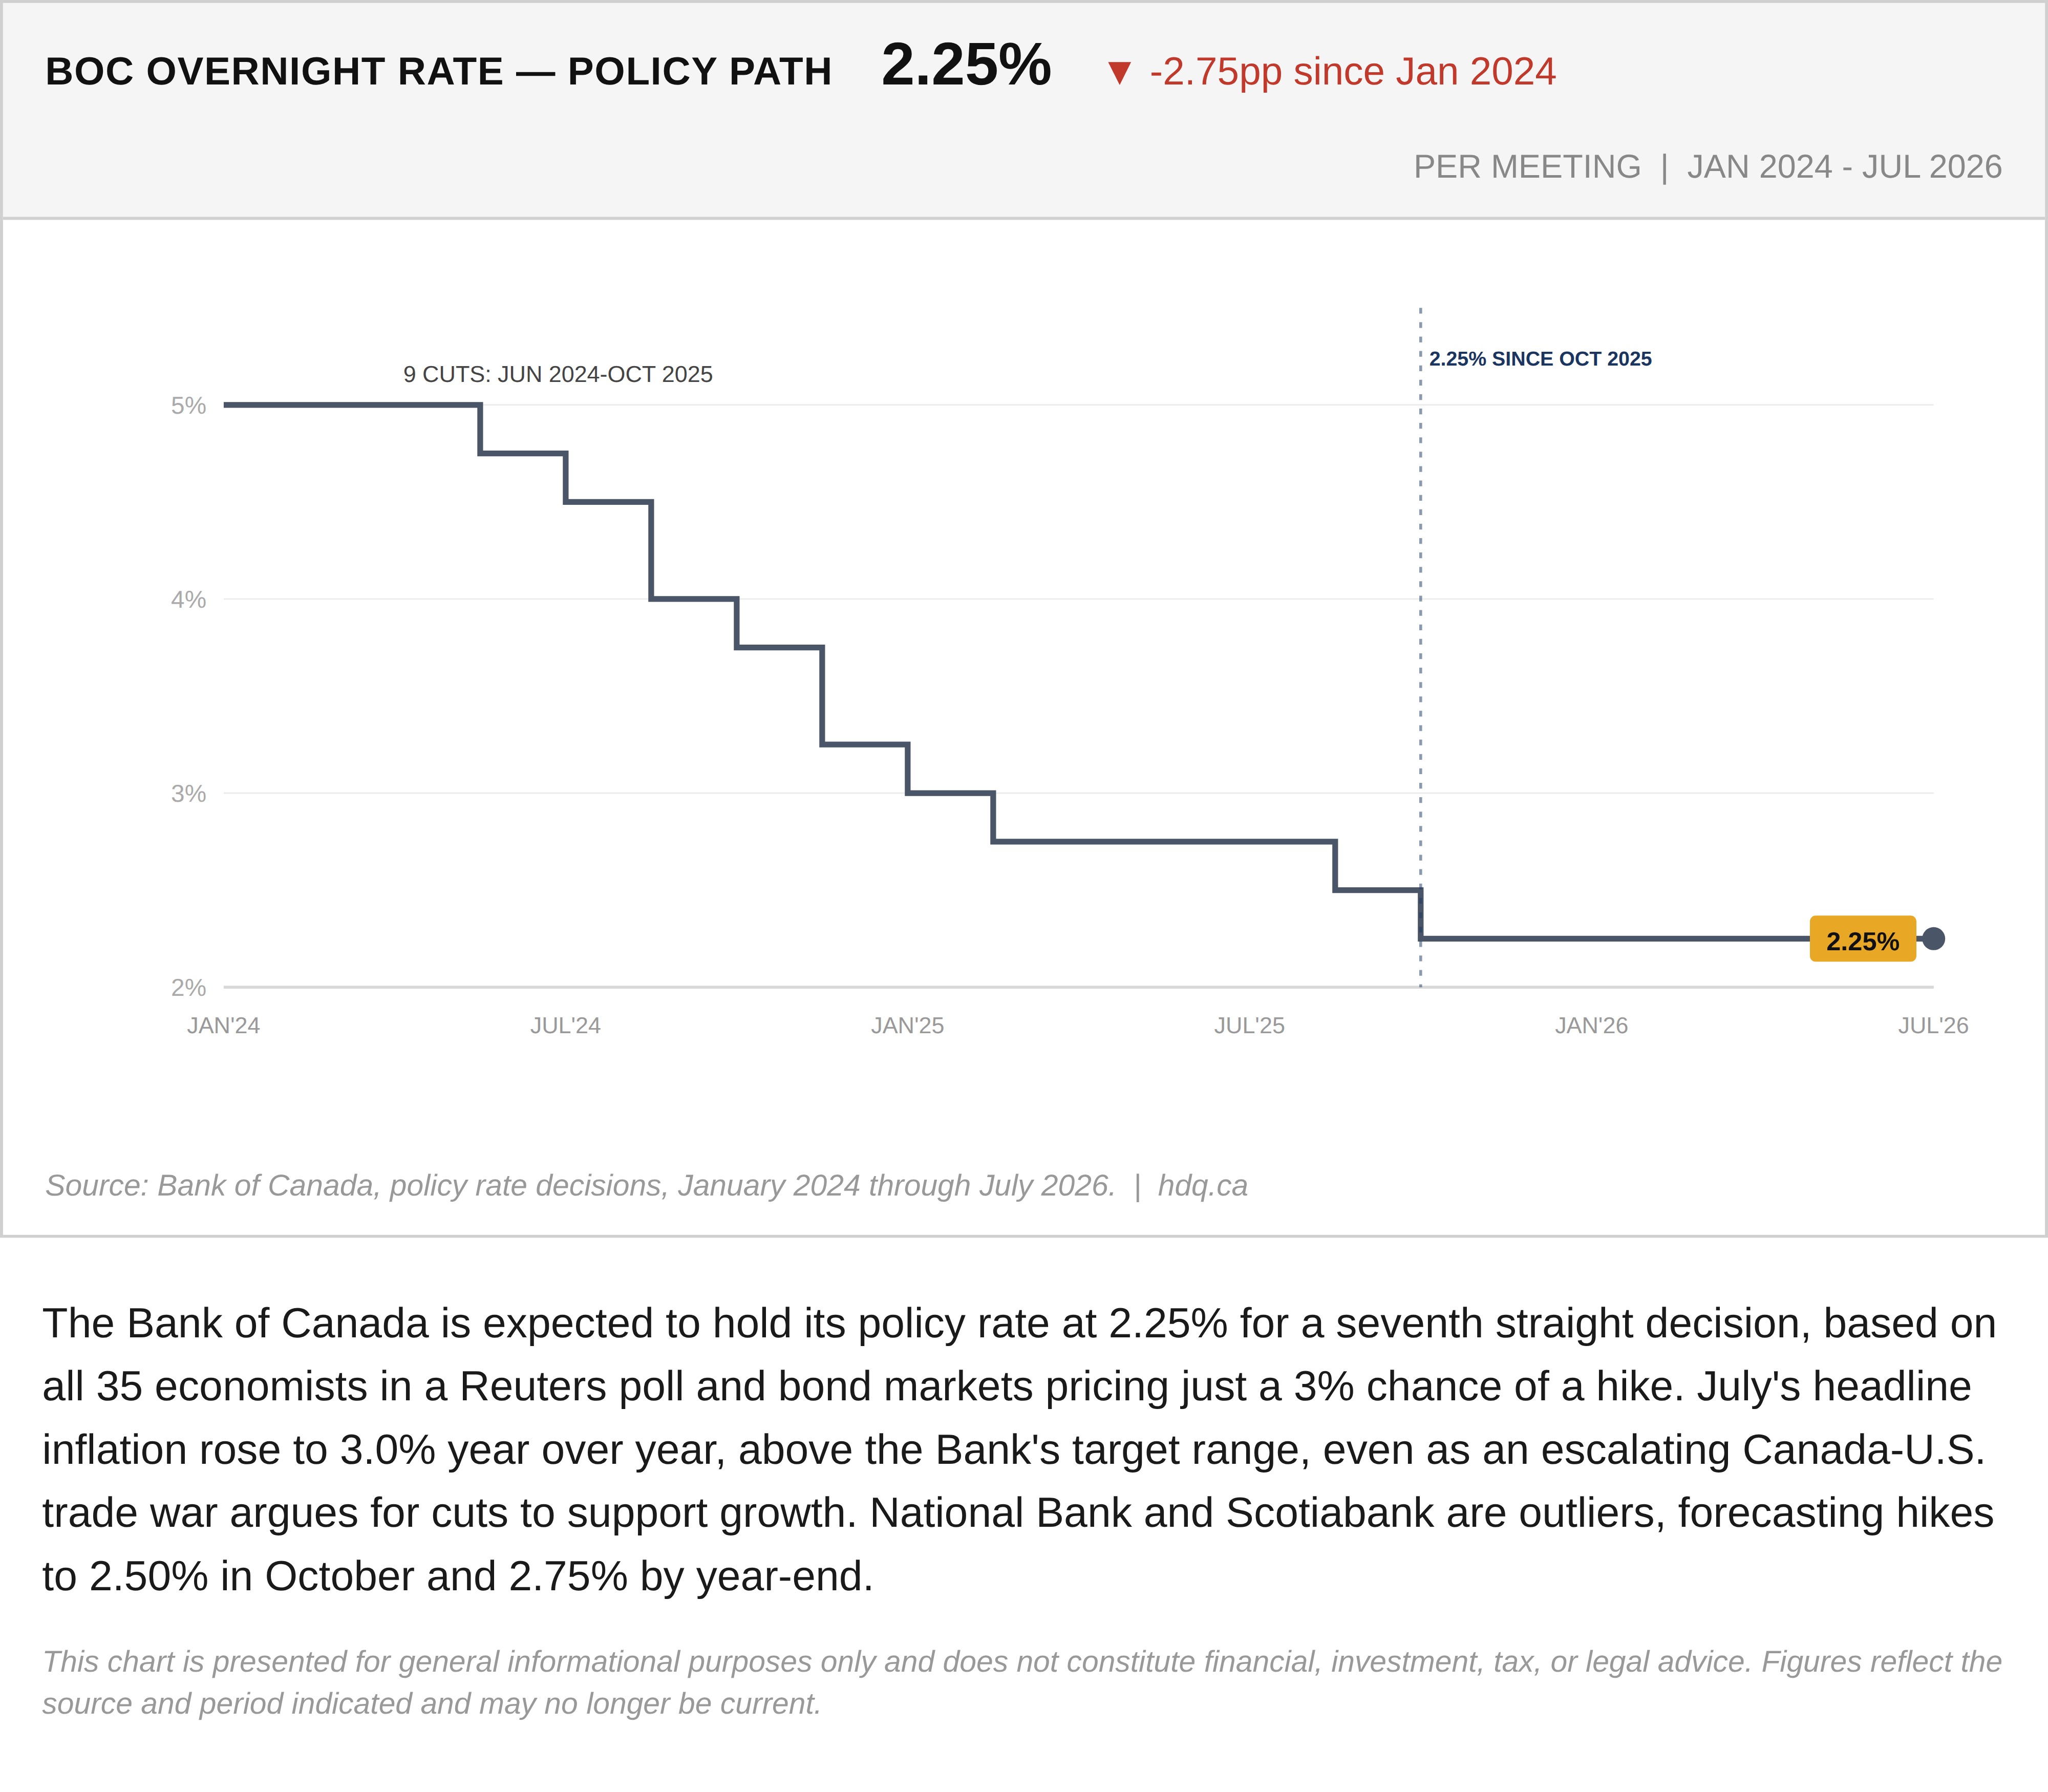
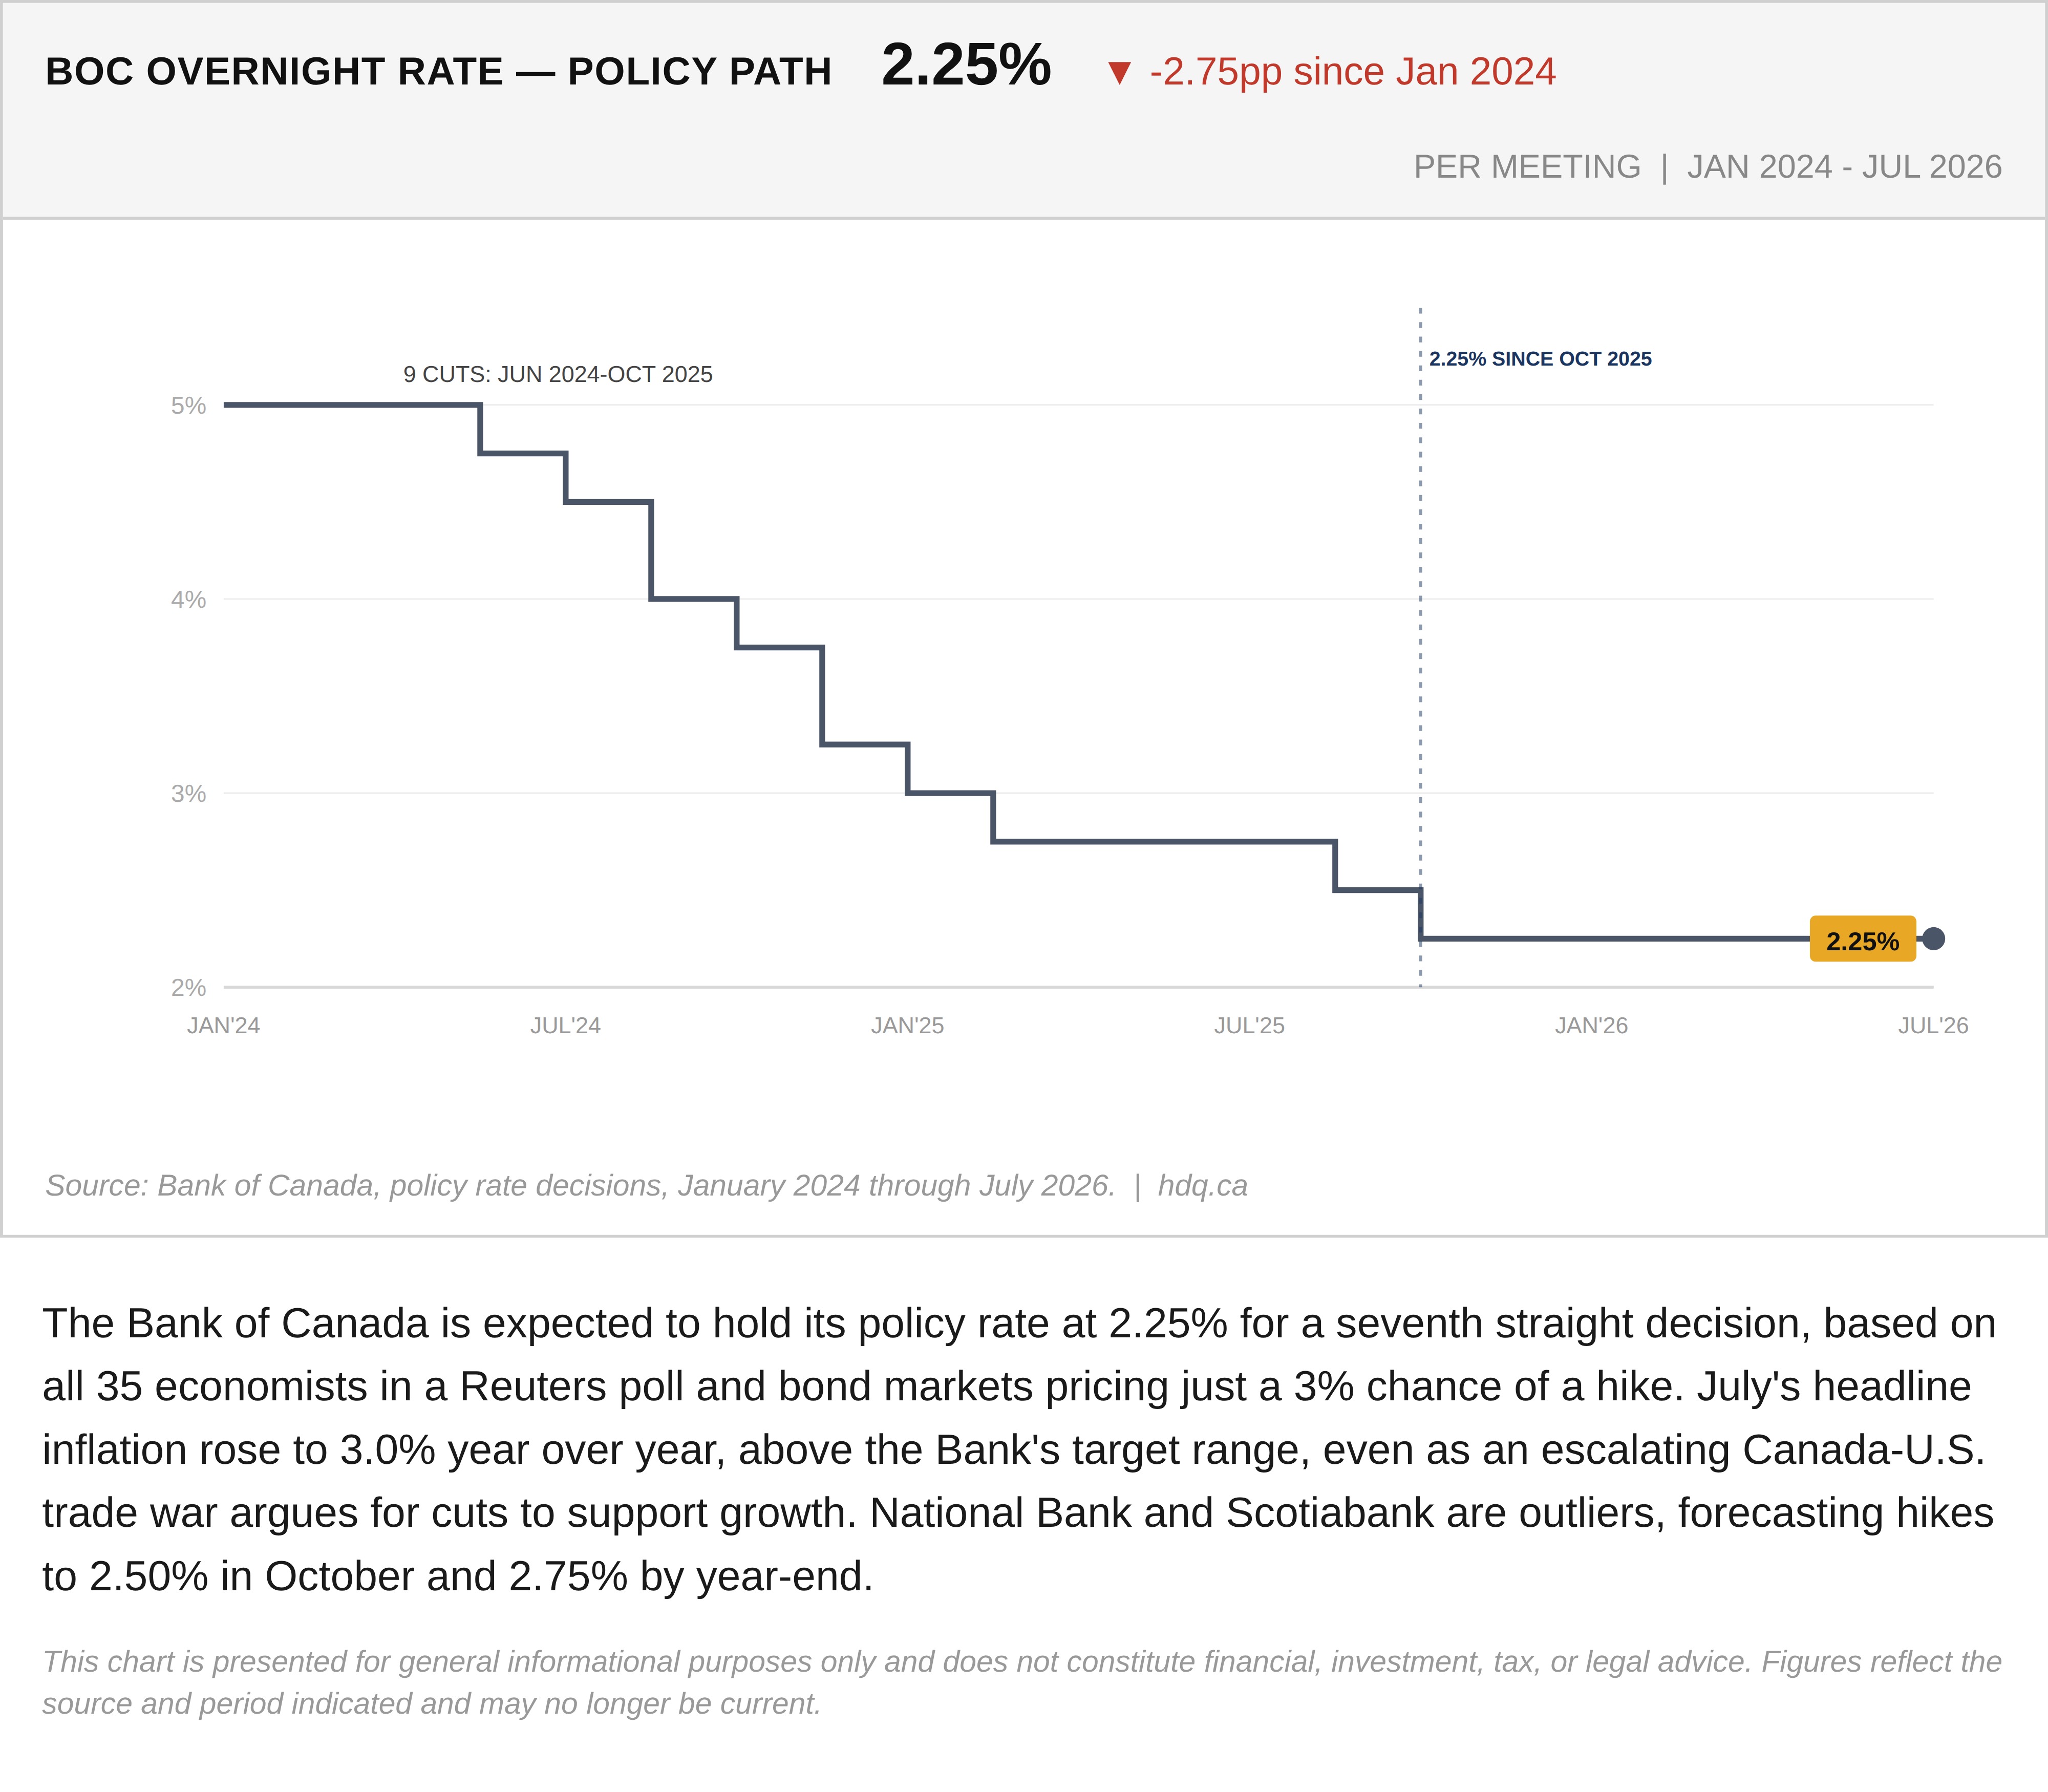
The Bank of Canada is expected to hold its policy rate at 2.25% for a seventh straight decision, based on all 35 economists in a Reuters poll and bond markets pricing just a 3% chance of a hike. July's headline inflation rose to 3.0% year over year, above the Bank's target range, even as an escalating Canada-U.S. trade war argues for cuts to support growth. National Bank and Scotiabank are outliers, forecasting hikes to 2.50% in October and 2.75% by year-end.
This chart is presented for general informational purposes only and does not constitute financial, investment, tax, or legal advice. Figures reflect the source and period indicated and may no longer be current.
Related charts
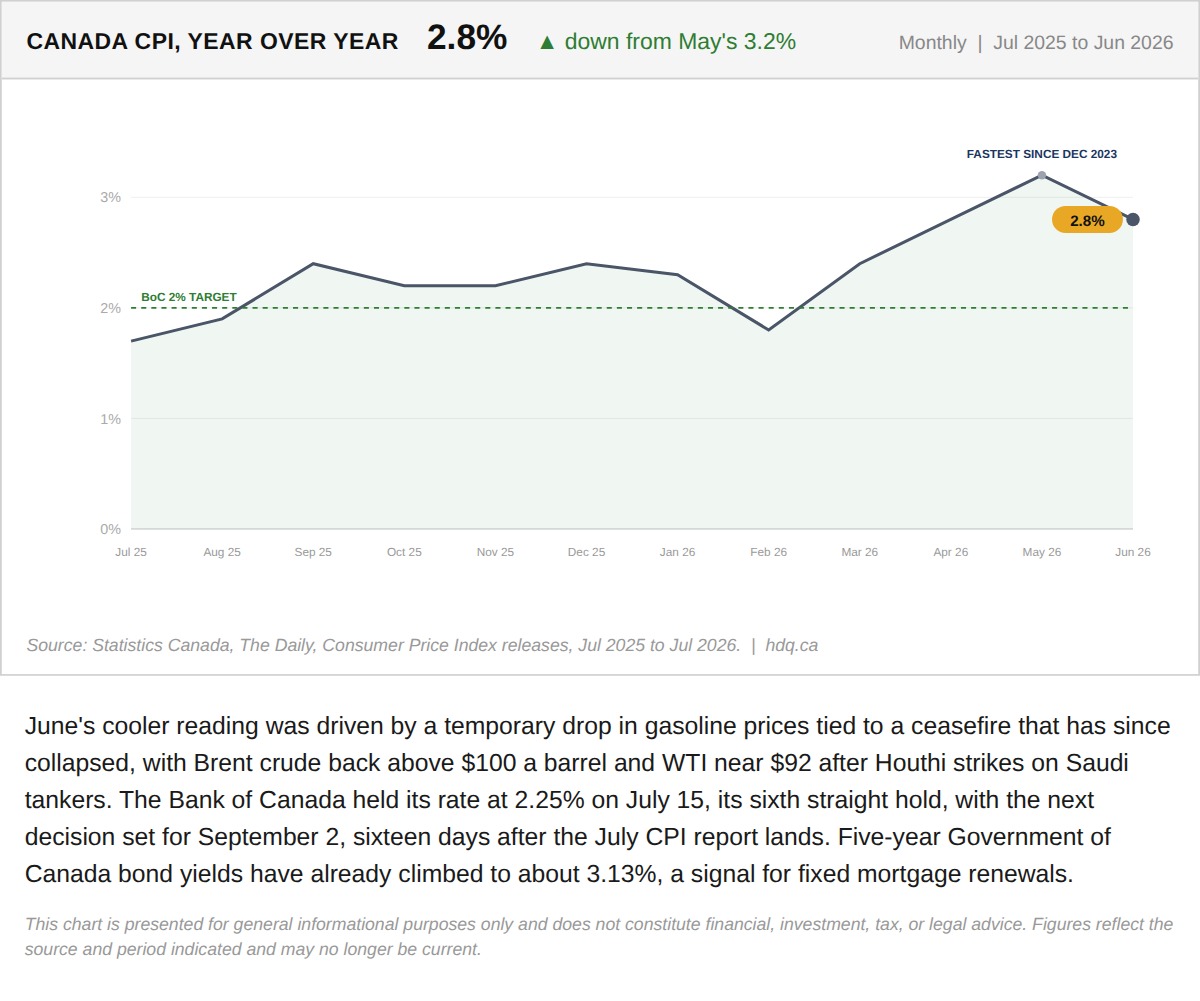
June's cooler reading was driven by a temporary drop in gasoline prices tied to a ceasefire that has since collapsed, with Brent crude back…
June's Cooler Inflation Print Rested on a Ceasefire That Has Already Broken
July 24, 2026
View chart & download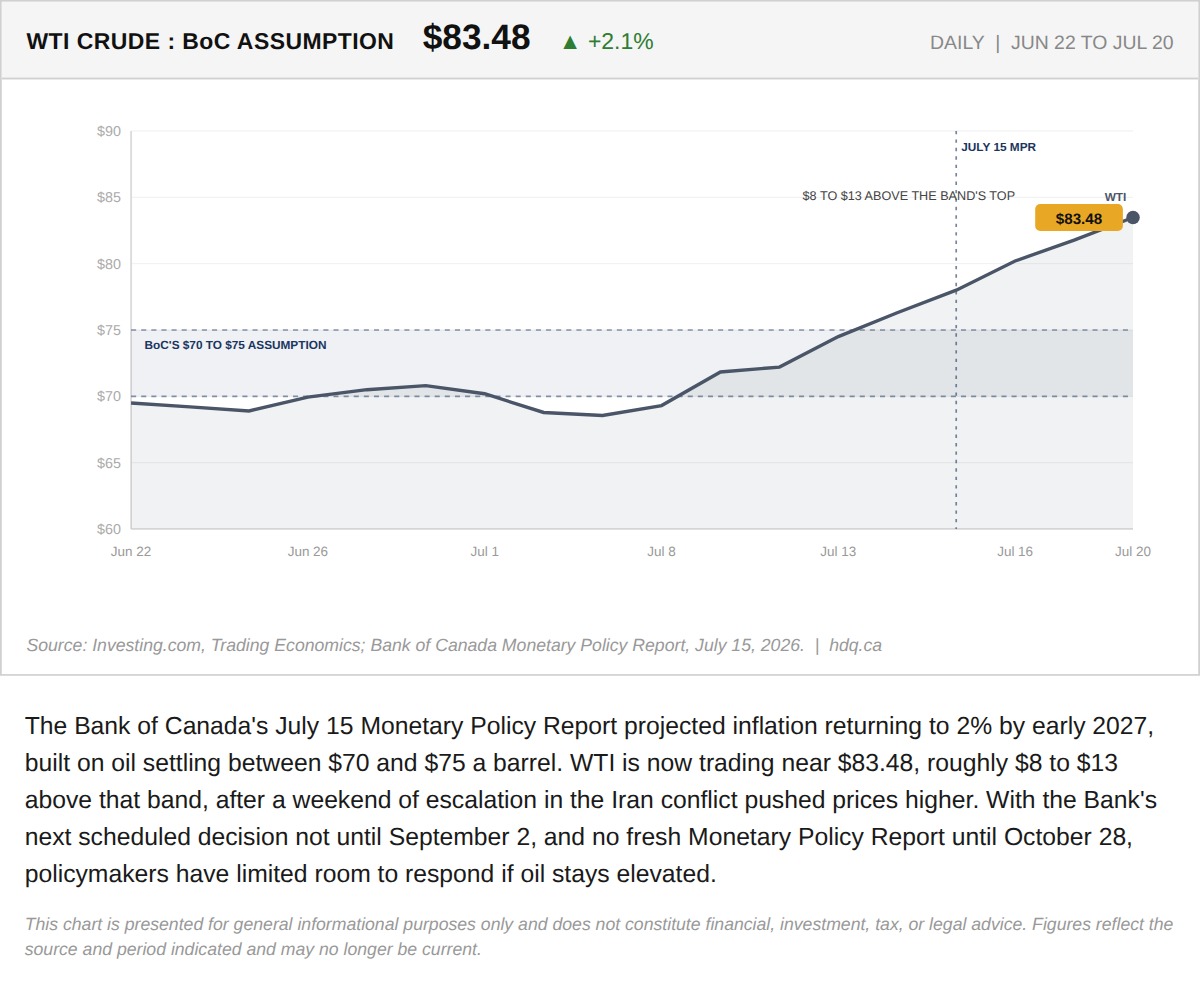
The Bank of Canada's July 15 Monetary Policy Report projected inflation returning to 2% by early 2027, built on oil settling between $70 and $75 a barrel.
The Bank of Canada's Path Back to 2% Assumed Oil at $70 to $75. It's Trading Near $84.
July 20, 2026
View chart & download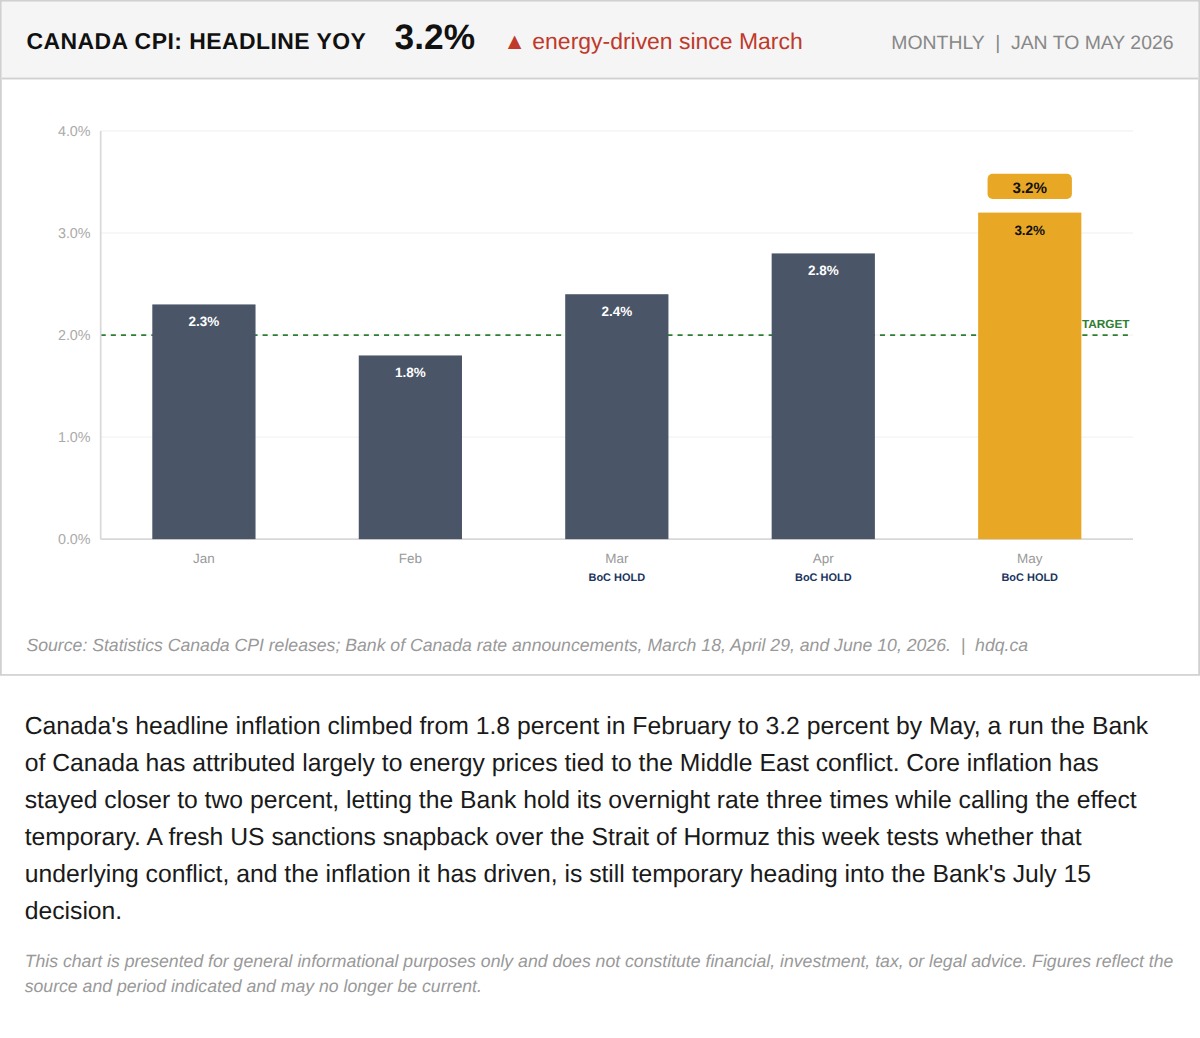
Canada's headline inflation climbed from 1.8 percent in February to 3.2 percent by May, a run the Bank of Canada has attributed largely to…
July 8, 2026
View chart & download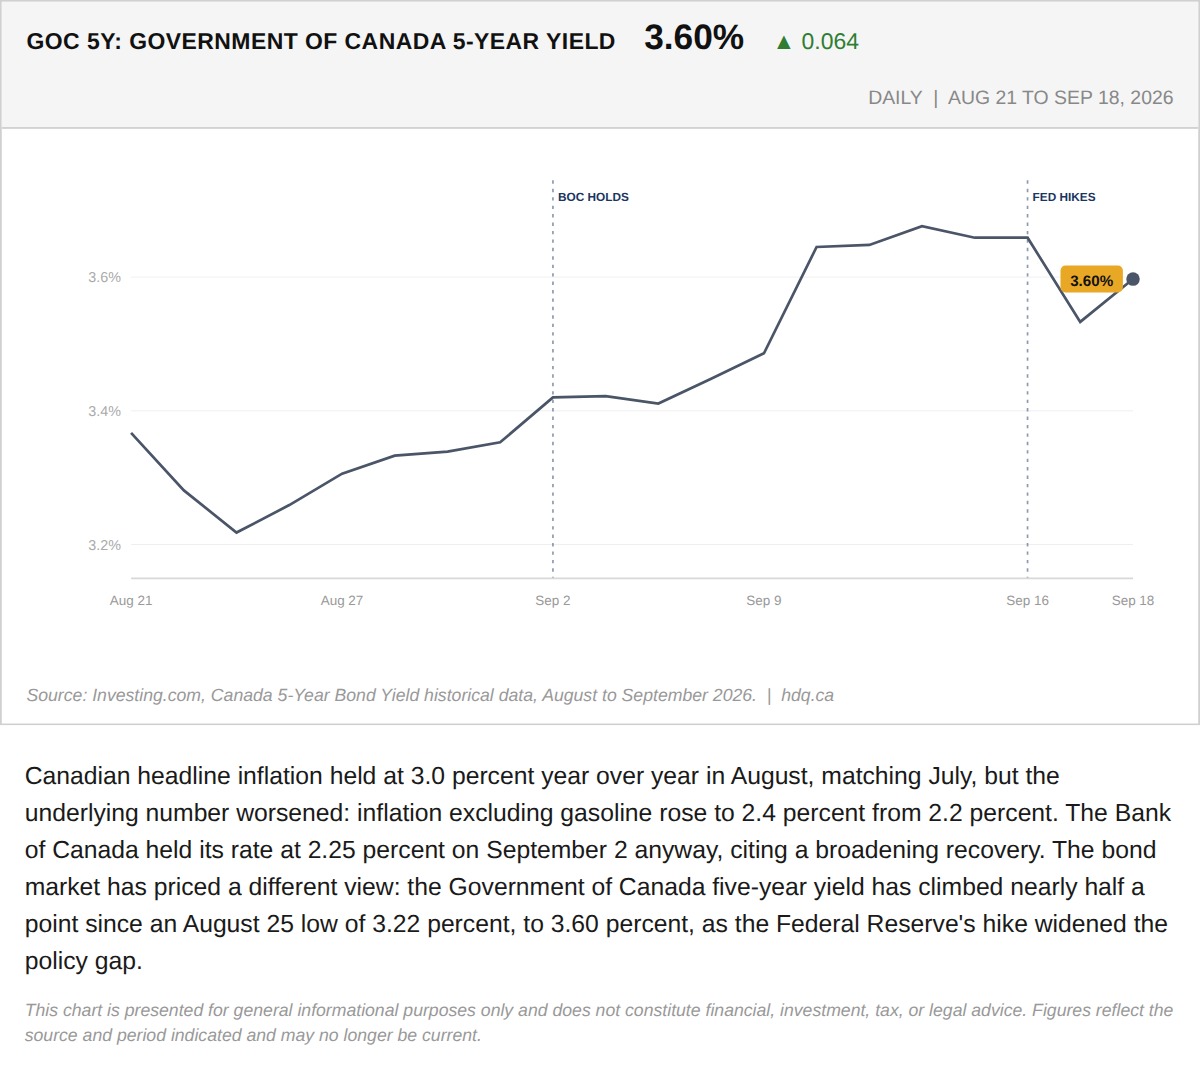
Canadian headline inflation held at 3.0 percent year over year in August, matching July, but the underlying number worsened: inflation…
The Bond Market Already Moved Before the Bank of Canada Has To
September 21, 2026
View chart & download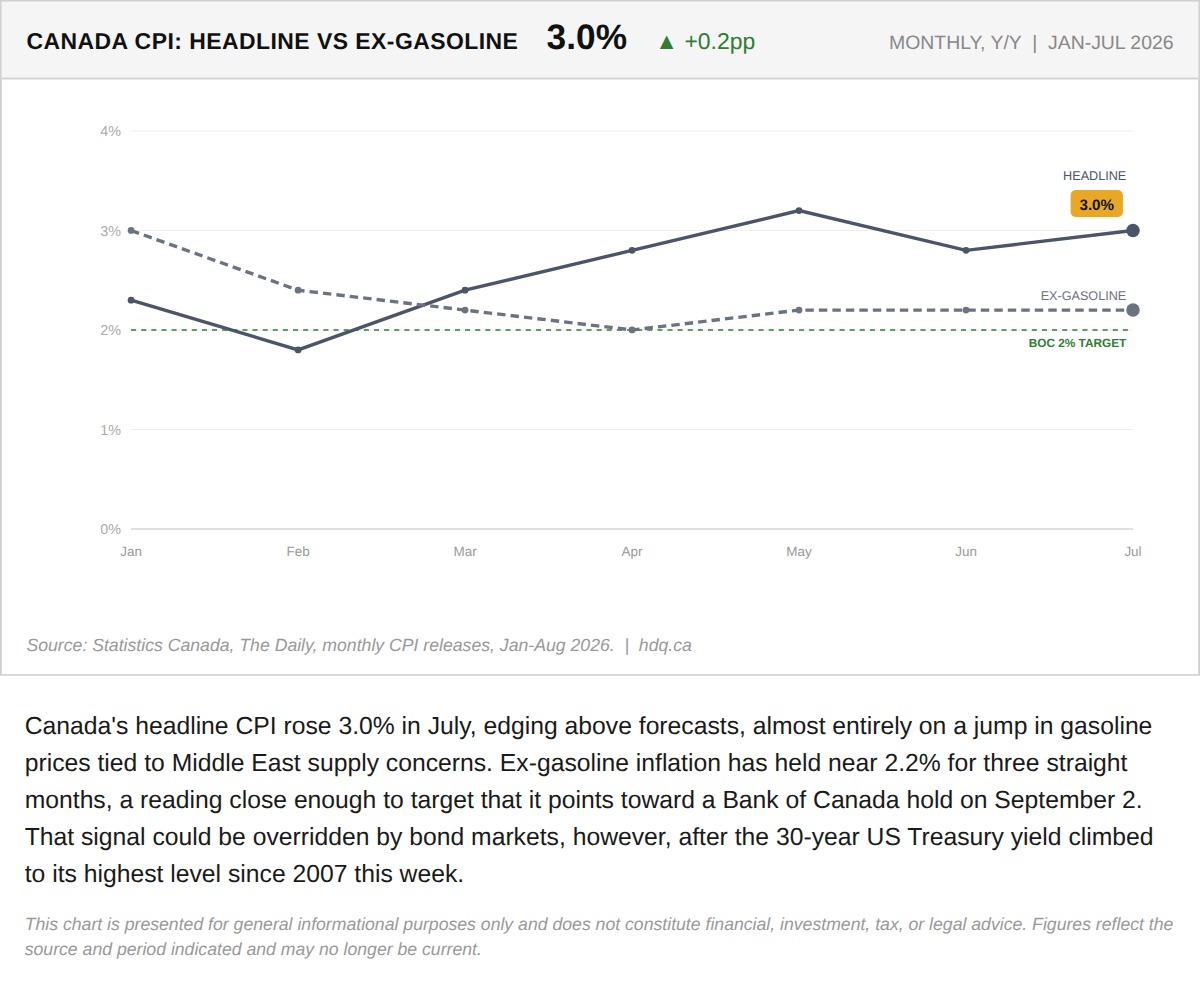
Canada's headline CPI rose 3.0% in July, edging above forecasts, almost entirely on a jump in gasoline prices tied to Middle East supply concerns.
Canada CPI Points to a BoC Hold as Bond Yields Climb
August 18, 2026
View chart & download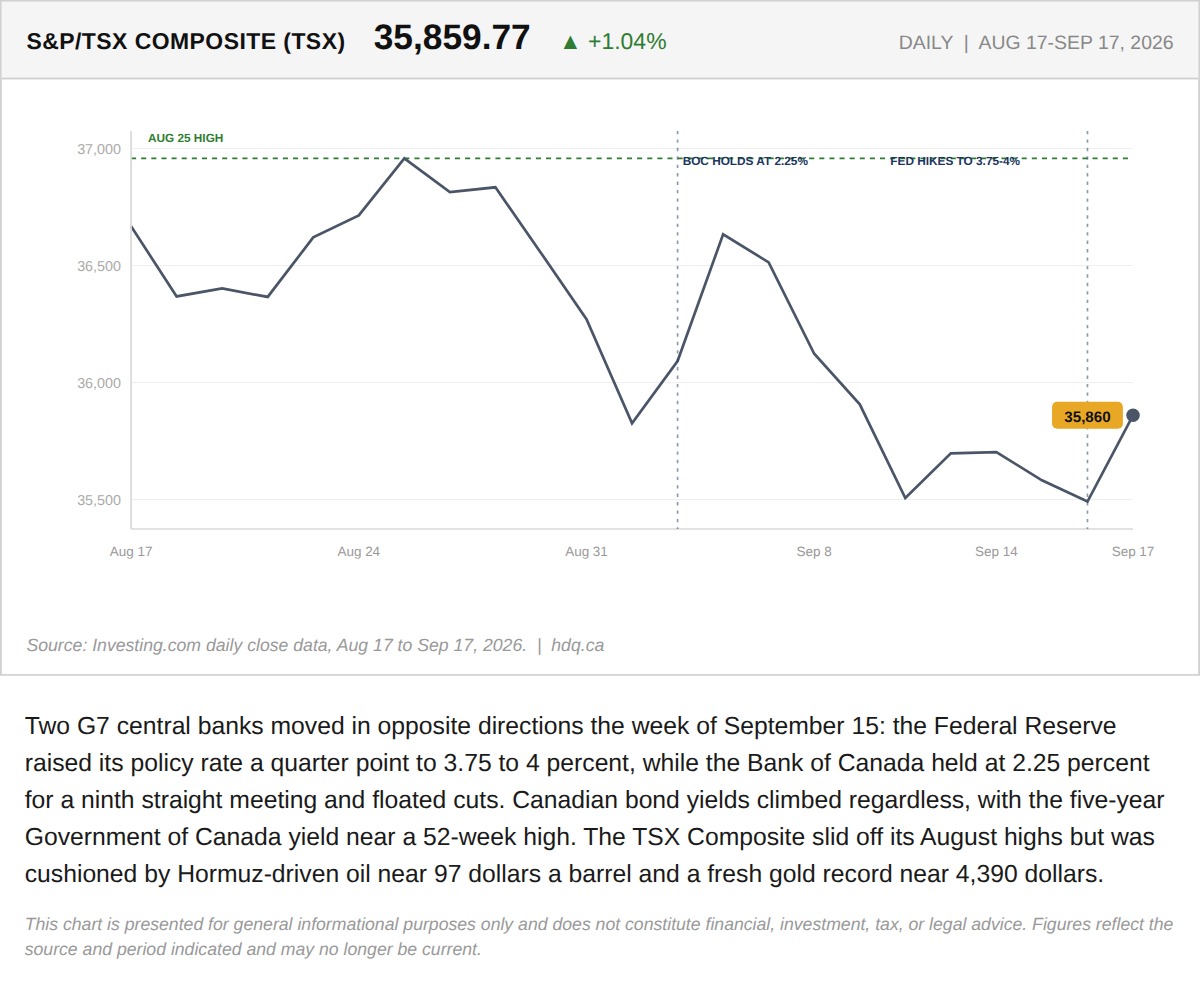
Two G7 central banks moved in opposite directions the week of September 15: the Federal Reserve raised its policy rate a quarter point to…
The Week the Bank of Canada's Own Rate Stopped Setting Canadian Borrowing Costs
September 19, 2026
View chart & download