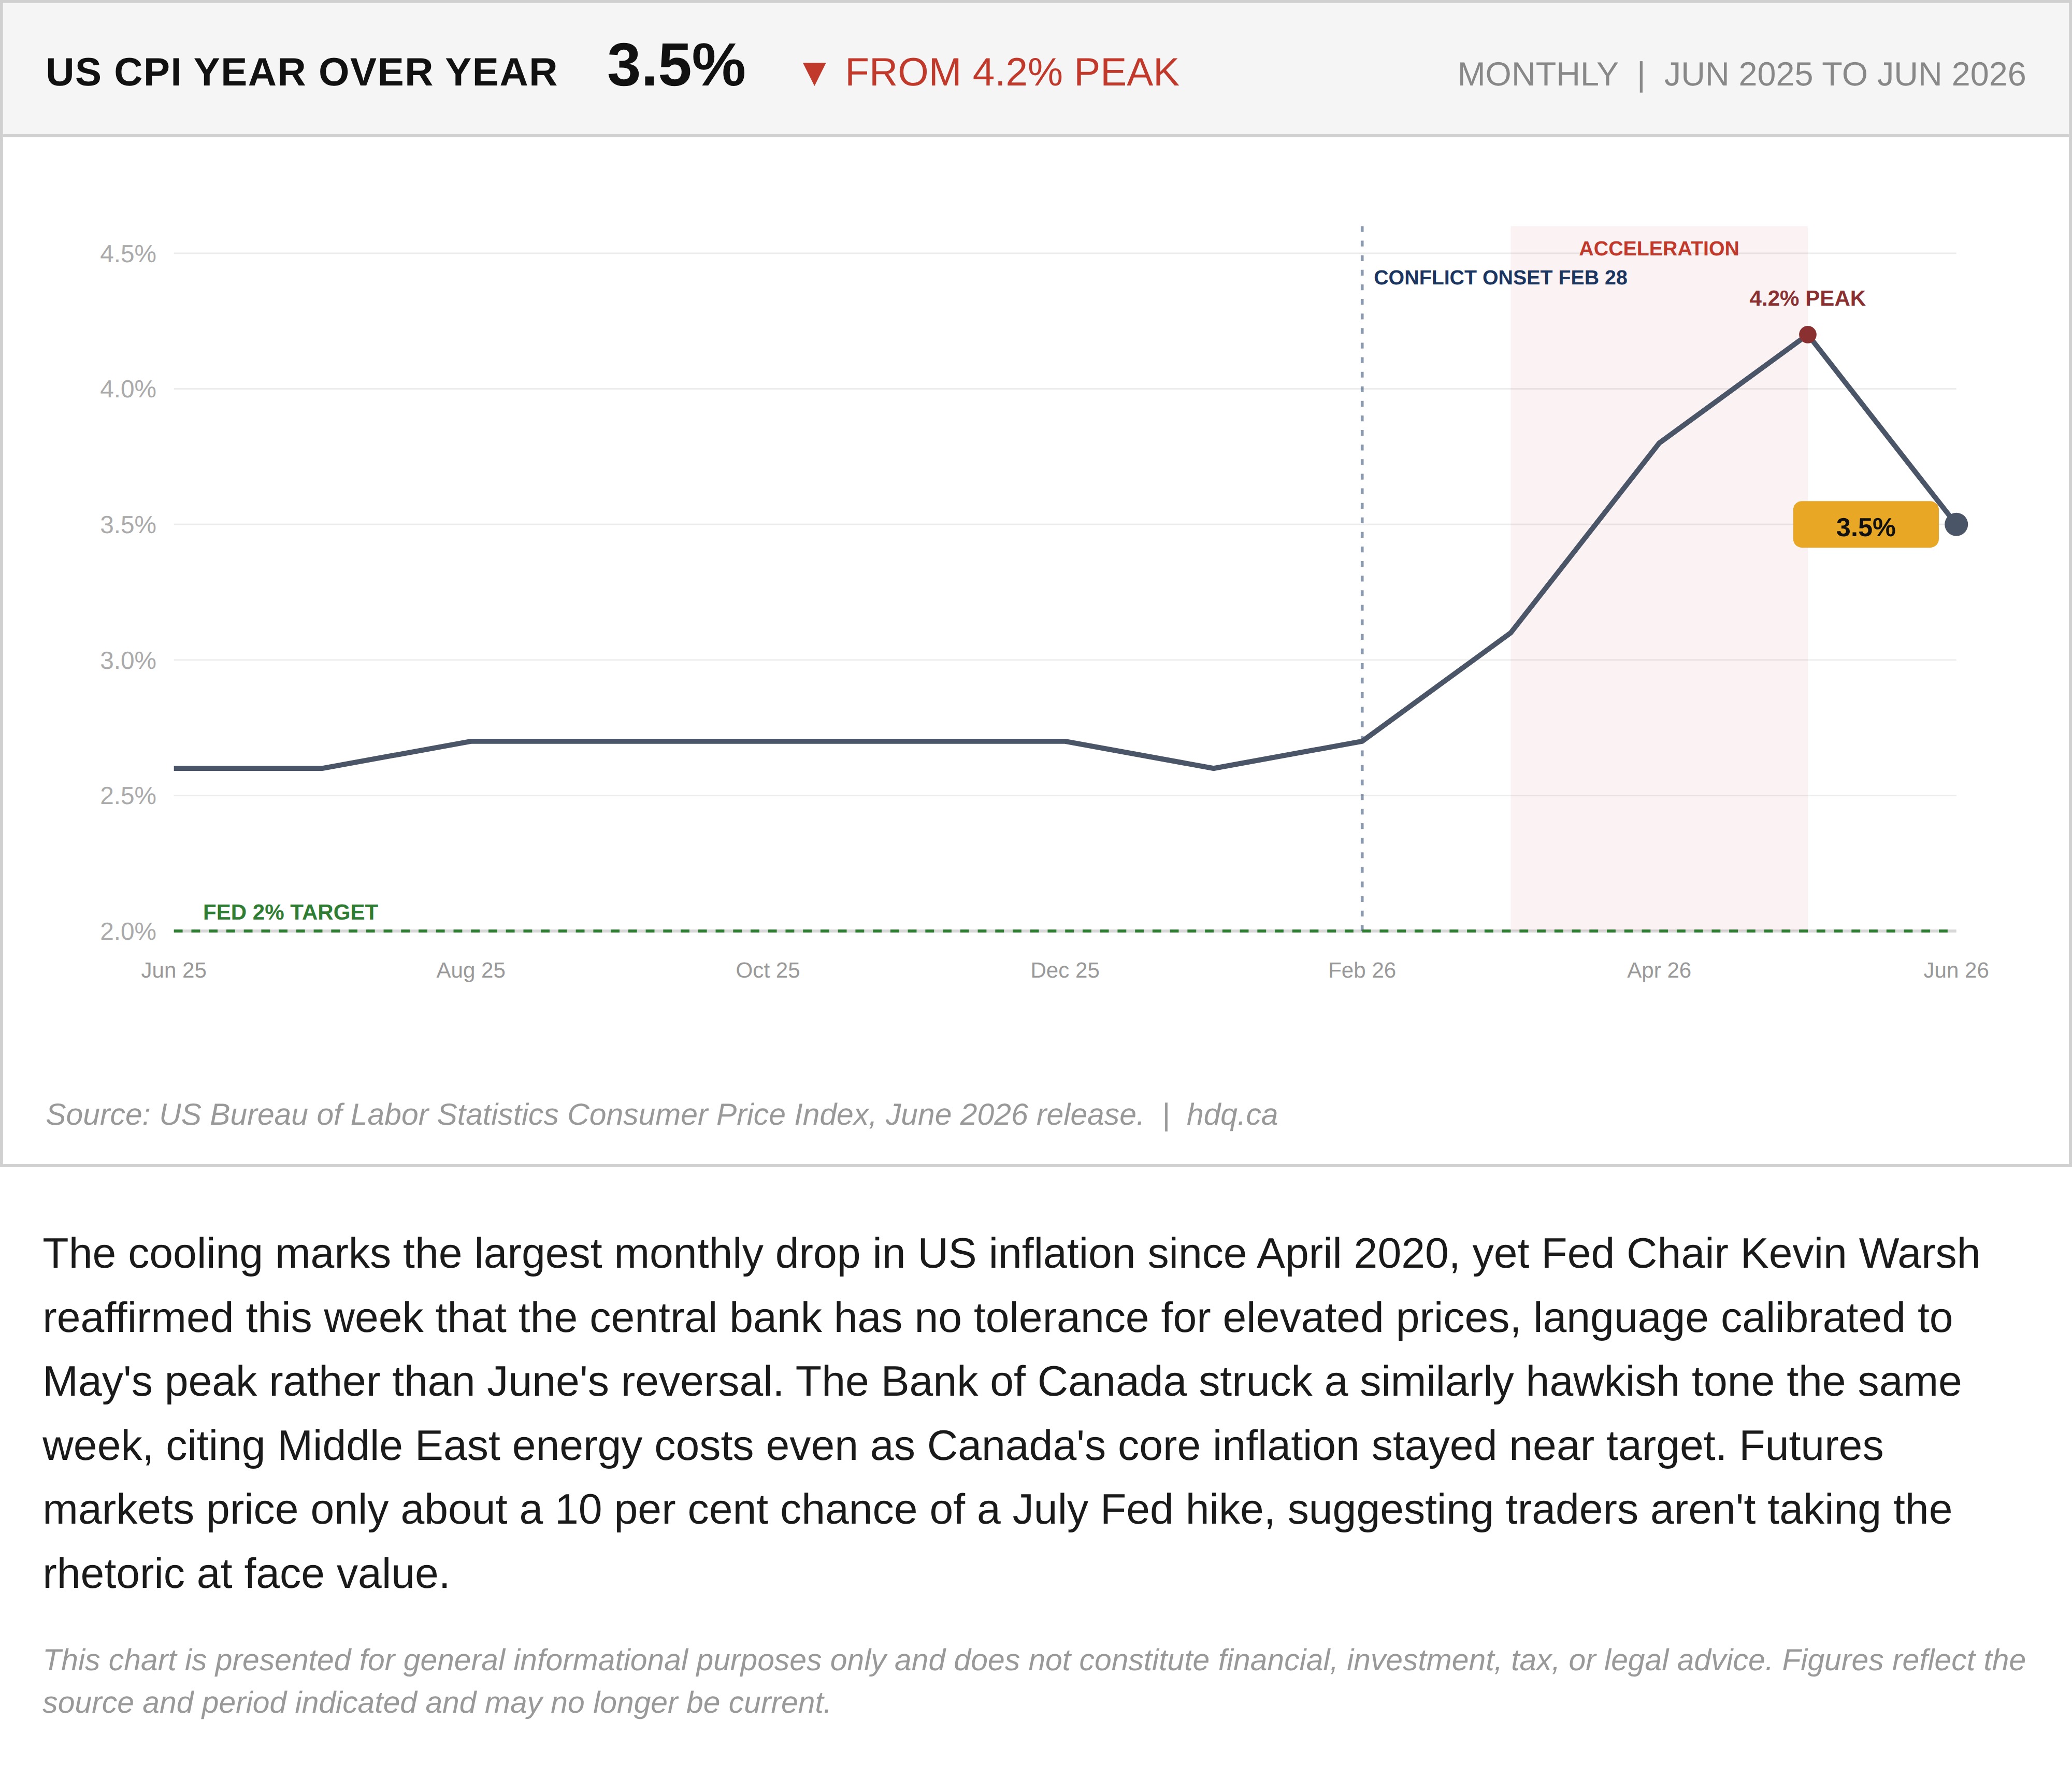
The cooling marks the largest monthly drop in US inflation since April 2020, yet Fed Chair Kevin Warsh reaffirmed this week that the central bank has no tolerance for elevated prices, language calibrated to May's peak rather than June's reversal. The Bank of Canada struck a similarly hawkish tone the same week, citing Middle East energy costs even as Canada's core inflation stayed near target. Futures markets price only about a 10 per cent chance of a July Fed hike, suggesting traders aren't taking the rhetoric at face value.
This chart is presented for general informational purposes only and does not constitute financial, investment, tax, or legal advice. Figures reflect the source and period indicated and may no longer be current.

Related charts
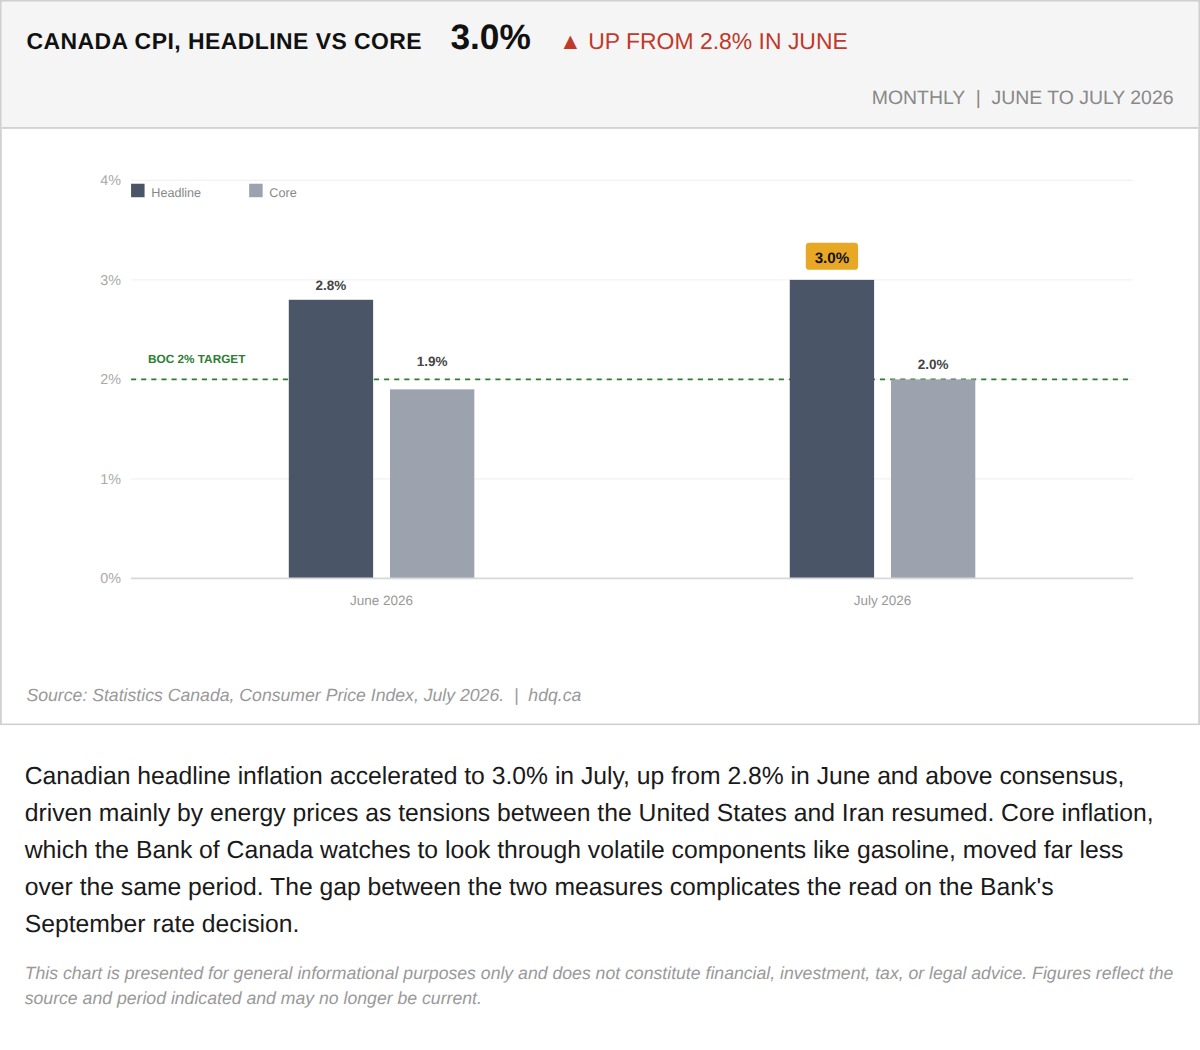
Canadian headline inflation accelerated to 3.0% in July, up from 2.8% in June and above consensus, driven mainly by energy prices as…
August 20, 2026
View chart & download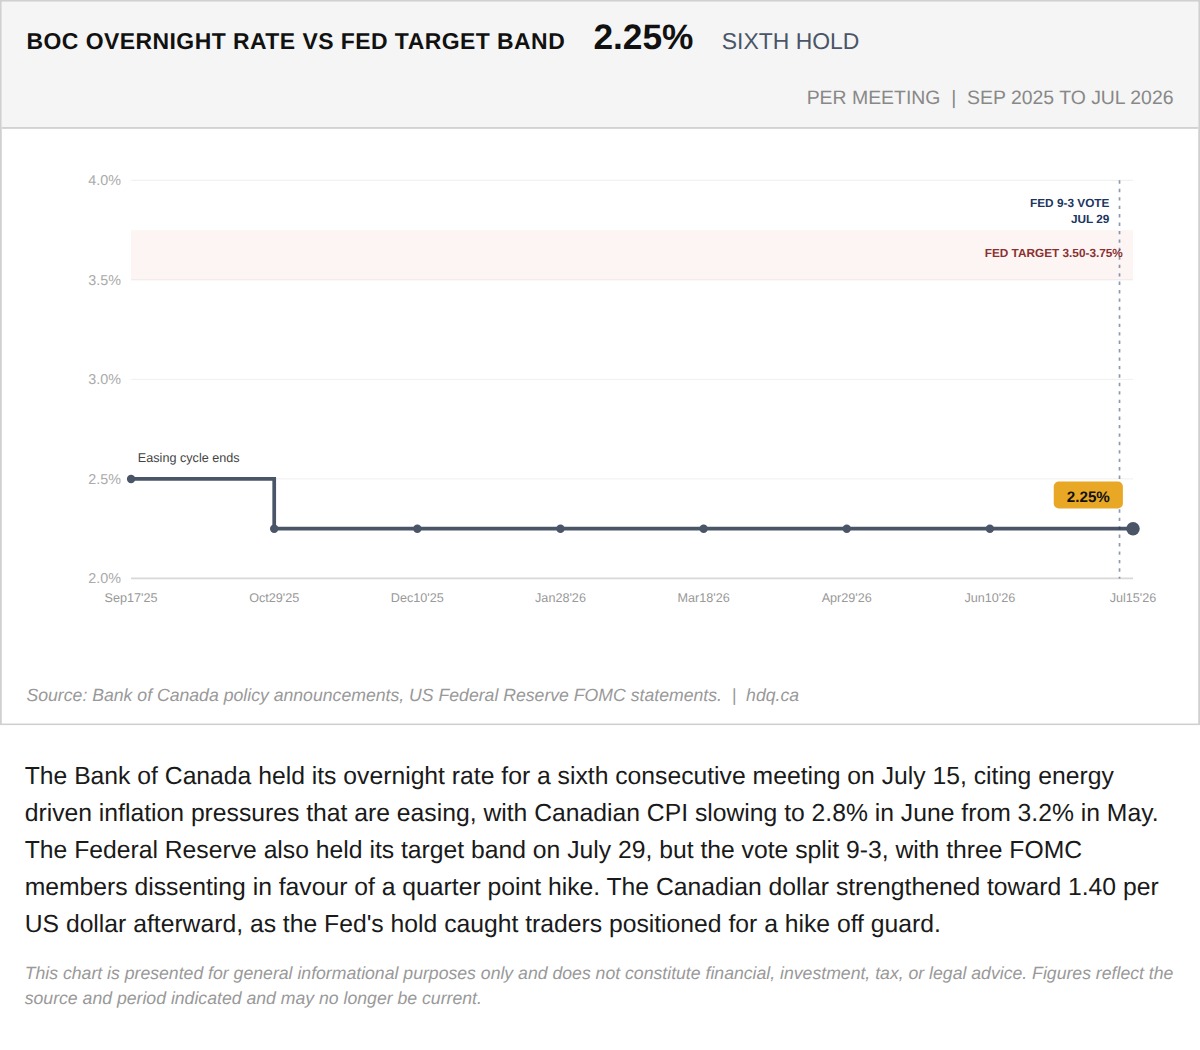
The Bank of Canada held its overnight rate for a sixth consecutive meeting on July 15, citing energy driven inflation pressures that are…
The Bank of Canada Held at 2.25% for a Sixth Meeting. The Fed Held Too, but Three Votes Said No.
July 31, 2026
View chart & download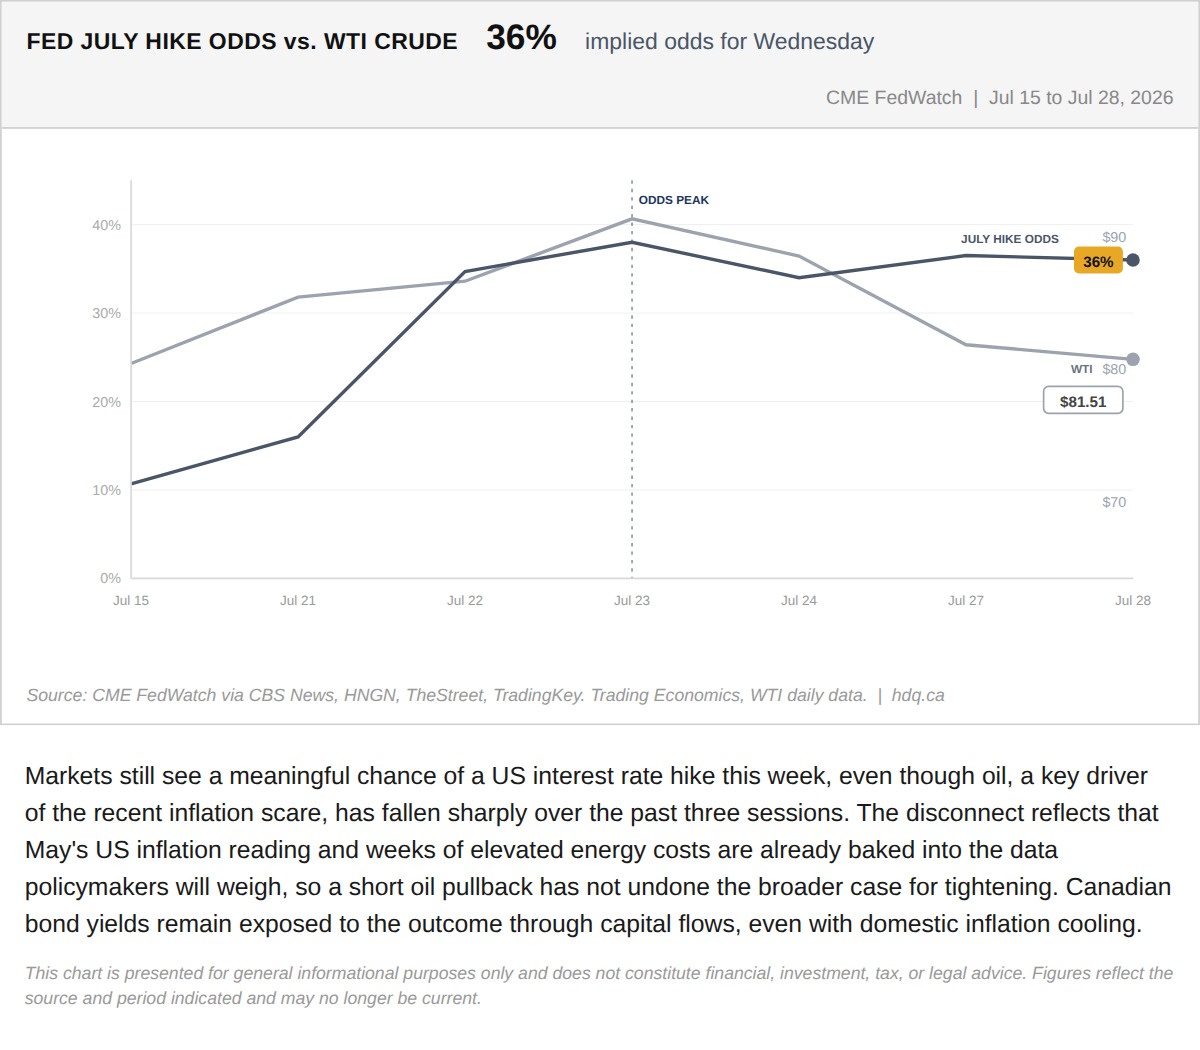
Markets still see a meaningful chance of a US interest rate hike this week, even though oil, a key driver of the recent inflation scare,…
Fed Hike Odds Have Barely Moved Even as Oil Fell 12%. Here Is Why That Gap Matters.
July 28, 2026
View chart & download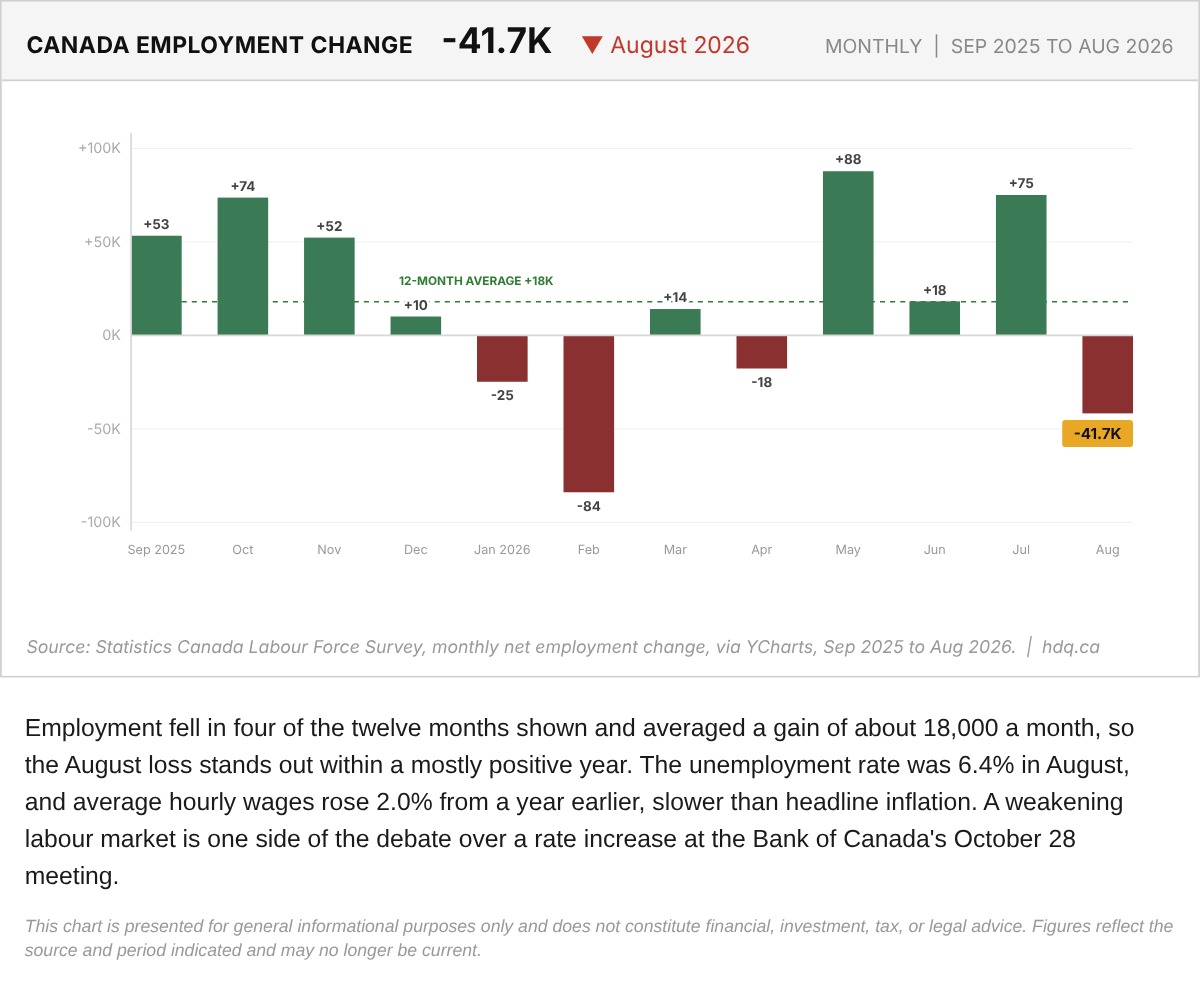
Employment fell in four of the twelve months shown and averaged a gain of about 18,000 a month, so the August loss stands out within a mostly positive year.
Canada Monthly Net Employment Change, September 2025 to August 2026
October 6, 2026
View chart & download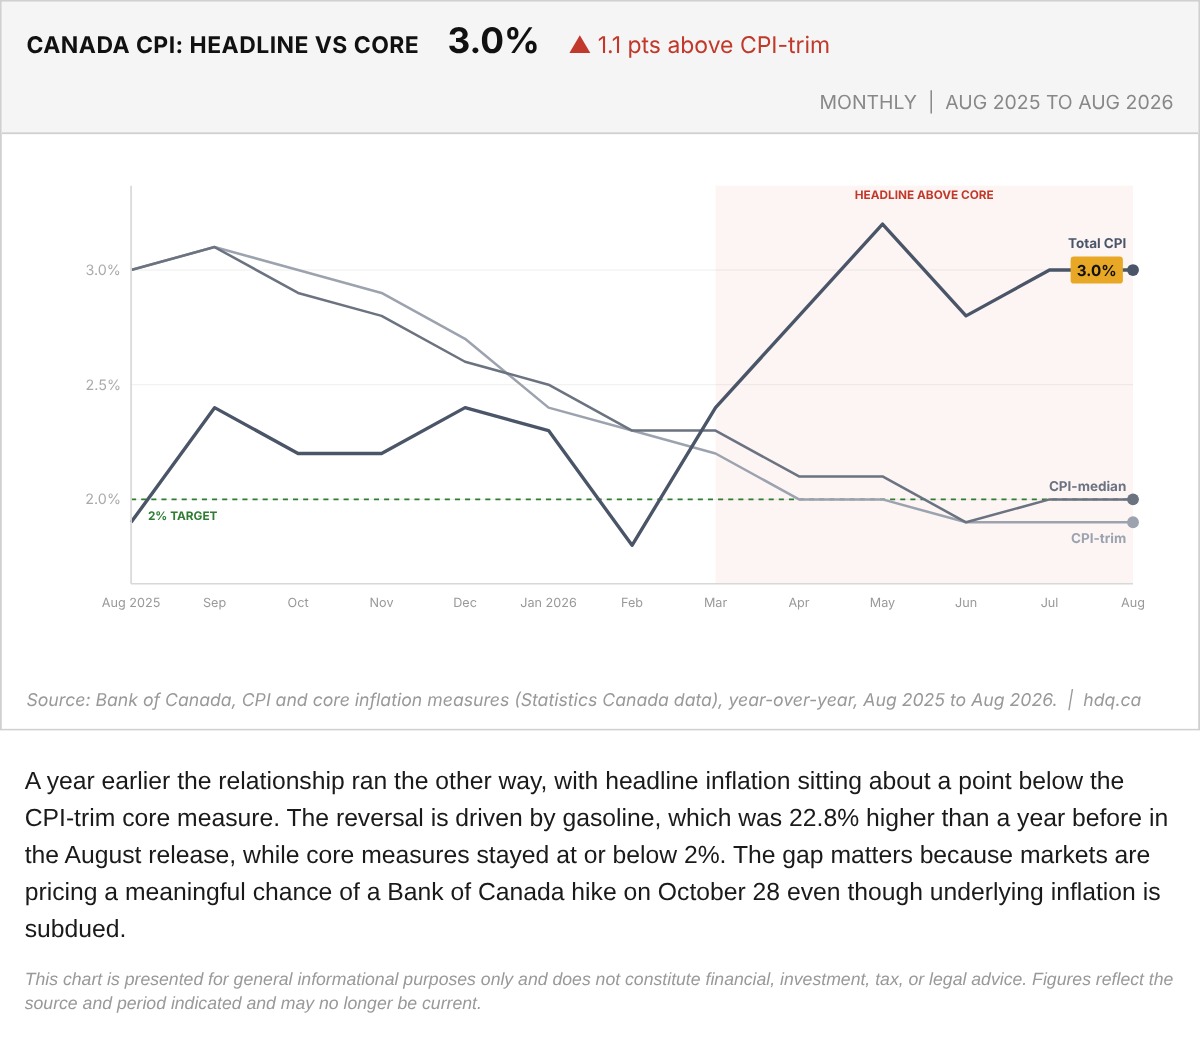
A year earlier the relationship ran the other way, with headline inflation sitting about a point below the CPI-trim core measure.
Canada Headline CPI Against Bank of Canada Core Measures, August 2026
October 6, 2026
View chart & download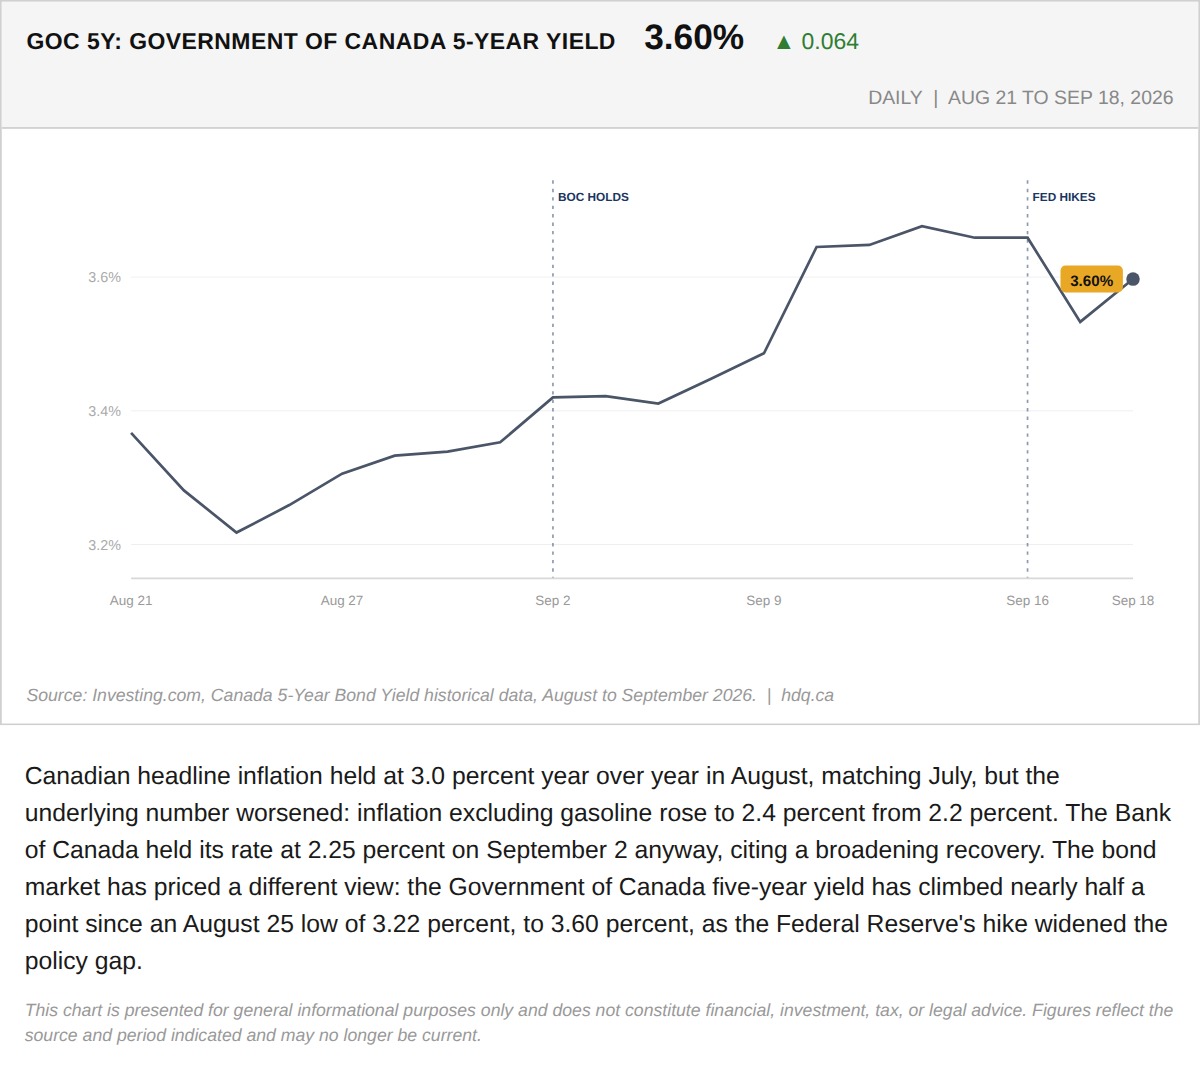
Canadian headline inflation held at 3.0 percent year over year in August, matching July, but the underlying number worsened: inflation…
The Bond Market Already Moved Before the Bank of Canada Has To
September 21, 2026
View chart & download