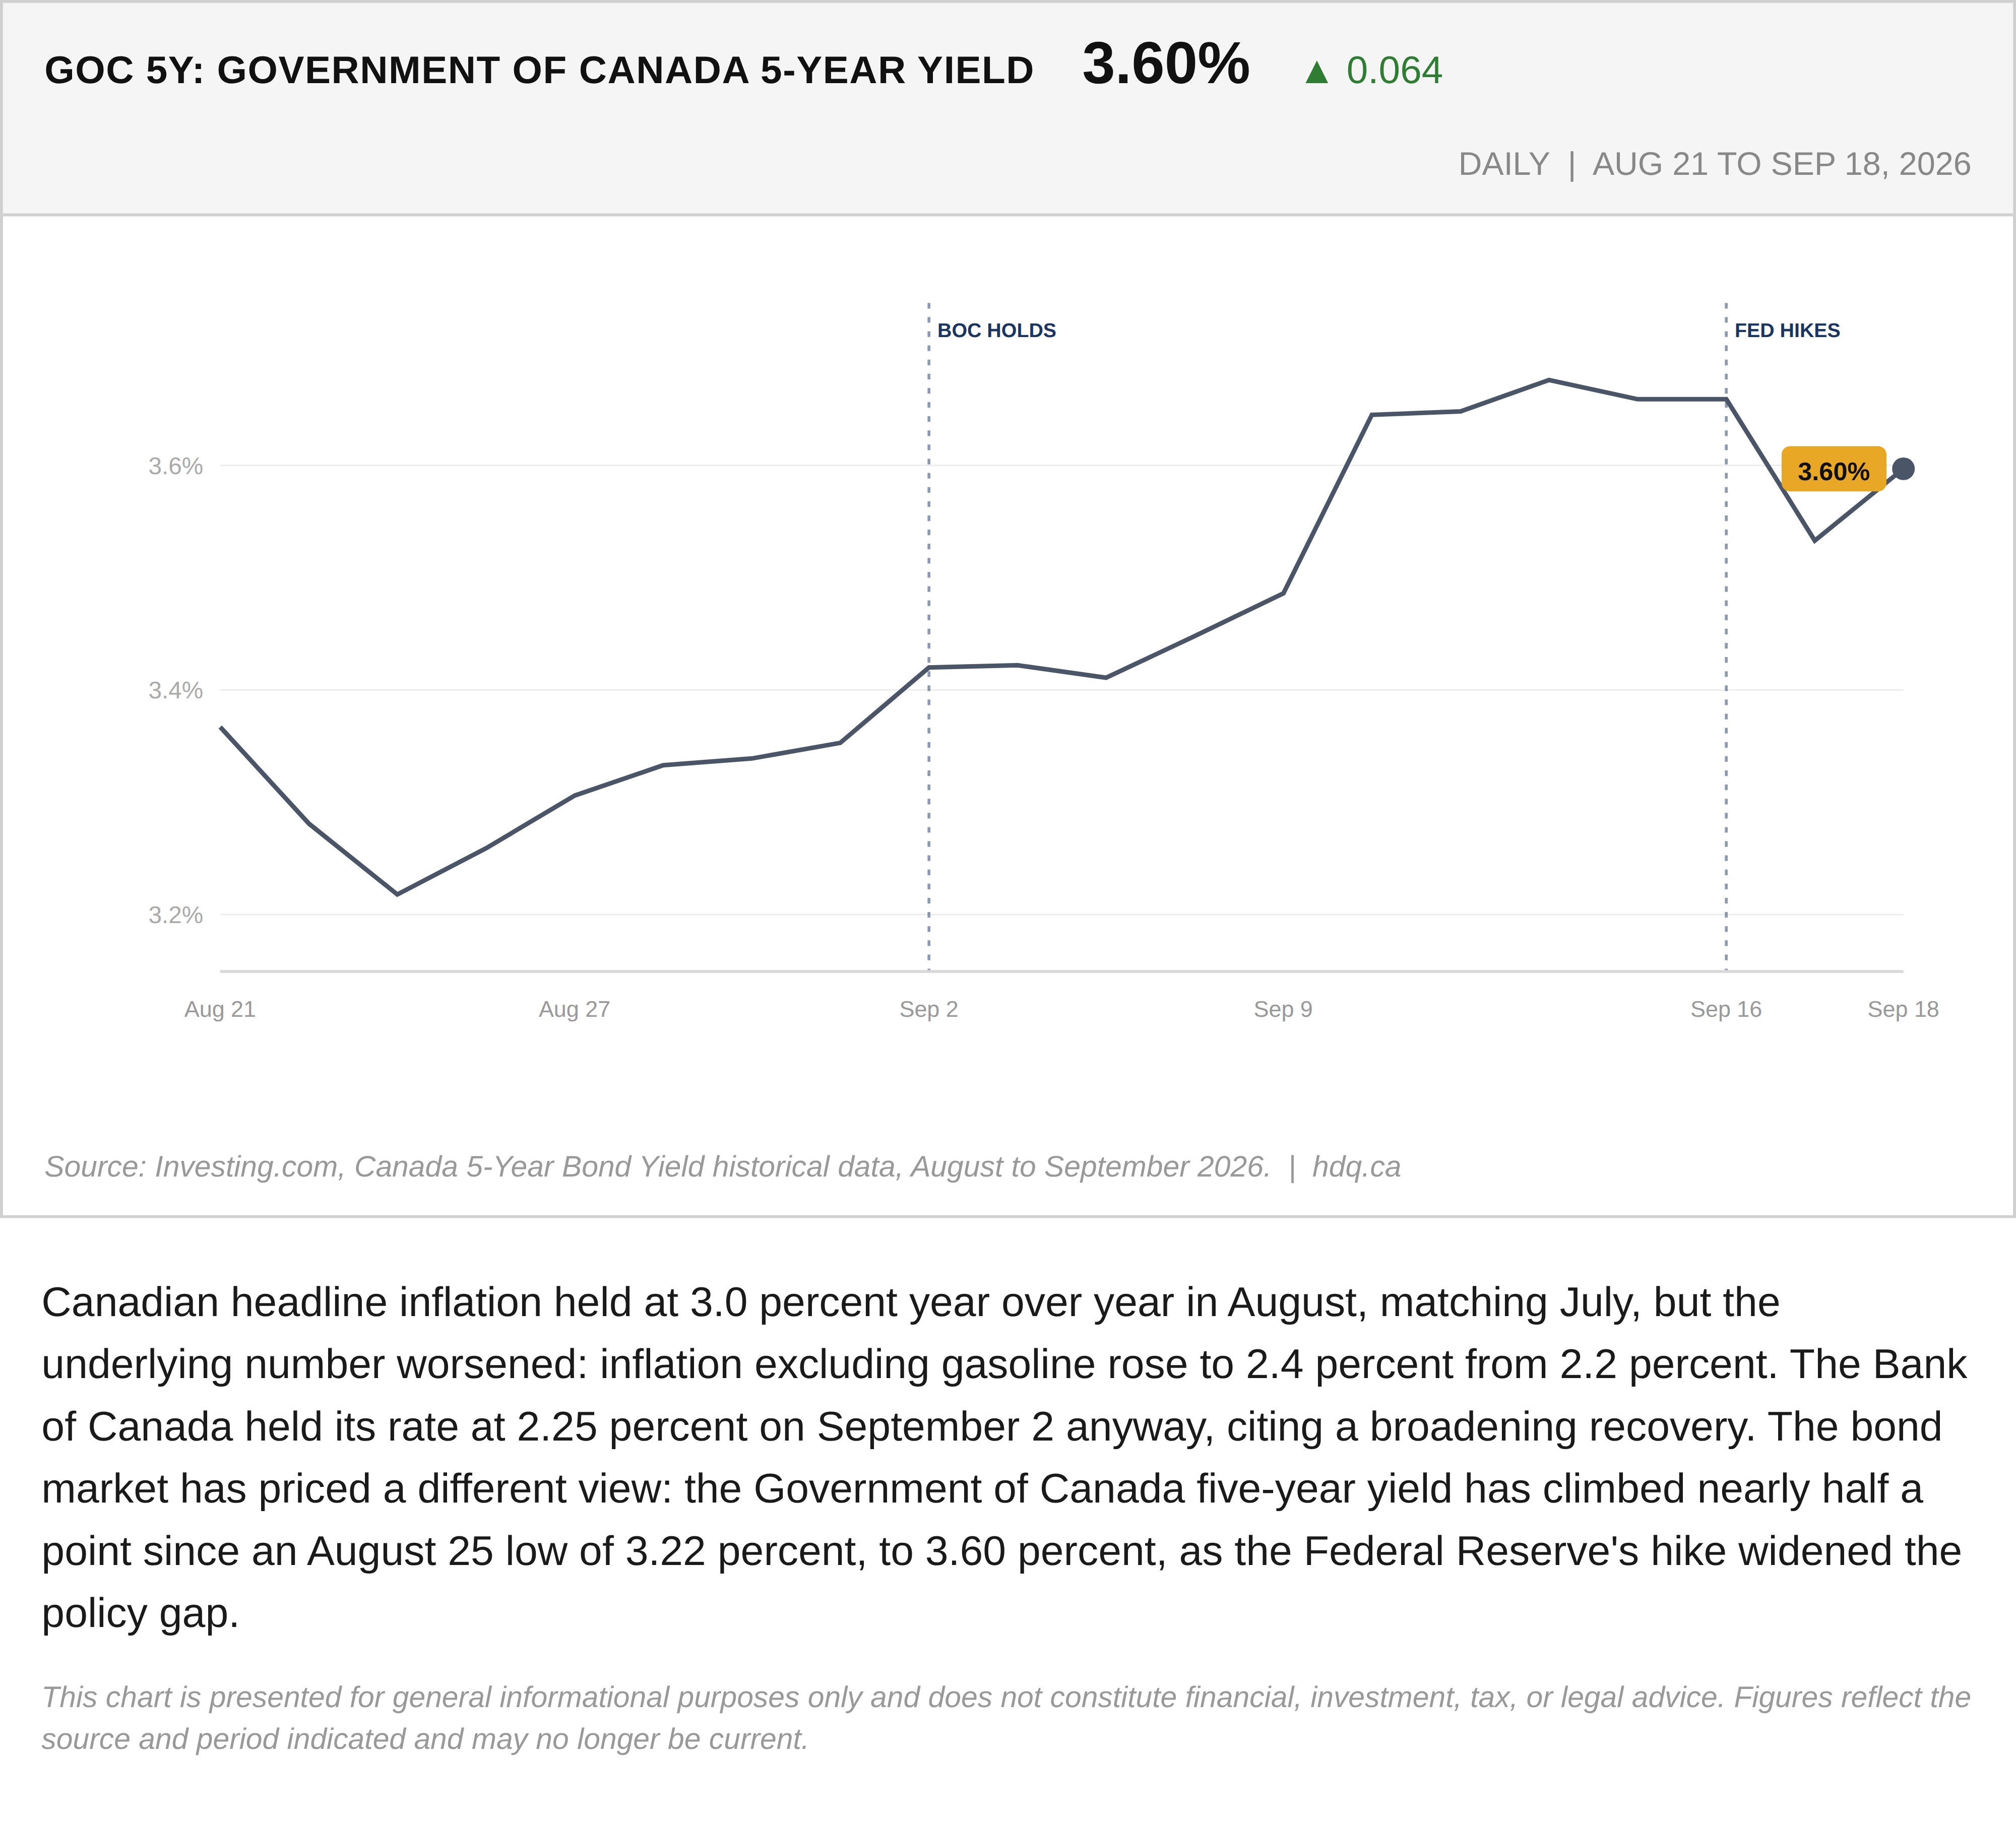
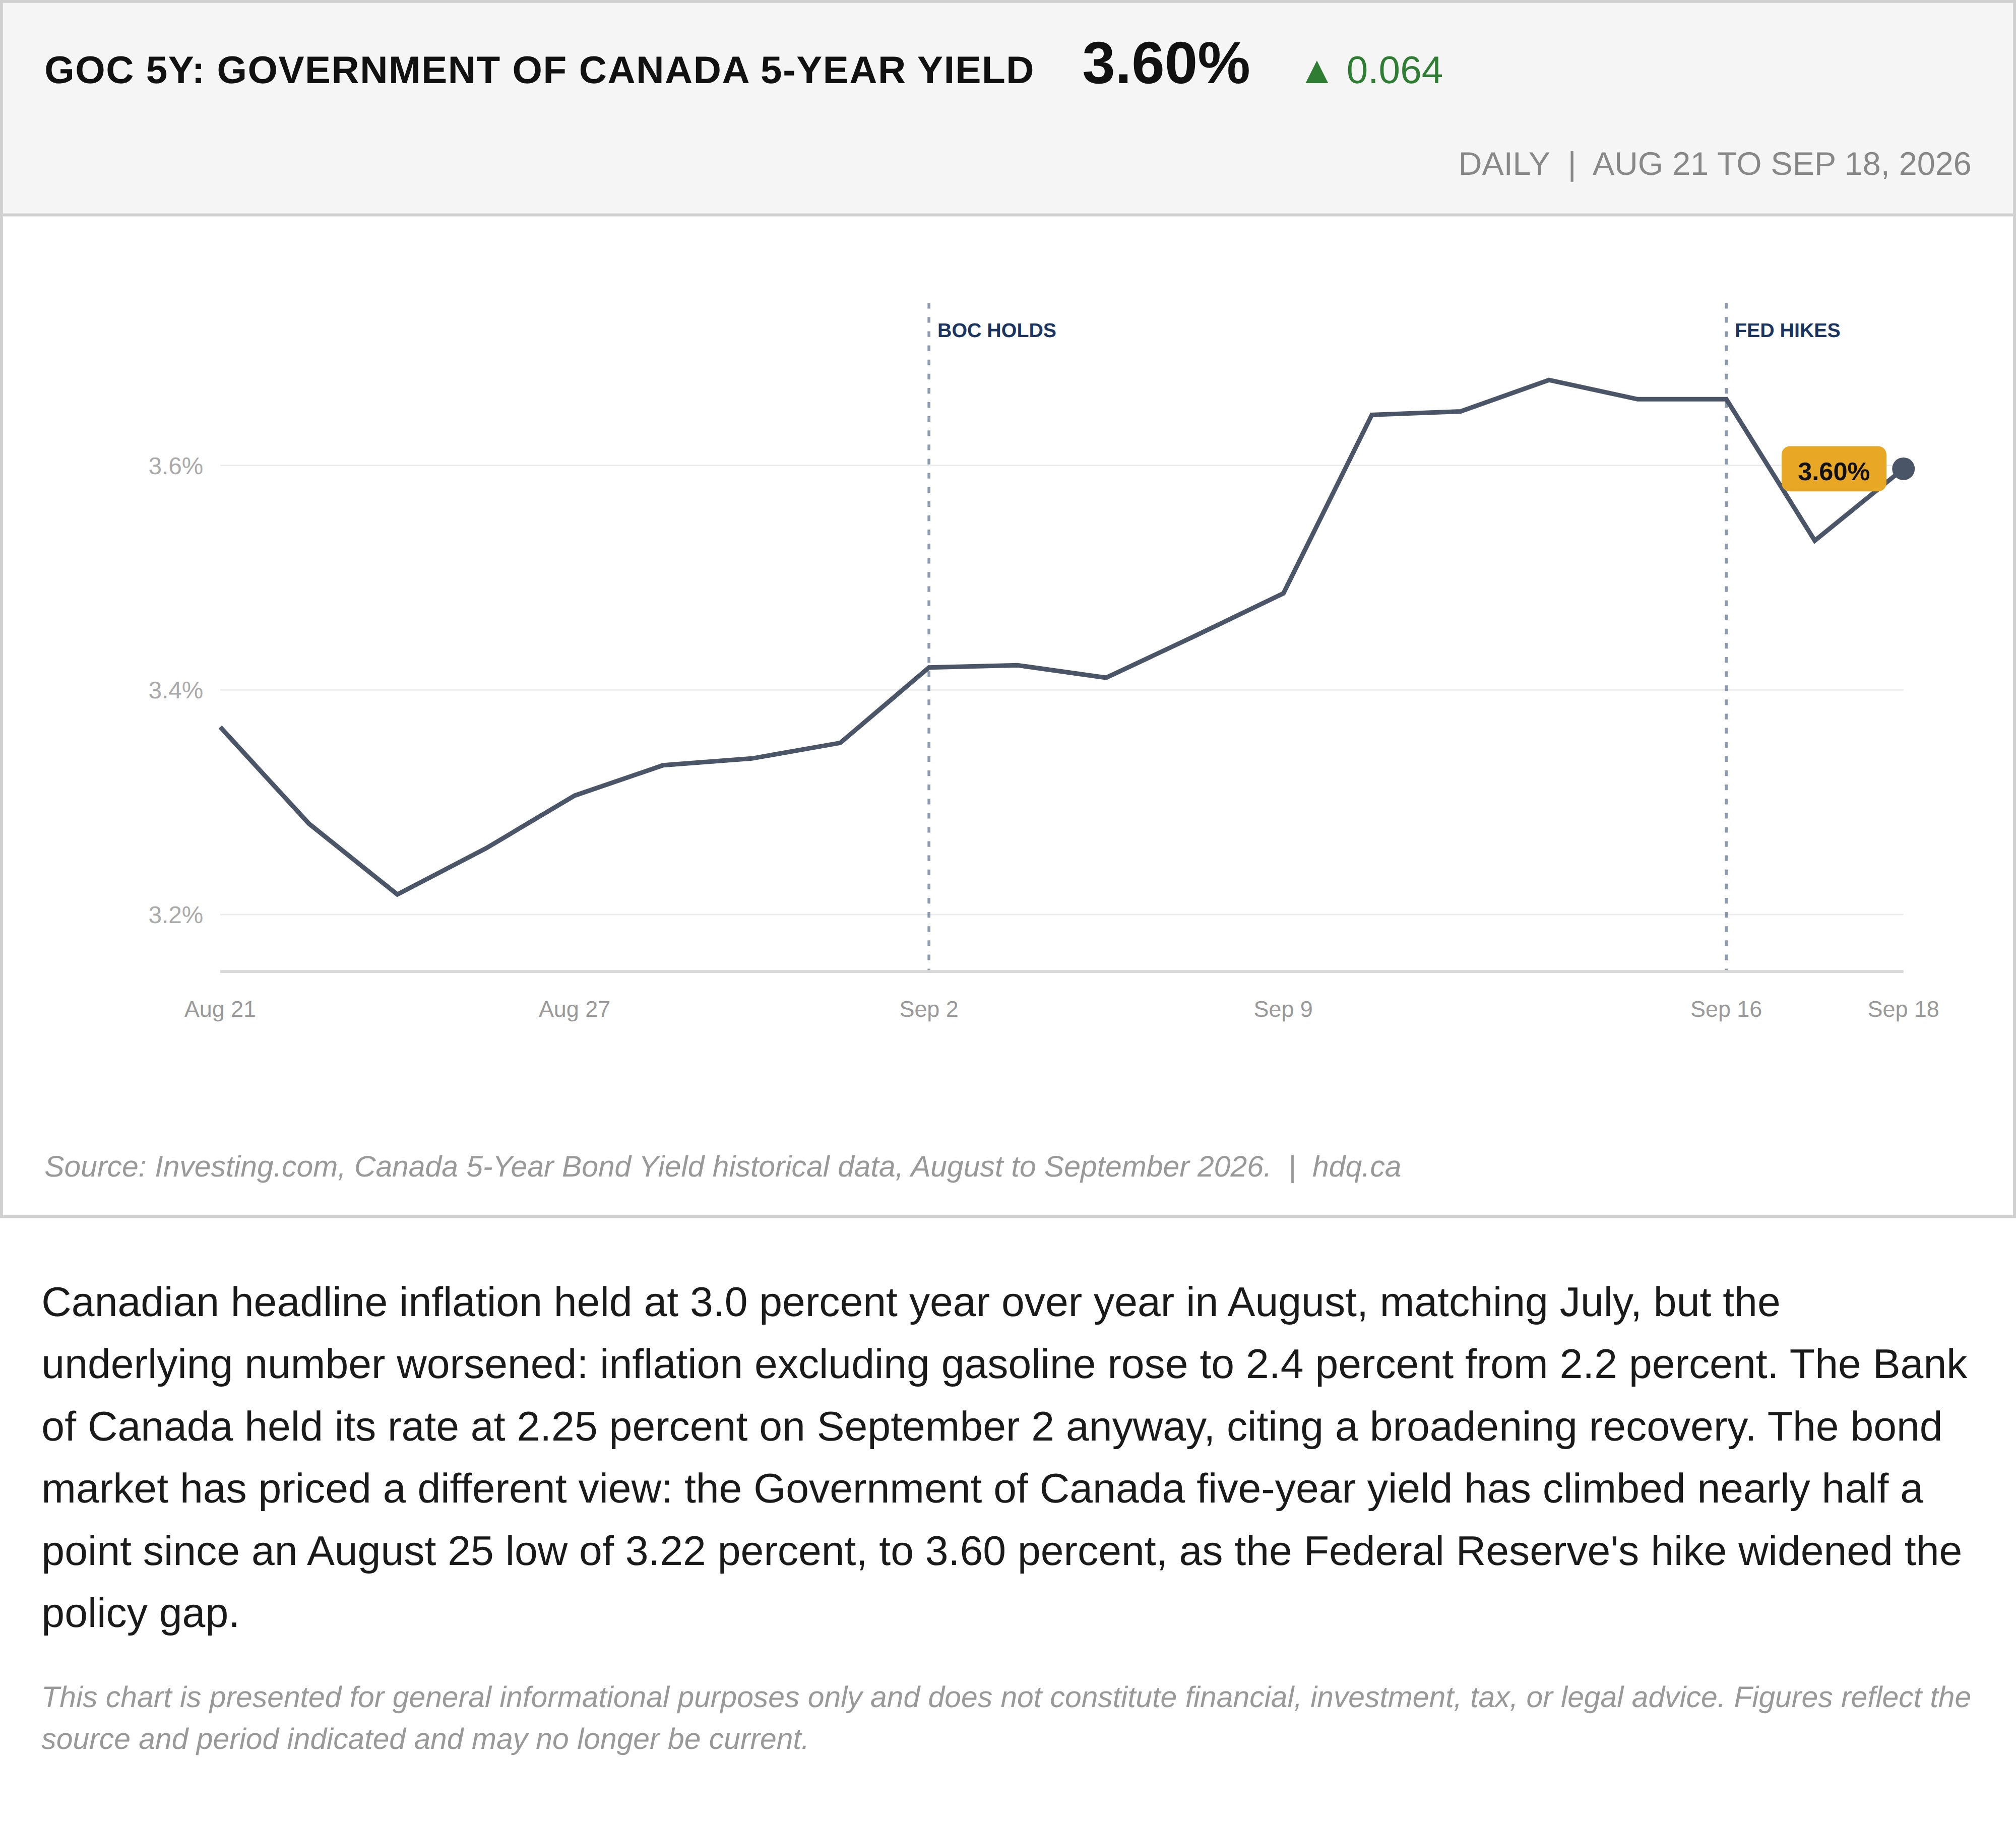
Canadian headline inflation held at 3.0 percent year over year in August, matching July, but the underlying number worsened: inflation excluding gasoline rose to 2.4 percent from 2.2 percent. The Bank of Canada held its rate at 2.25 percent on September 2 anyway, citing a broadening recovery. The bond market has priced a different view: the Government of Canada five-year yield has climbed nearly half a point since an August 25 low of 3.22 percent, to 3.60 percent, as the Federal Reserve's hike widened the policy gap.
This chart is presented for general informational purposes only and does not constitute financial, investment, tax, or legal advice. Figures reflect the source and period indicated and may no longer be current.
Related charts
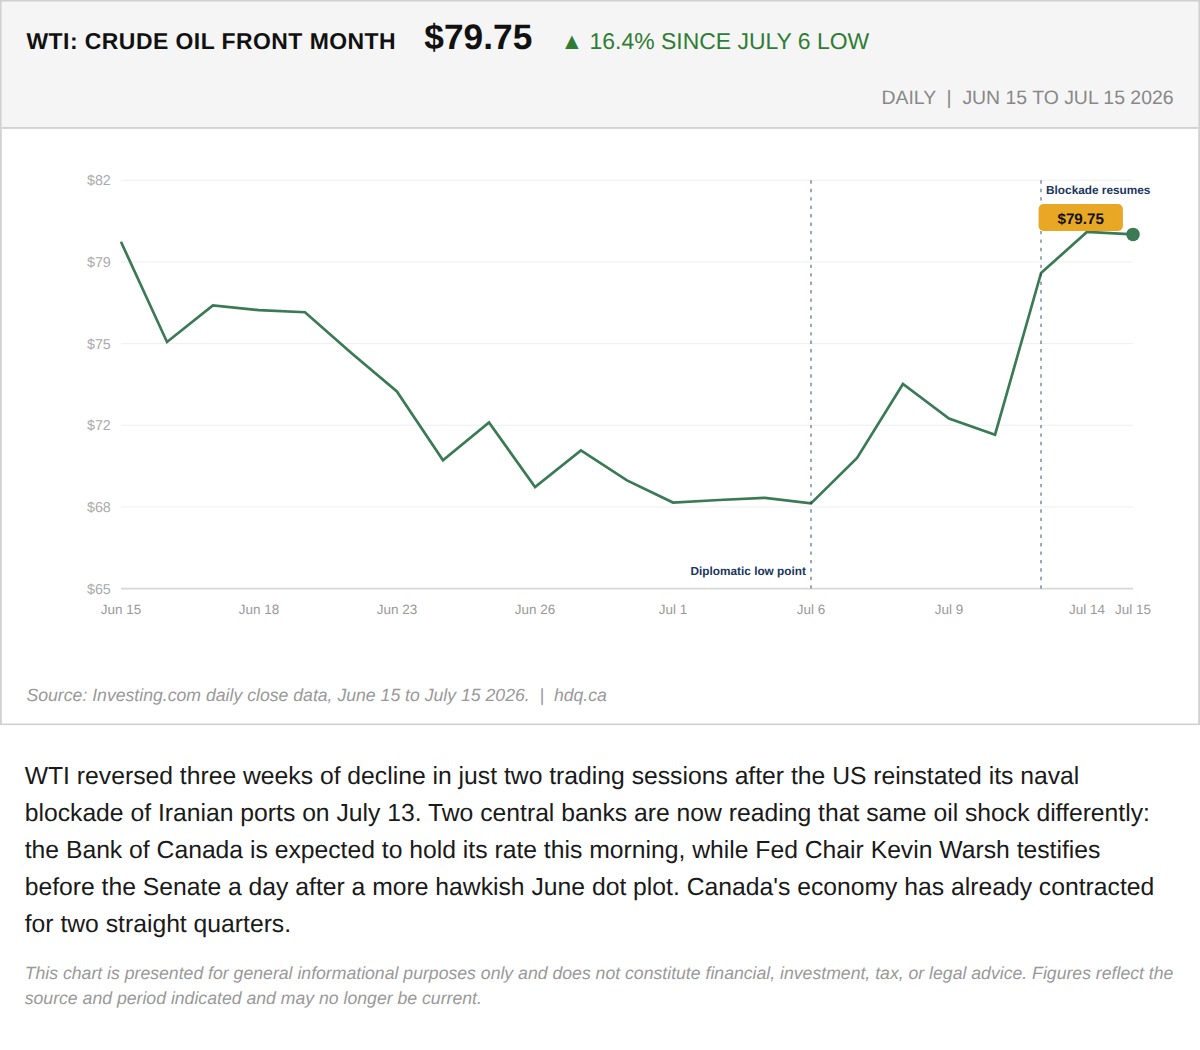
WTI reversed three weeks of decline in just two trading sessions after the US reinstated its naval blockade of Iranian ports on July 13.
July 15, 2026
View chart & download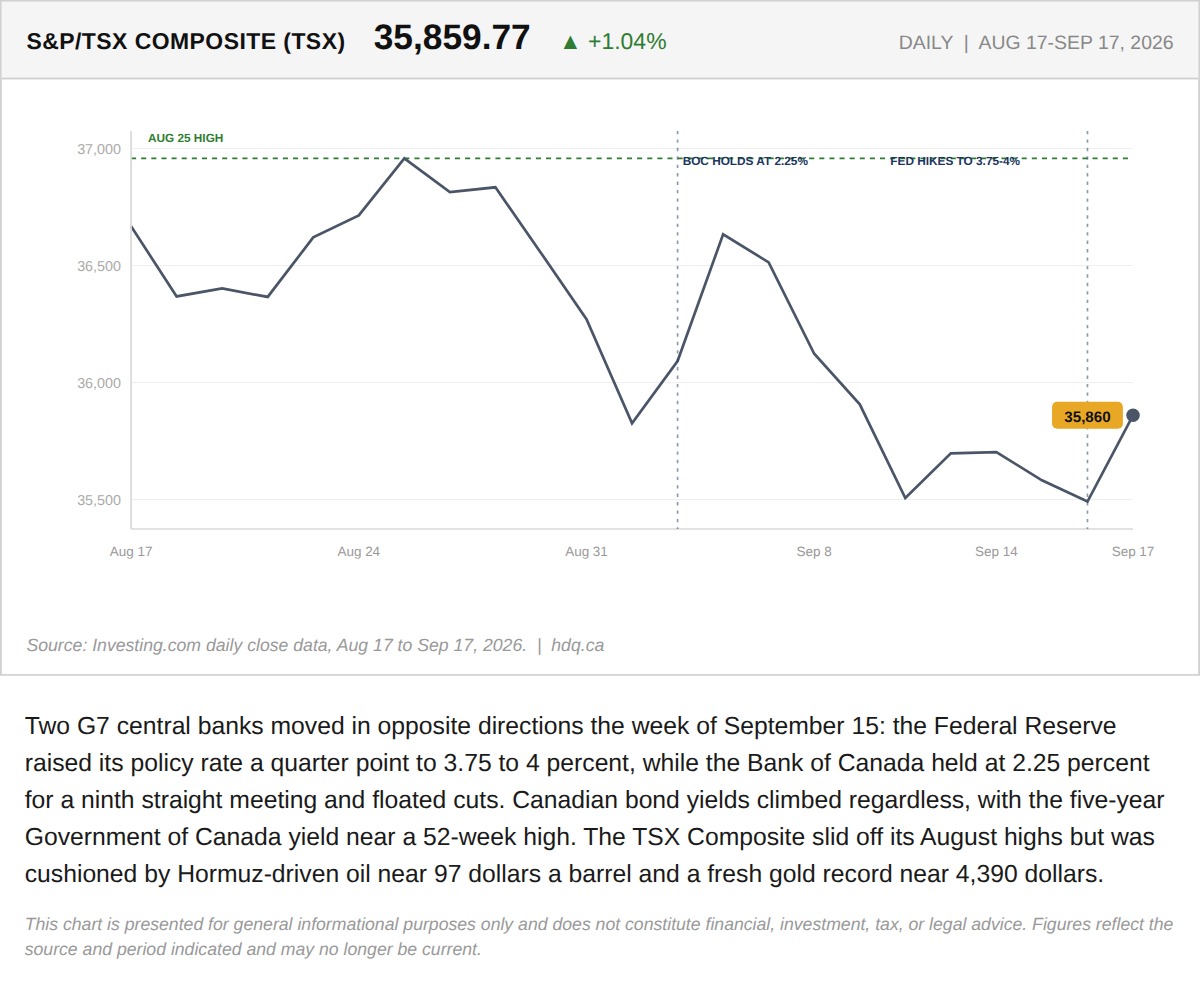
Two G7 central banks moved in opposite directions the week of September 15: the Federal Reserve raised its policy rate a quarter point to…
The Week the Bank of Canada's Own Rate Stopped Setting Canadian Borrowing Costs
September 19, 2026
View chart & download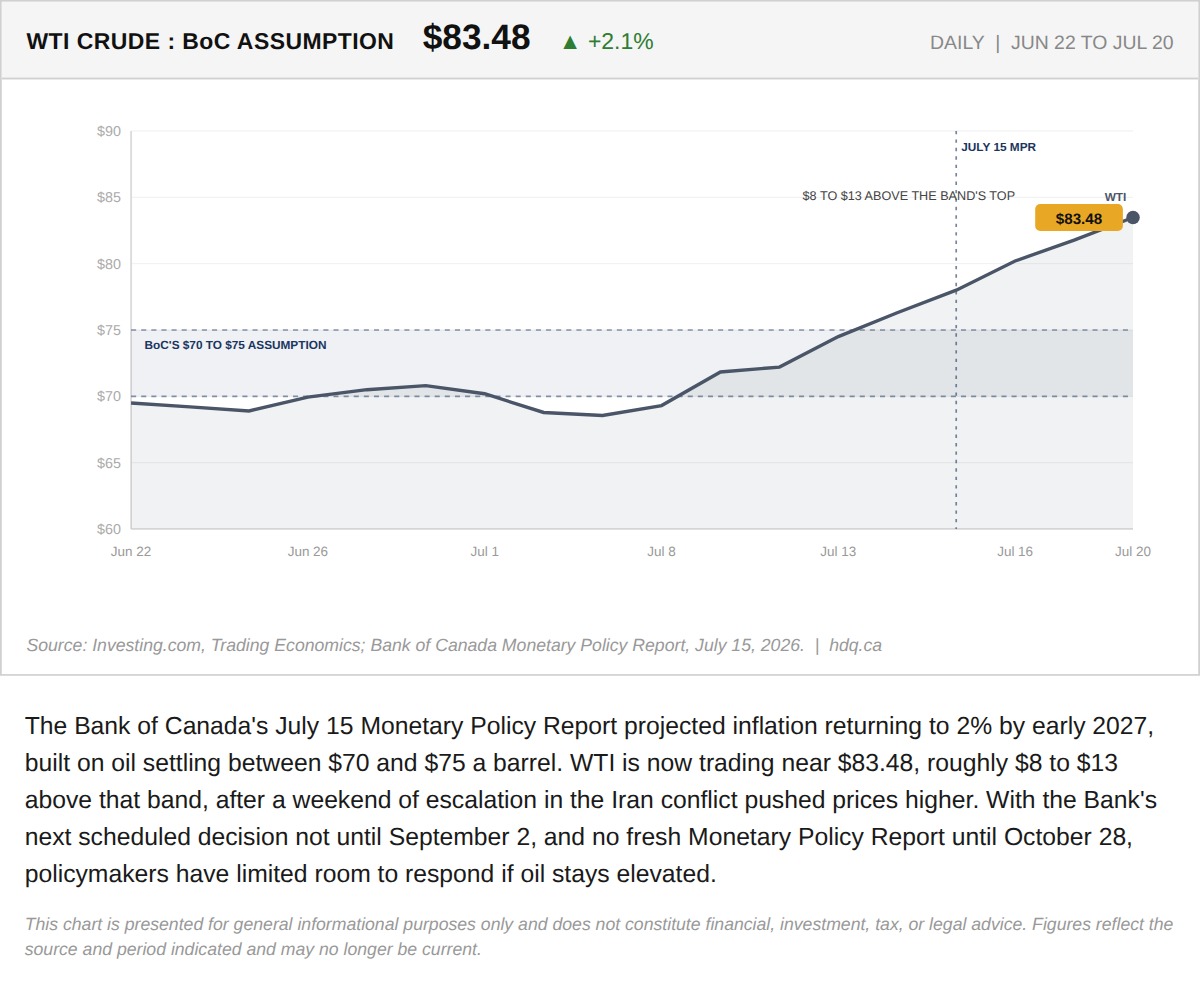
The Bank of Canada's July 15 Monetary Policy Report projected inflation returning to 2% by early 2027, built on oil settling between $70 and $75 a barrel.
The Bank of Canada's Path Back to 2% Assumed Oil at $70 to $75. It's Trading Near $84.
July 20, 2026
View chart & download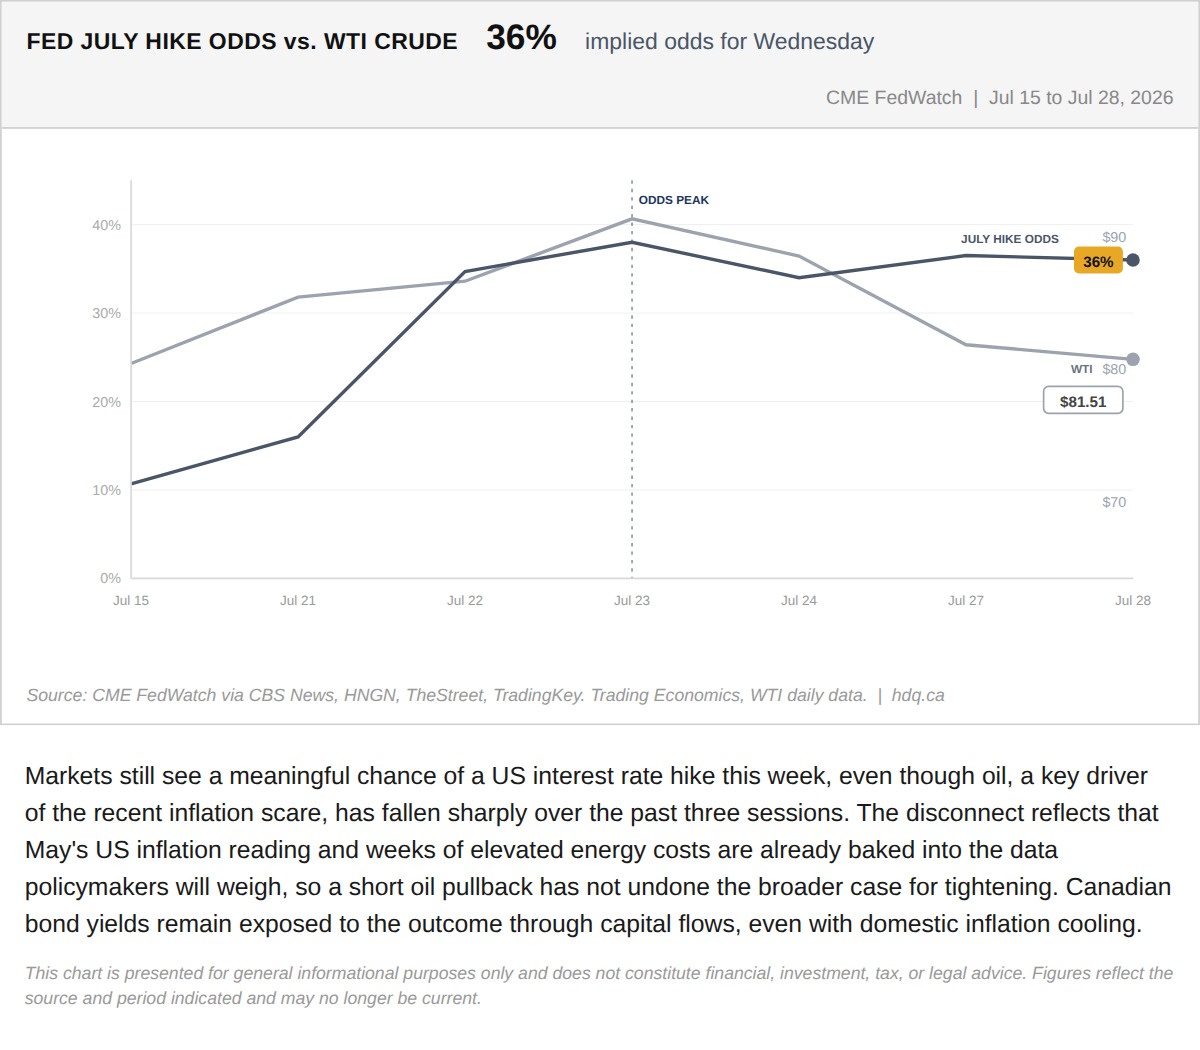
Markets still see a meaningful chance of a US interest rate hike this week, even though oil, a key driver of the recent inflation scare,…
Fed Hike Odds Have Barely Moved Even as Oil Fell 12%. Here Is Why That Gap Matters.
July 28, 2026
View chart & download
Brent was the only one of the three to finish above its starting level, while the index and gold both fell.
Brent, TSX and Gold Rebased to the August 31 Close
September 30, 2026
View chart & download
The Bank of Canada held its policy rate at 2.25% for a seventh straight time, yet Canadian yields rose as United States yields surged.
Government of Canada Benchmark Yields, September 2026
September 30, 2026
View chart & download