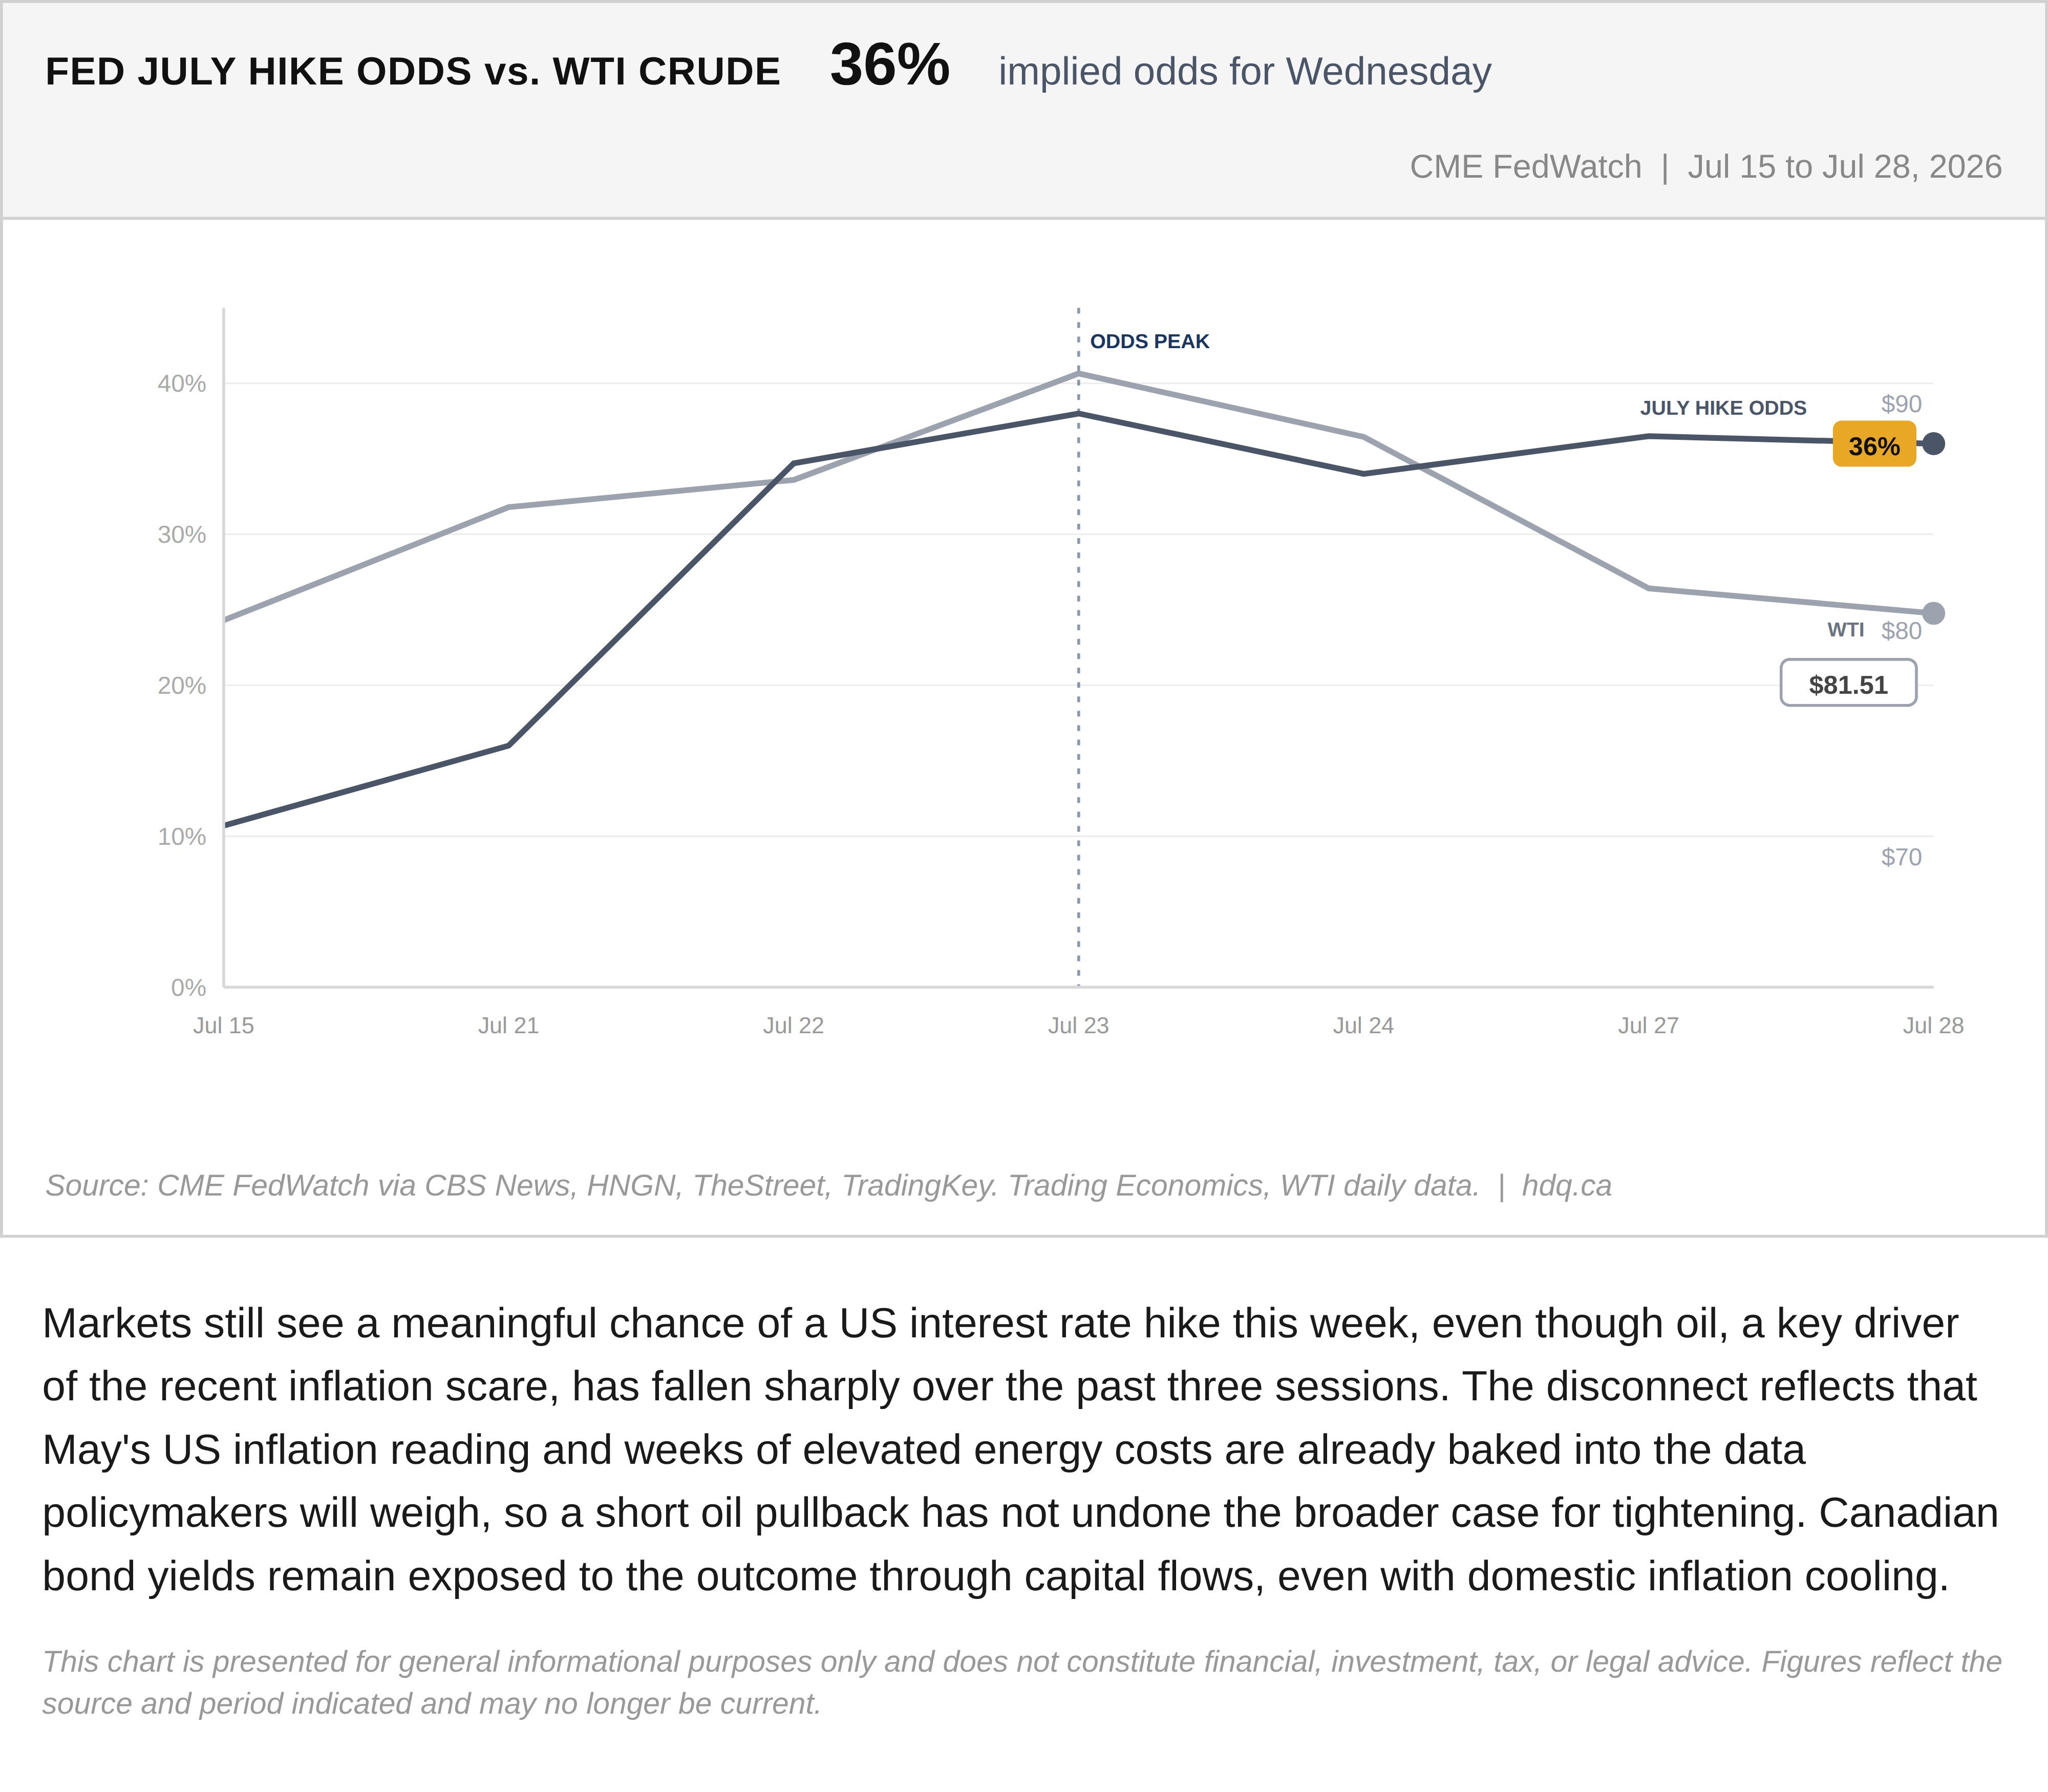
Markets still see a meaningful chance of a US interest rate hike this week, even though oil, a key driver of the recent inflation scare, has fallen sharply over the past three sessions. The disconnect reflects that May's US inflation reading and weeks of elevated energy costs are already baked into the data policymakers will weigh, so a short oil pullback has not undone the broader case for tightening. Canadian bond yields remain exposed to the outcome through capital flows, even with domestic inflation cooling.
This chart is presented for general informational purposes only and does not constitute financial, investment, tax, or legal advice. Figures reflect the source and period indicated and may no longer be current.

Related charts
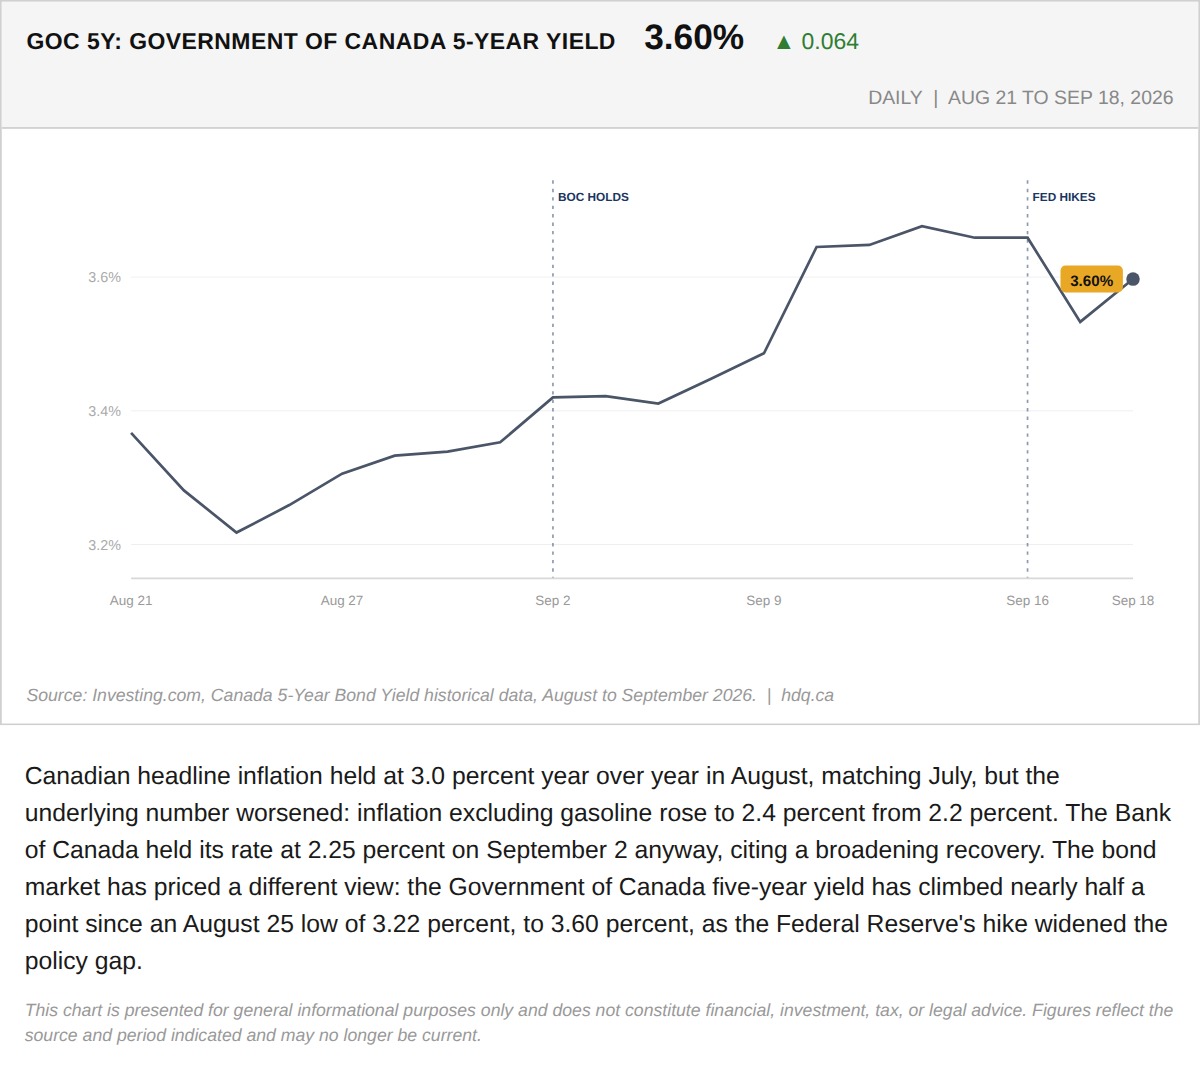
Canadian headline inflation held at 3.0 percent year over year in August, matching July, but the underlying number worsened: inflation…
The Bond Market Already Moved Before the Bank of Canada Has To
September 21, 2026
View chart & download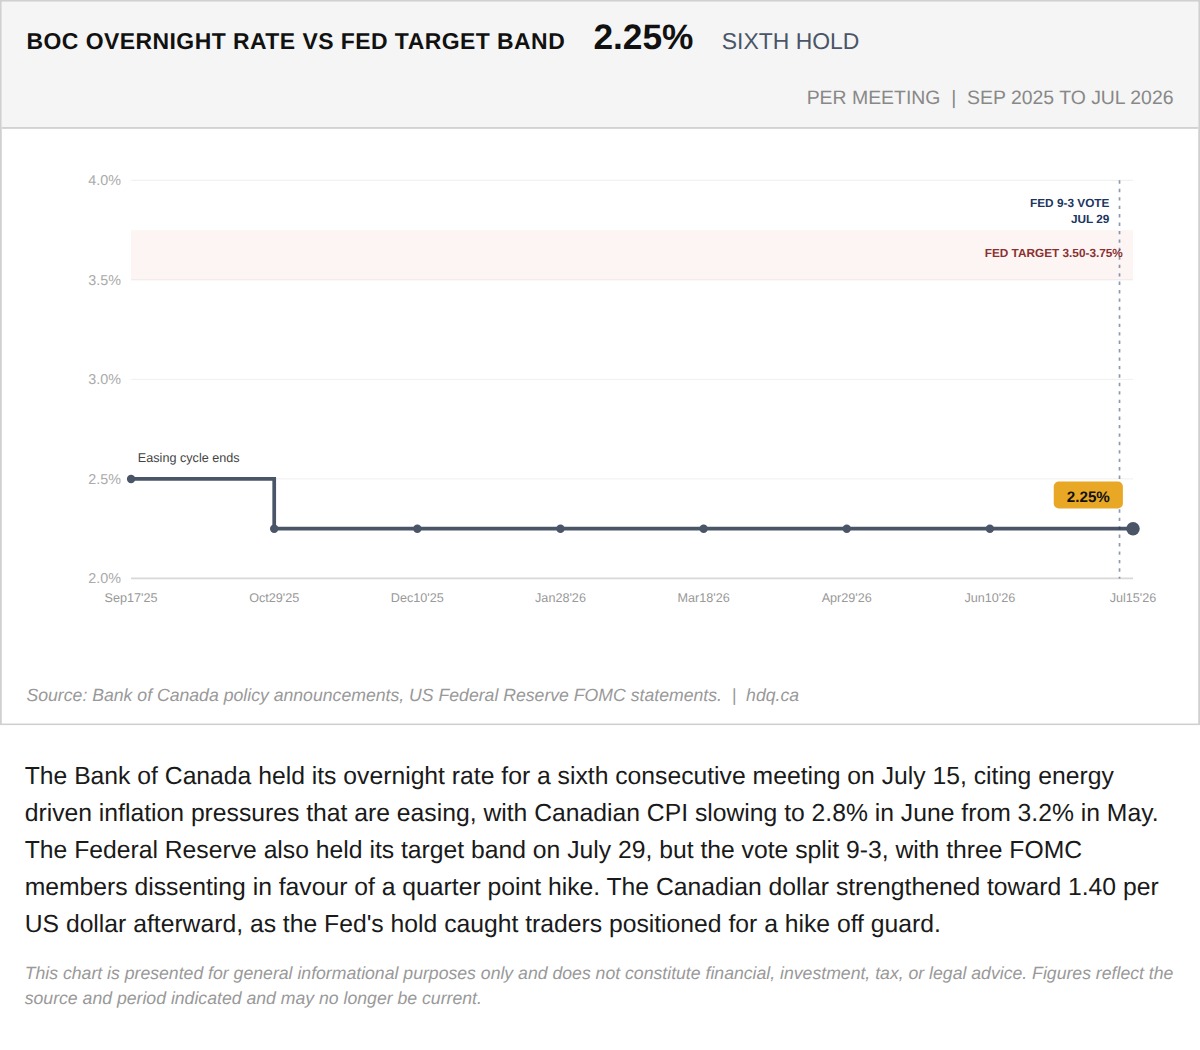
The Bank of Canada held its overnight rate for a sixth consecutive meeting on July 15, citing energy driven inflation pressures that are…
The Bank of Canada Held at 2.25% for a Sixth Meeting. The Fed Held Too, but Three Votes Said No.
July 31, 2026
View chart & download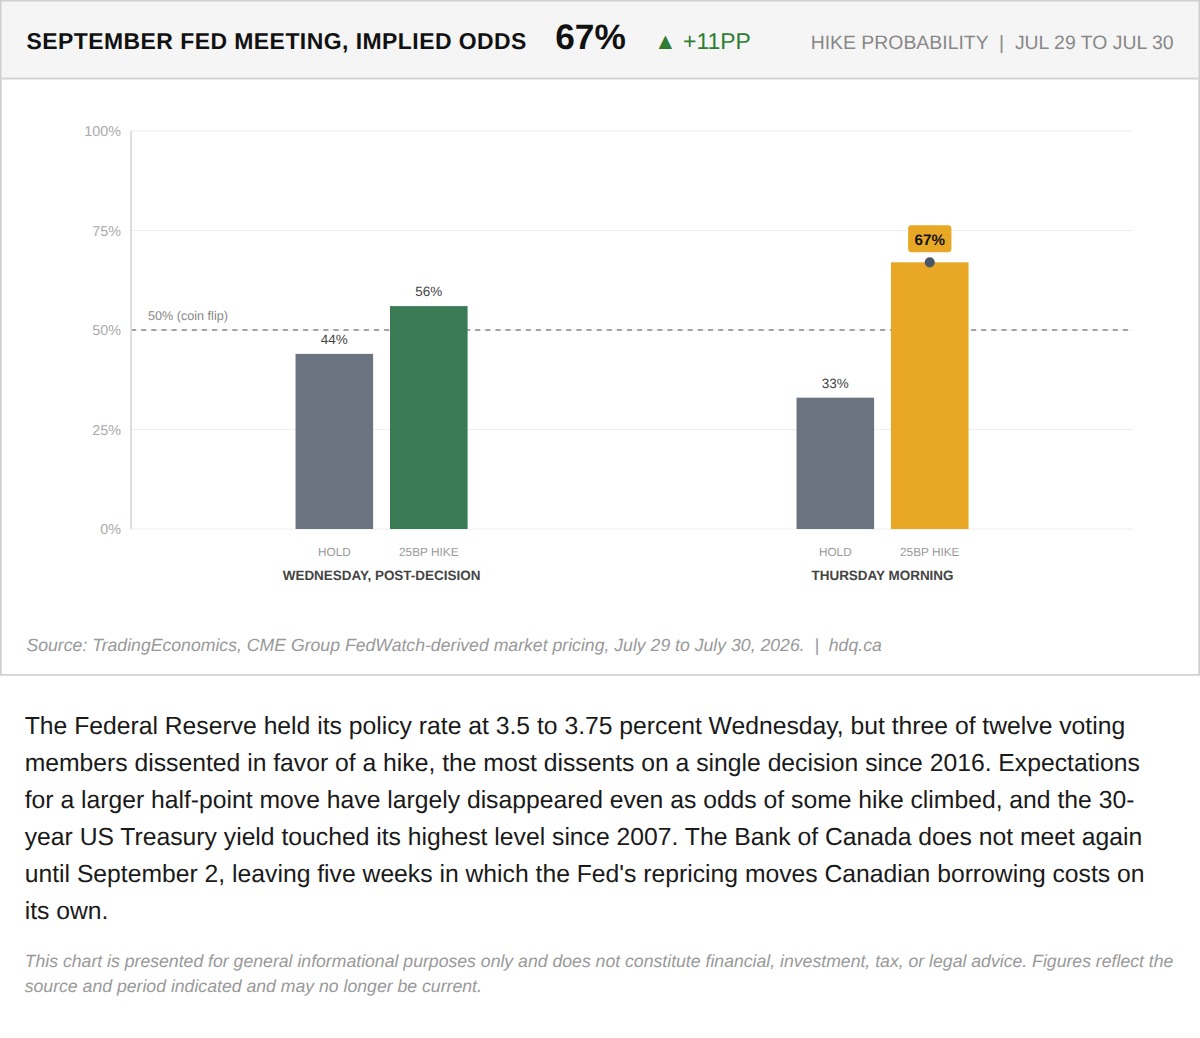
The Federal Reserve held its policy rate at 3.5 to 3.75 percent Wednesday, but three of twelve voting members dissented in favor of a hike,…
The Fed Held Rates Steady. Markets Just Priced In an Eleven Point Jump in September's Odds.
July 30, 2026
View chart & download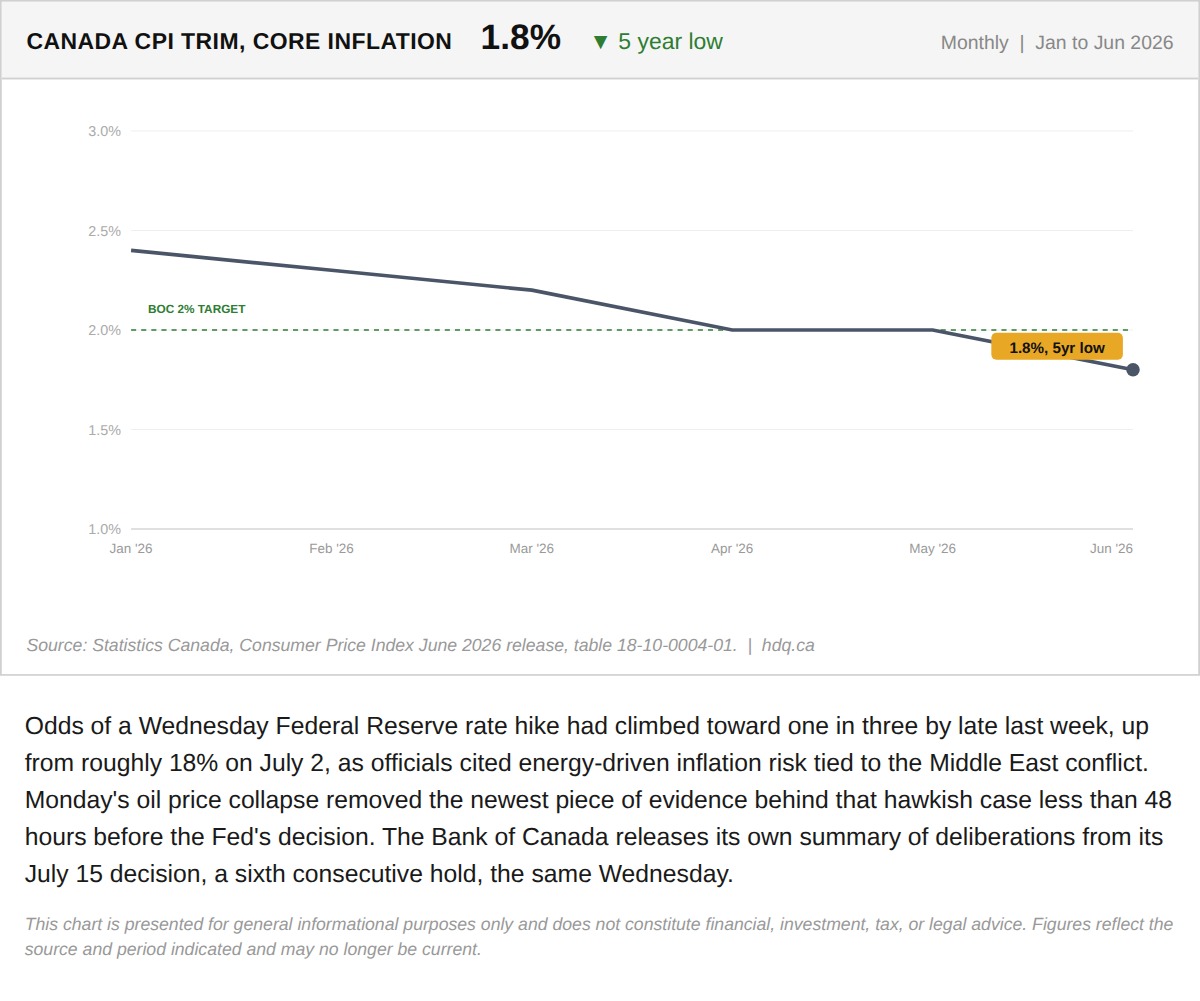
Odds of a Wednesday Federal Reserve rate hike had climbed toward one in three by late last week, up from roughly 18% on July 2, as…
Canada's Core Inflation Falls to a Five-Year Low
July 27, 2026
View chart & download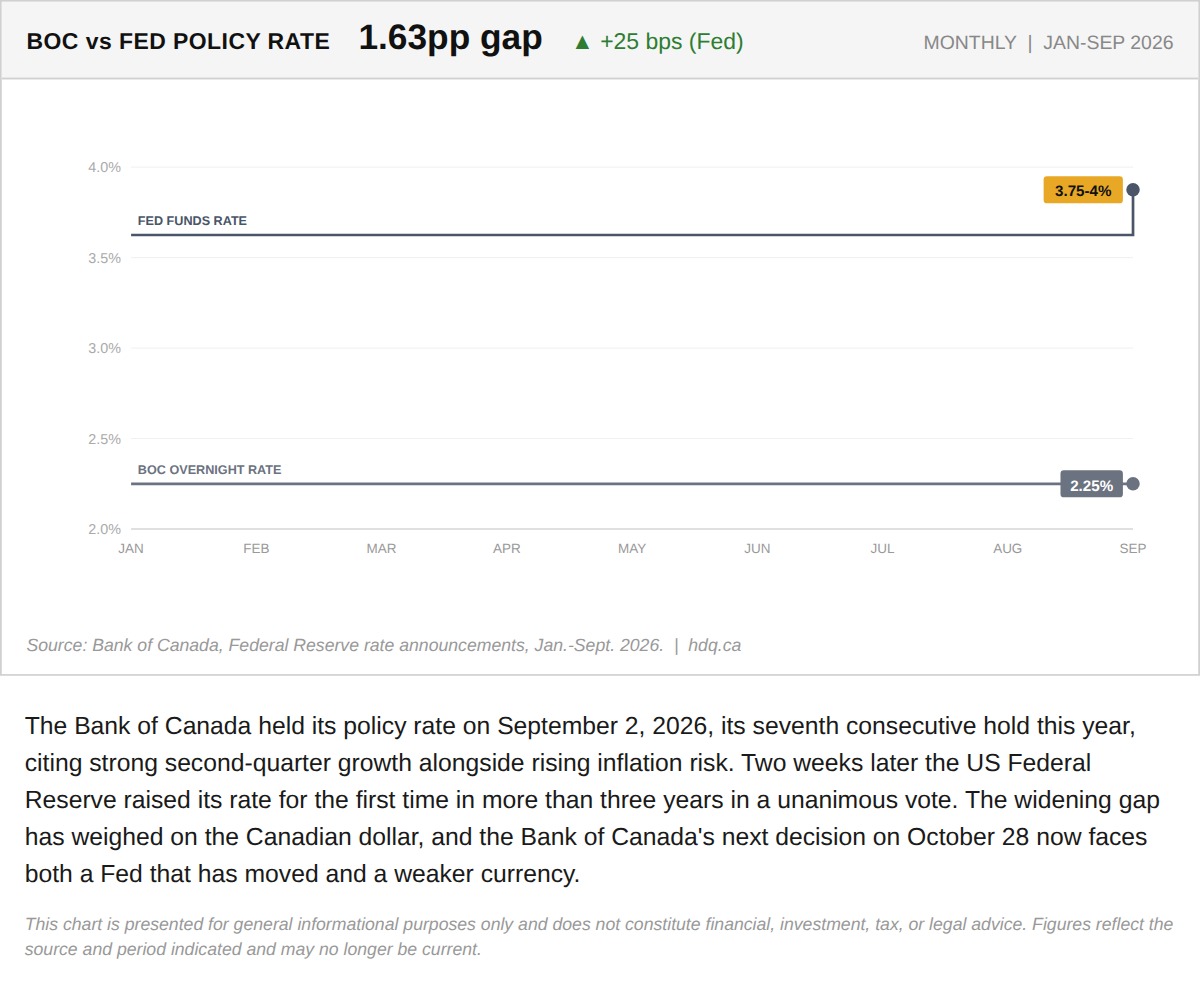
The Bank of Canada held its policy rate on September 2, 2026, its seventh consecutive hold this year, citing strong second-quarter growth alongside rising inflation risk.
The Bank of Canada Has Held Seven Times This Year. The Fed Just Broke Its Own Pattern.
September 23, 2026
View chart & download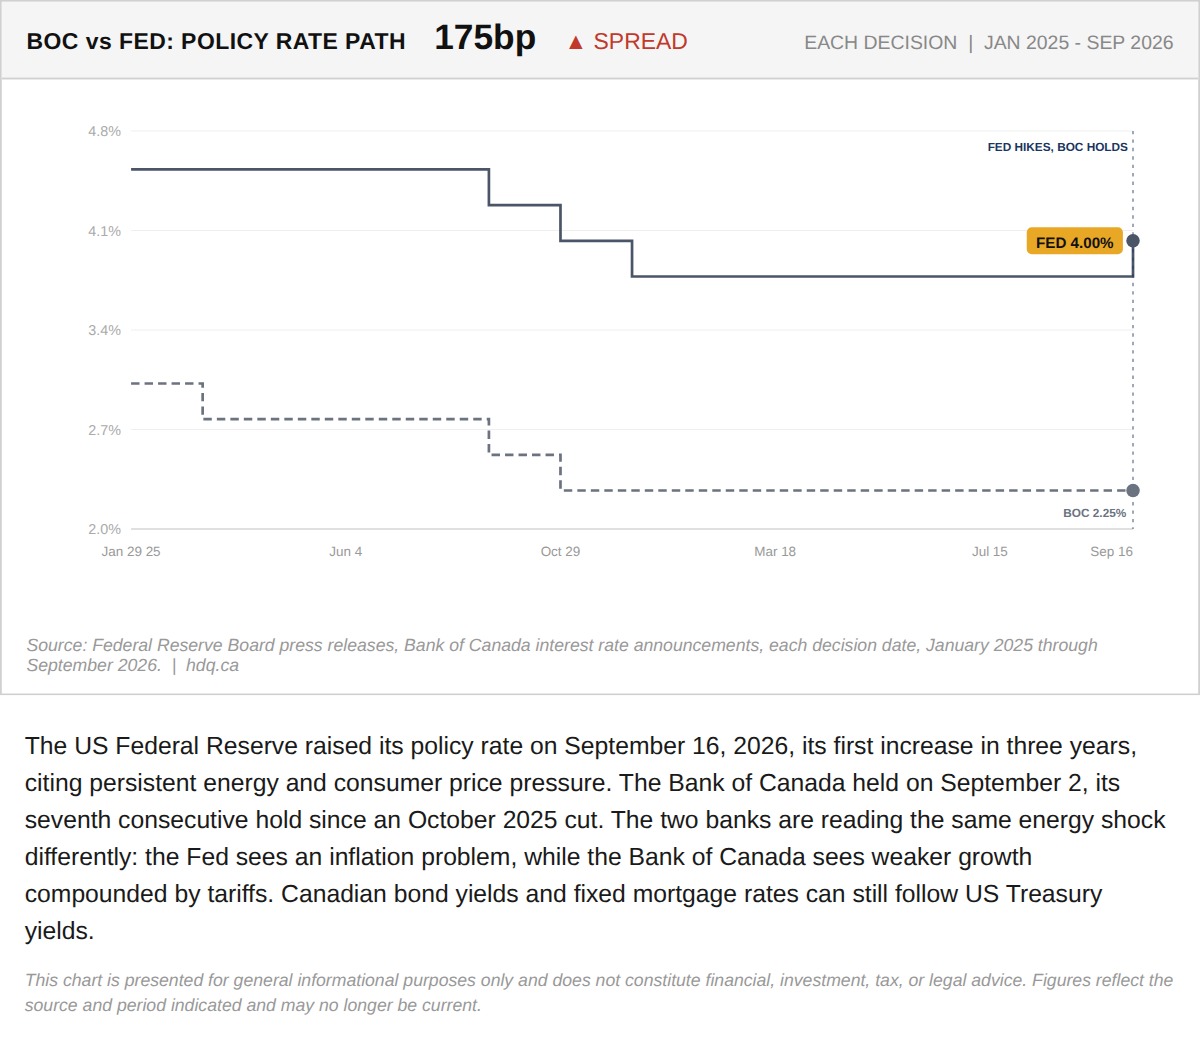
The US Federal Reserve raised its policy rate on September 16, 2026, its first increase in three years, citing persistent energy and consumer price pressure.
Why the Fed Just Broke Rank With the Bank of Canada
September 22, 2026
View chart & download