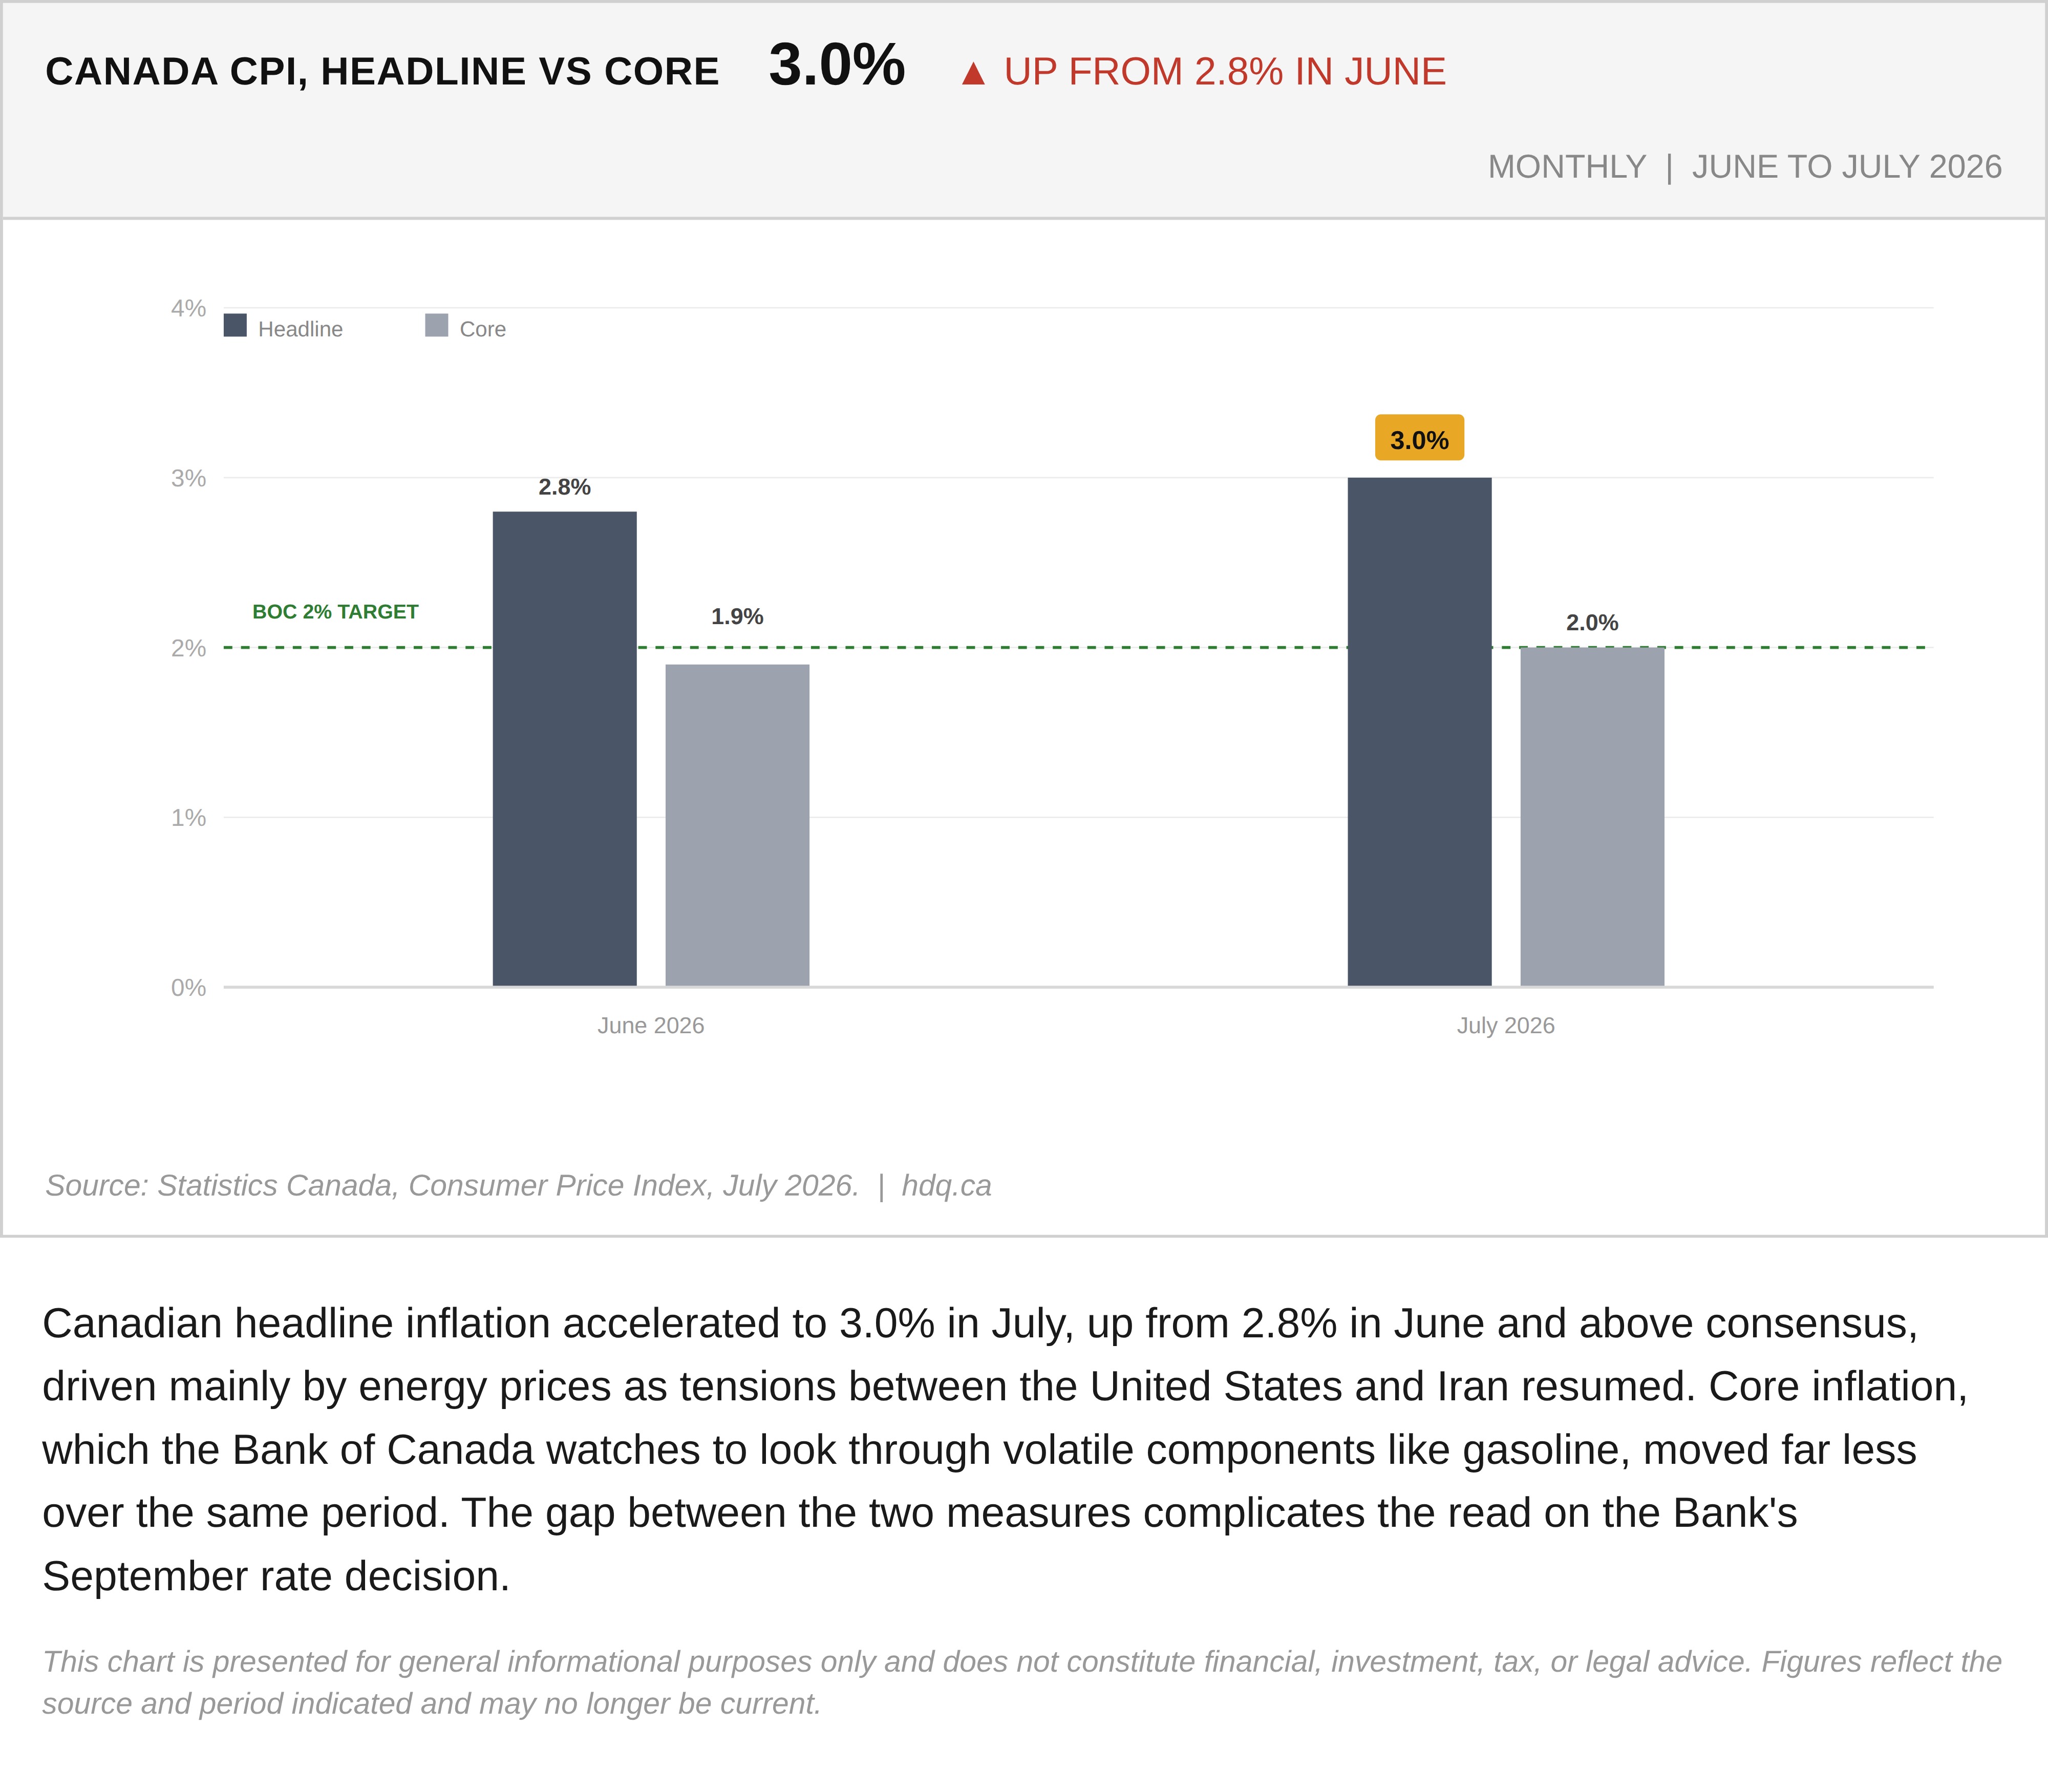
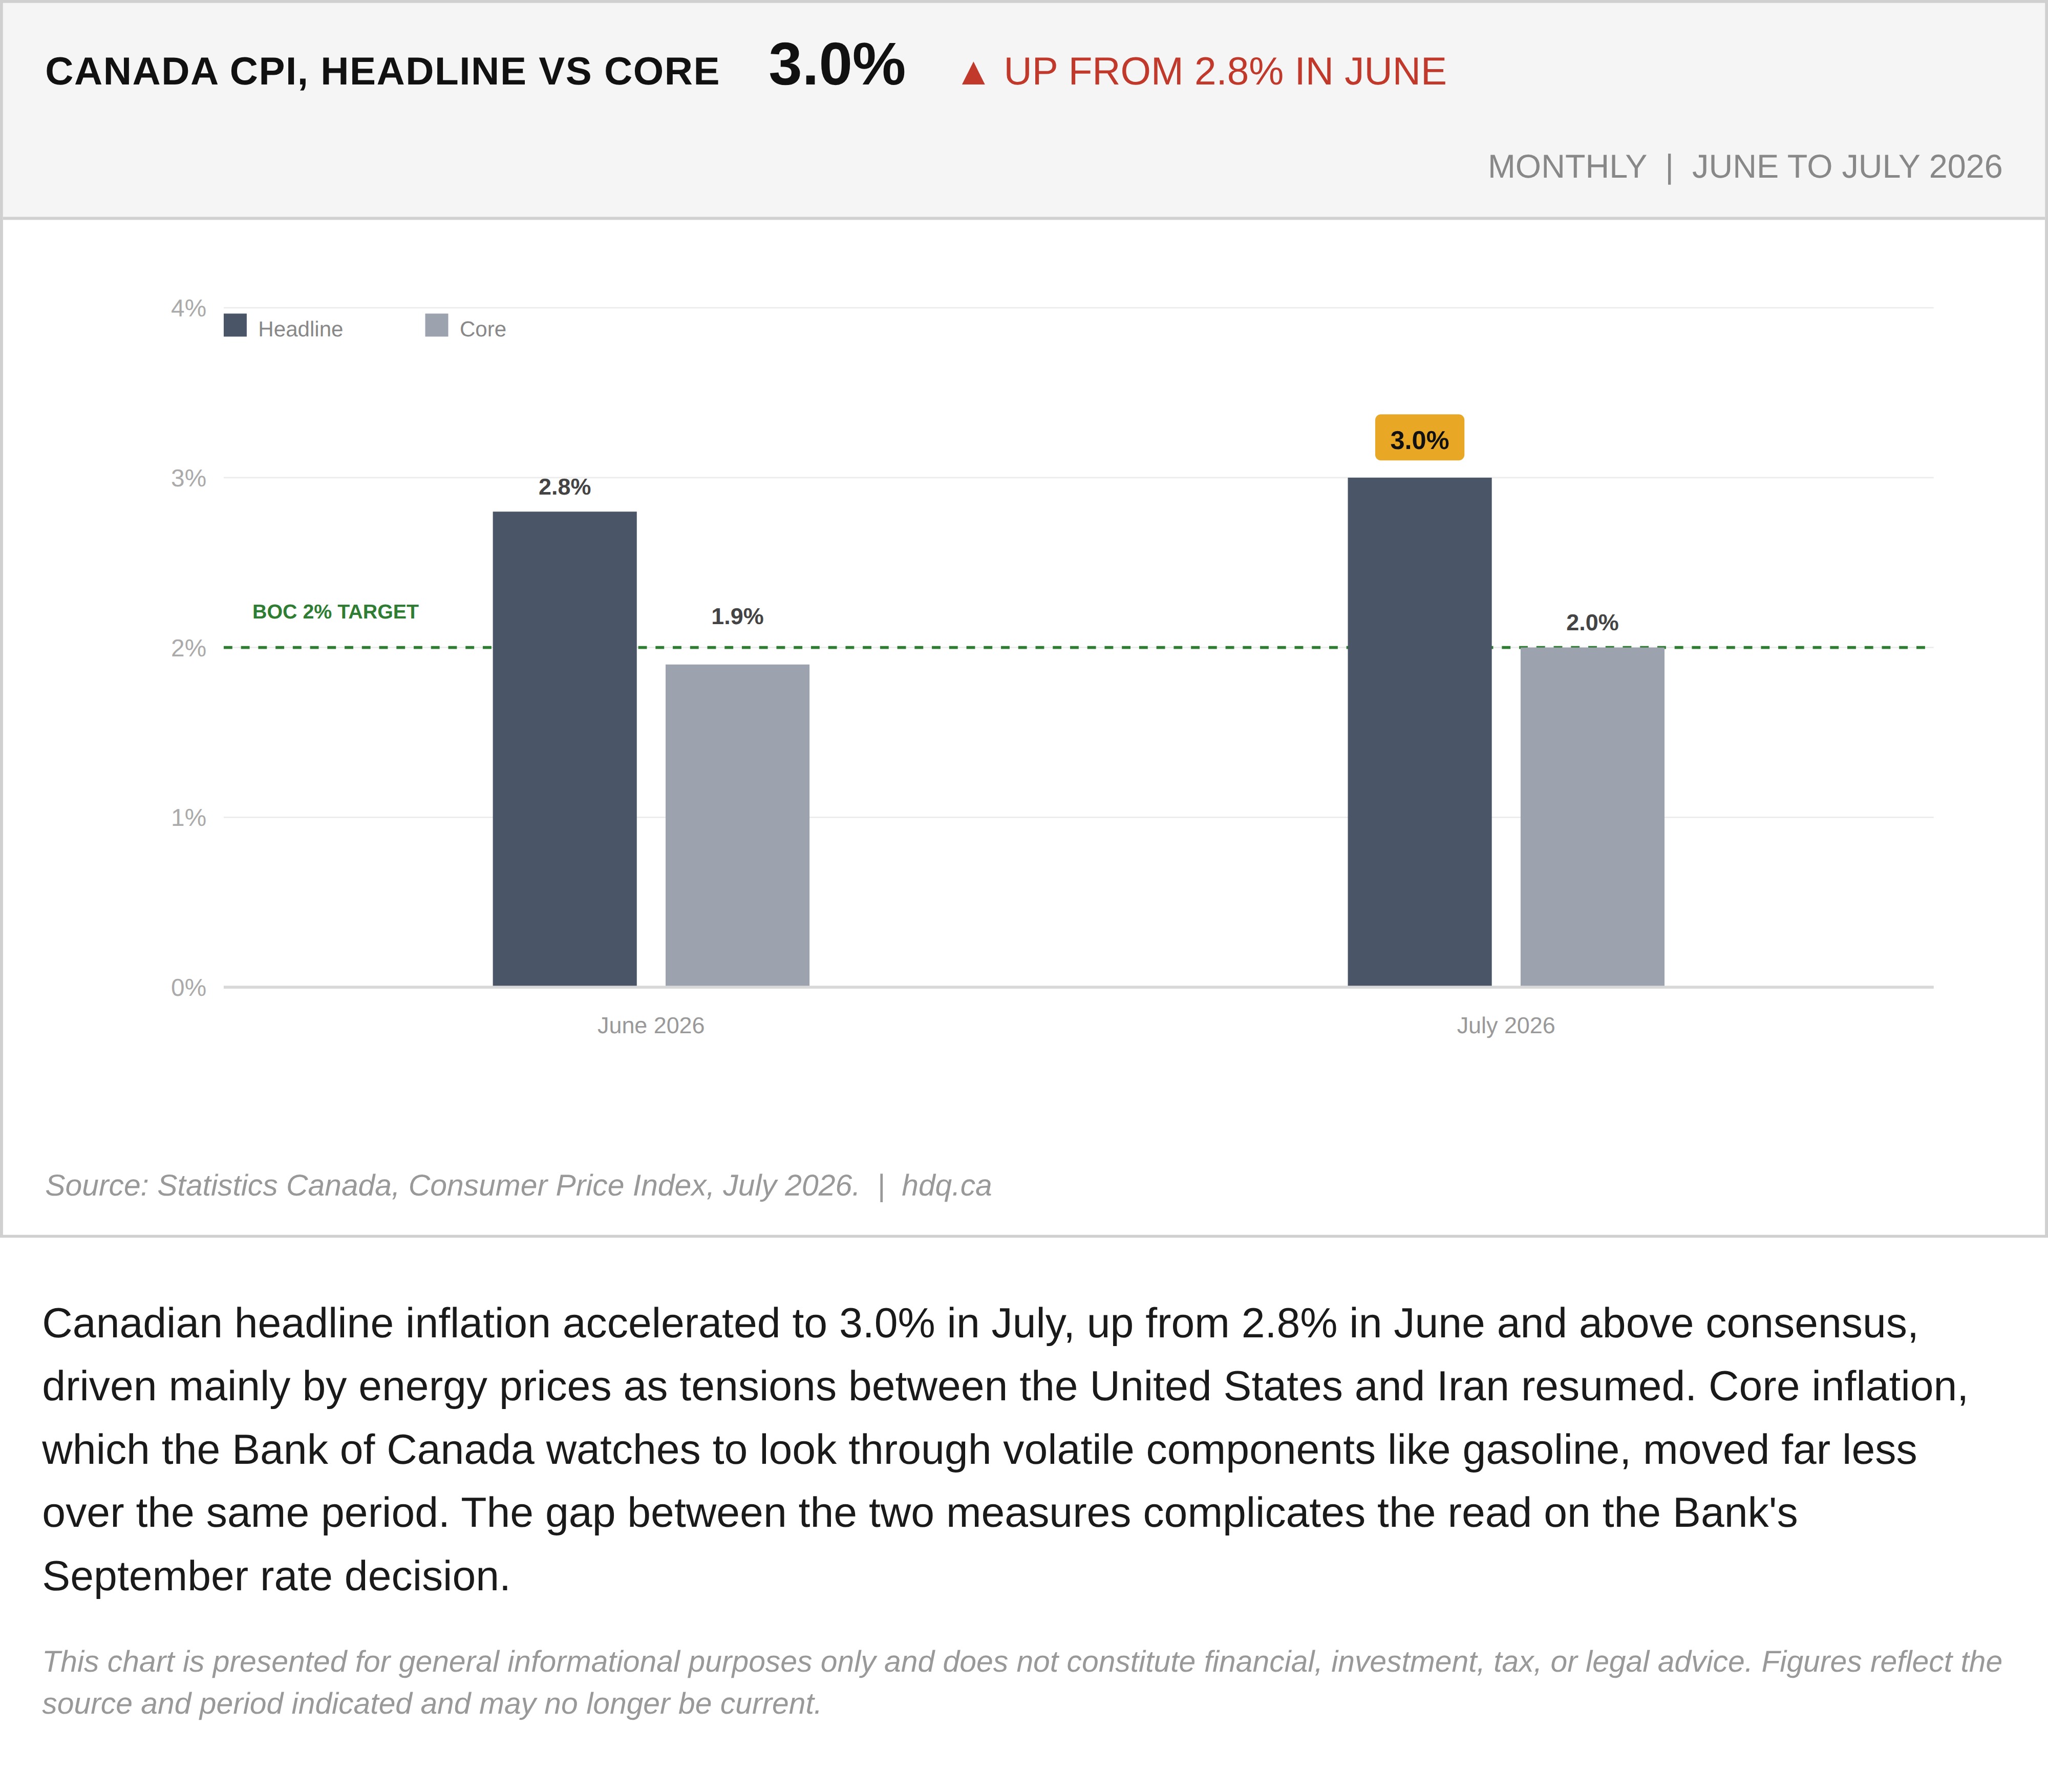
Canadian headline inflation accelerated to 3.0% in July, up from 2.8% in June and above consensus, driven mainly by energy prices as tensions between the United States and Iran resumed. Core inflation, which the Bank of Canada watches to look through volatile components like gasoline, moved far less over the same period. The gap between the two measures complicates the read on the Bank's September rate decision.
This chart is presented for general informational purposes only and does not constitute financial, investment, tax, or legal advice. Figures reflect the source and period indicated and may no longer be current.
Related charts
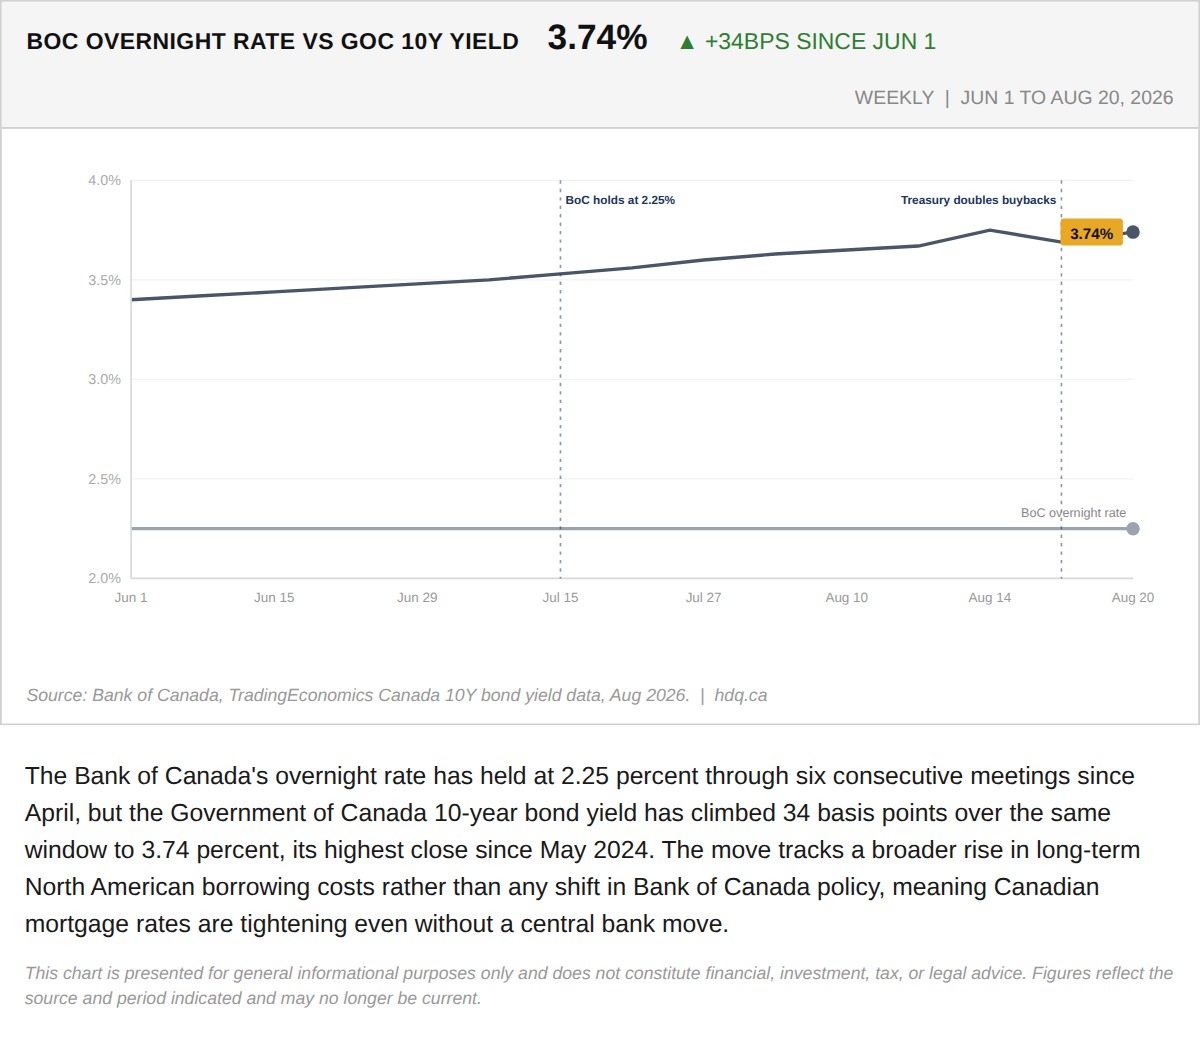
The Bank of Canada's overnight rate has held at 2.25 percent through six consecutive meetings since April, but the Government of Canada…
Government of Canada 10-Year Yield Climbs 34bps While BoC Rate Stays Put
August 21, 2026
View chart & download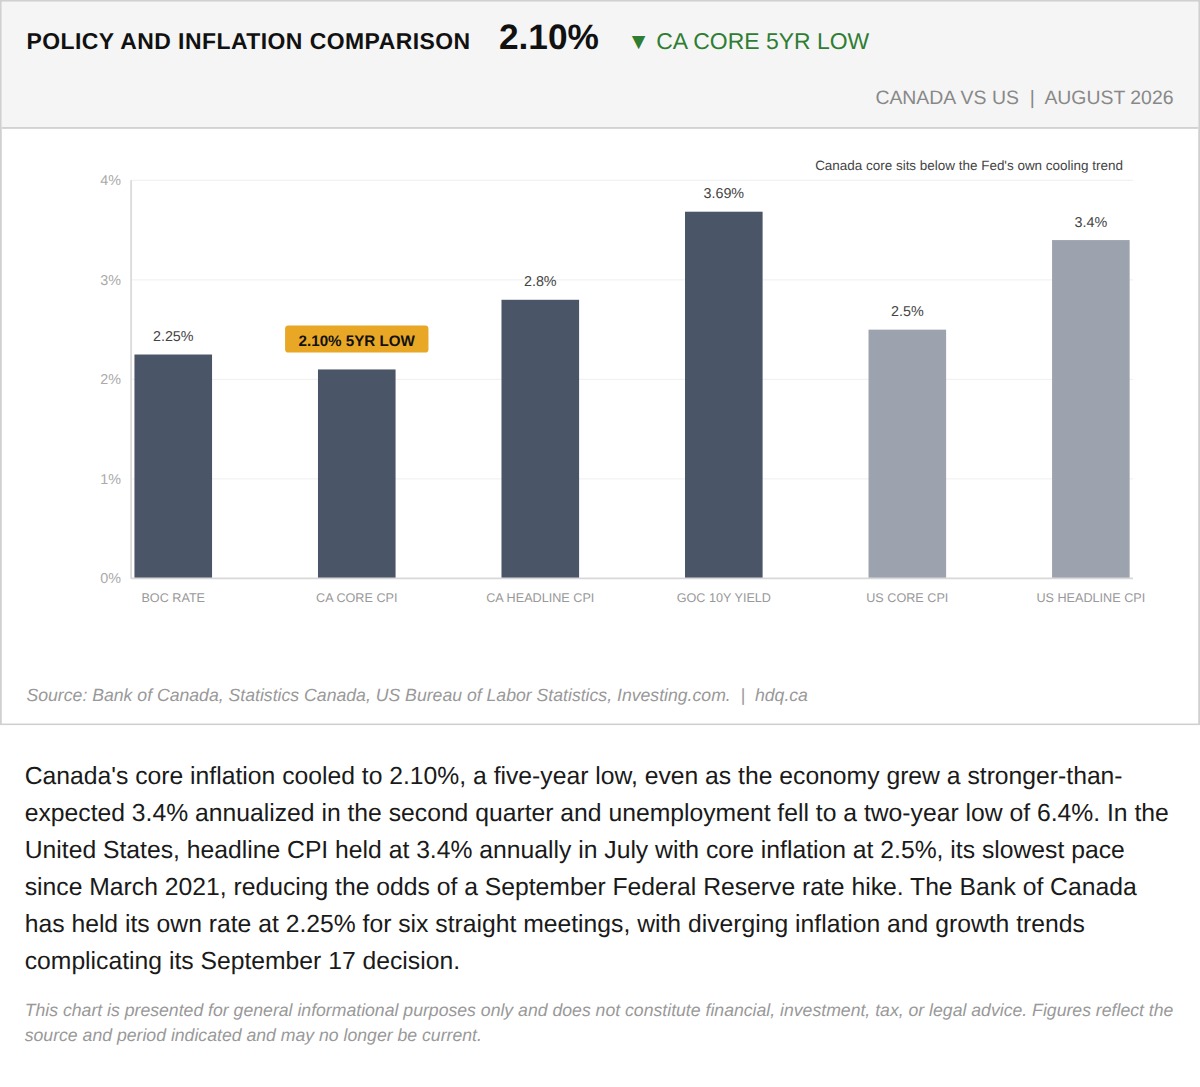
Canada's core inflation cooled to 2.10%, a five-year low, even as the economy grew a stronger-than-expected 3.4% annualized in the second…
Canada's Economy Is Outrunning the Bank of Canada's Own Forecast
August 13, 2026
View chart & download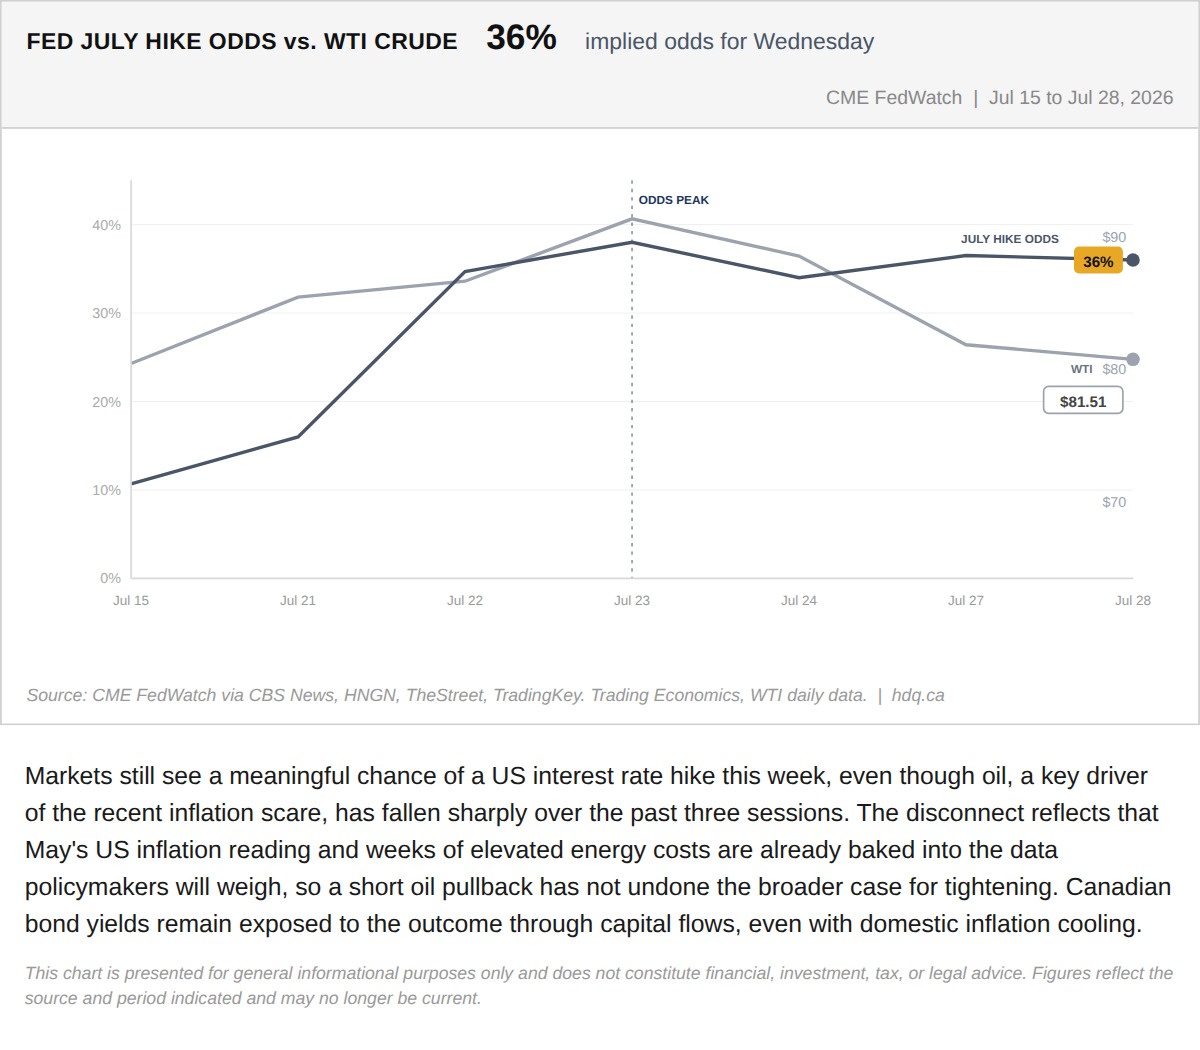
Markets still see a meaningful chance of a US interest rate hike this week, even though oil, a key driver of the recent inflation scare,…
Fed Hike Odds Have Barely Moved Even as Oil Fell 12%. Here Is Why That Gap Matters.
July 28, 2026
View chart & download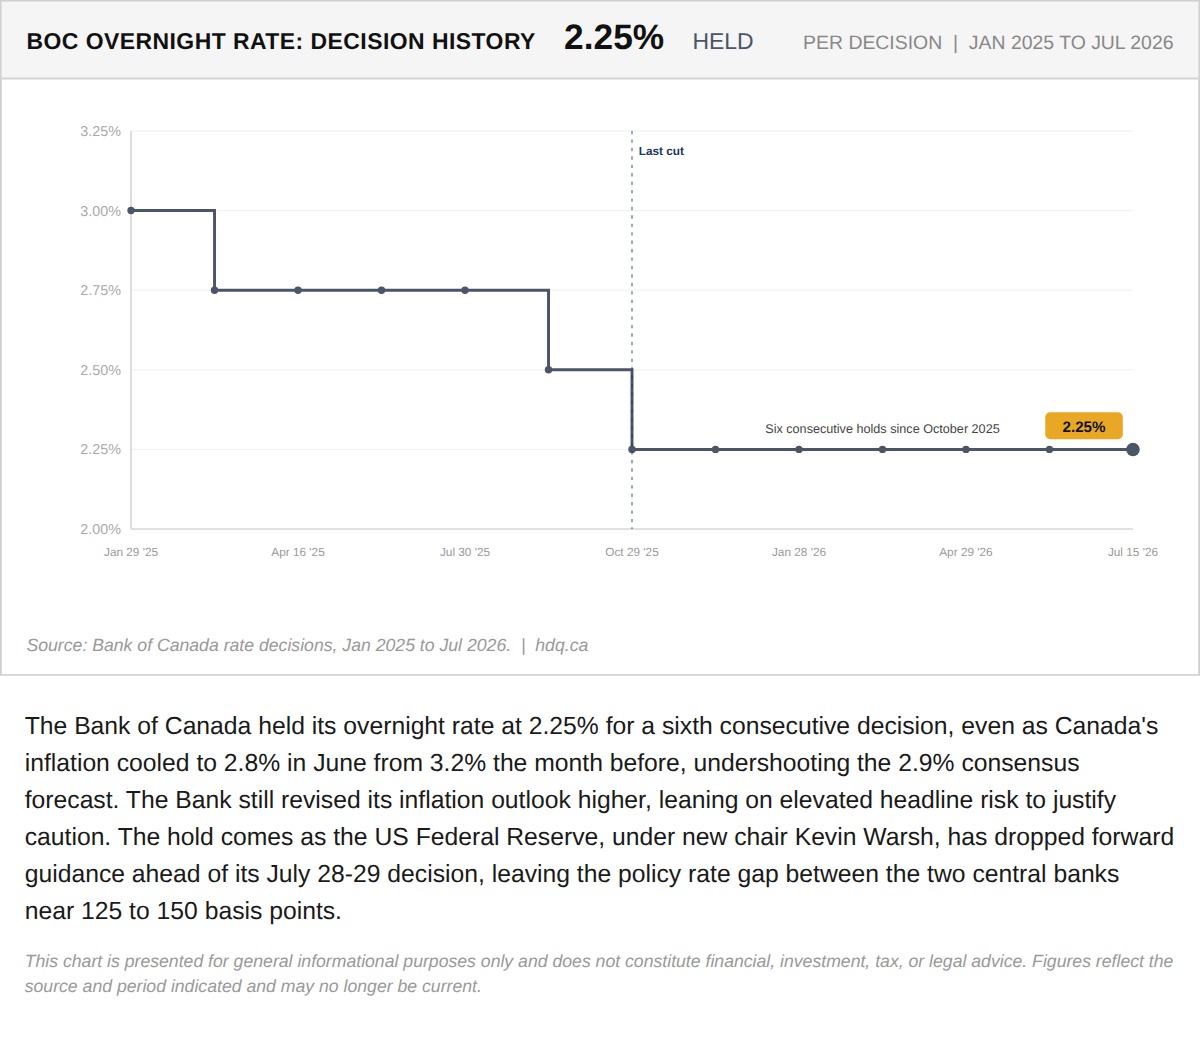
The Bank of Canada held its overnight rate at 2.25% for a sixth consecutive decision, even as Canada's inflation cooled to 2.8% in June…
Canada's Inflation Cooled to 2.8%. The Bank of Canada Got More Hawkish Anyway.
July 22, 2026
View chart & download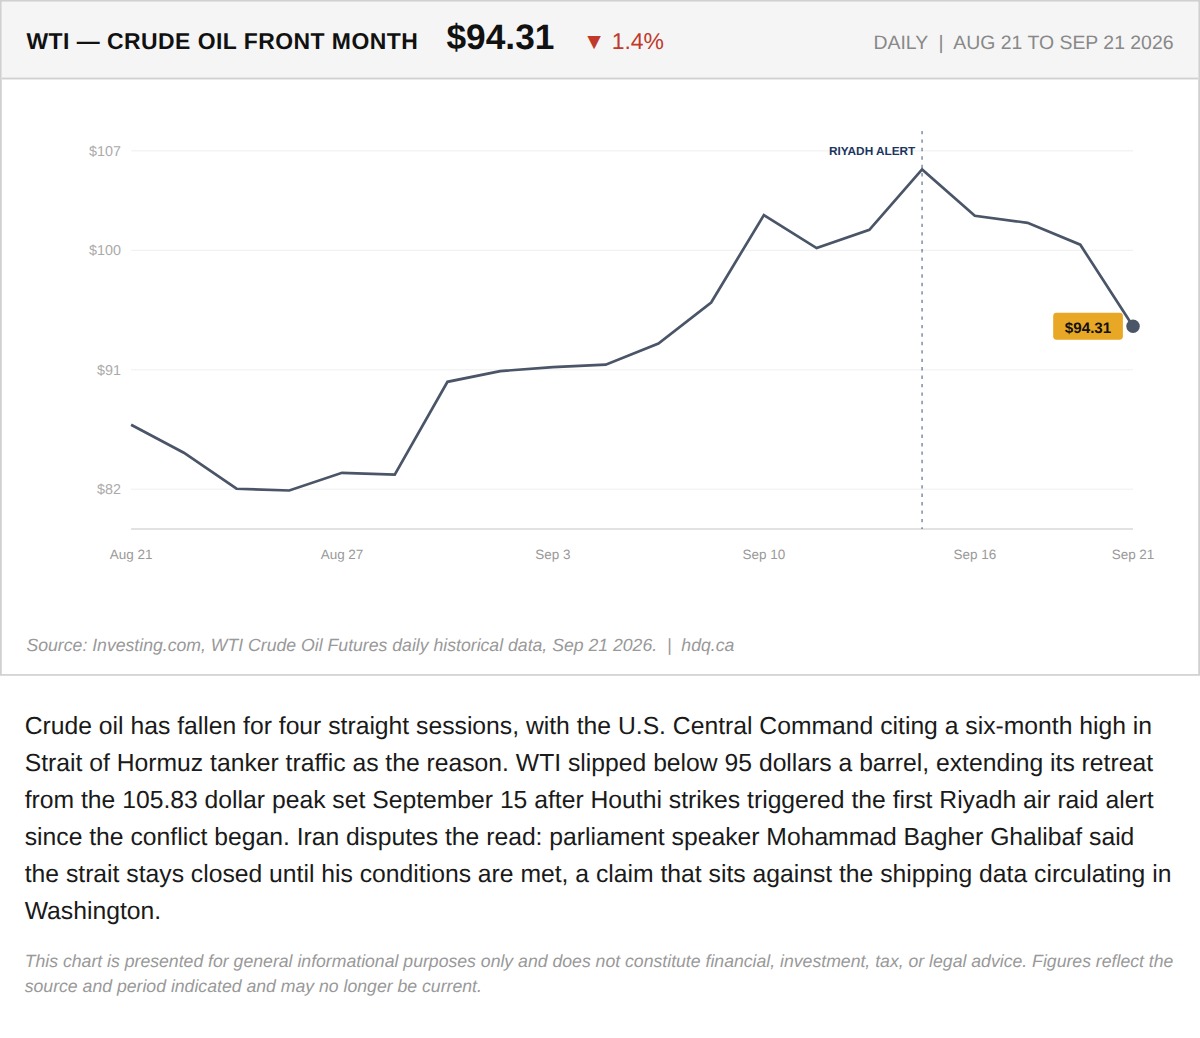
Crude oil has fallen for four straight sessions, with the U.S.
Oil Falls for a Fourth Session as Hormuz Shipping Data Is Disputed
September 21, 2026
View chart & download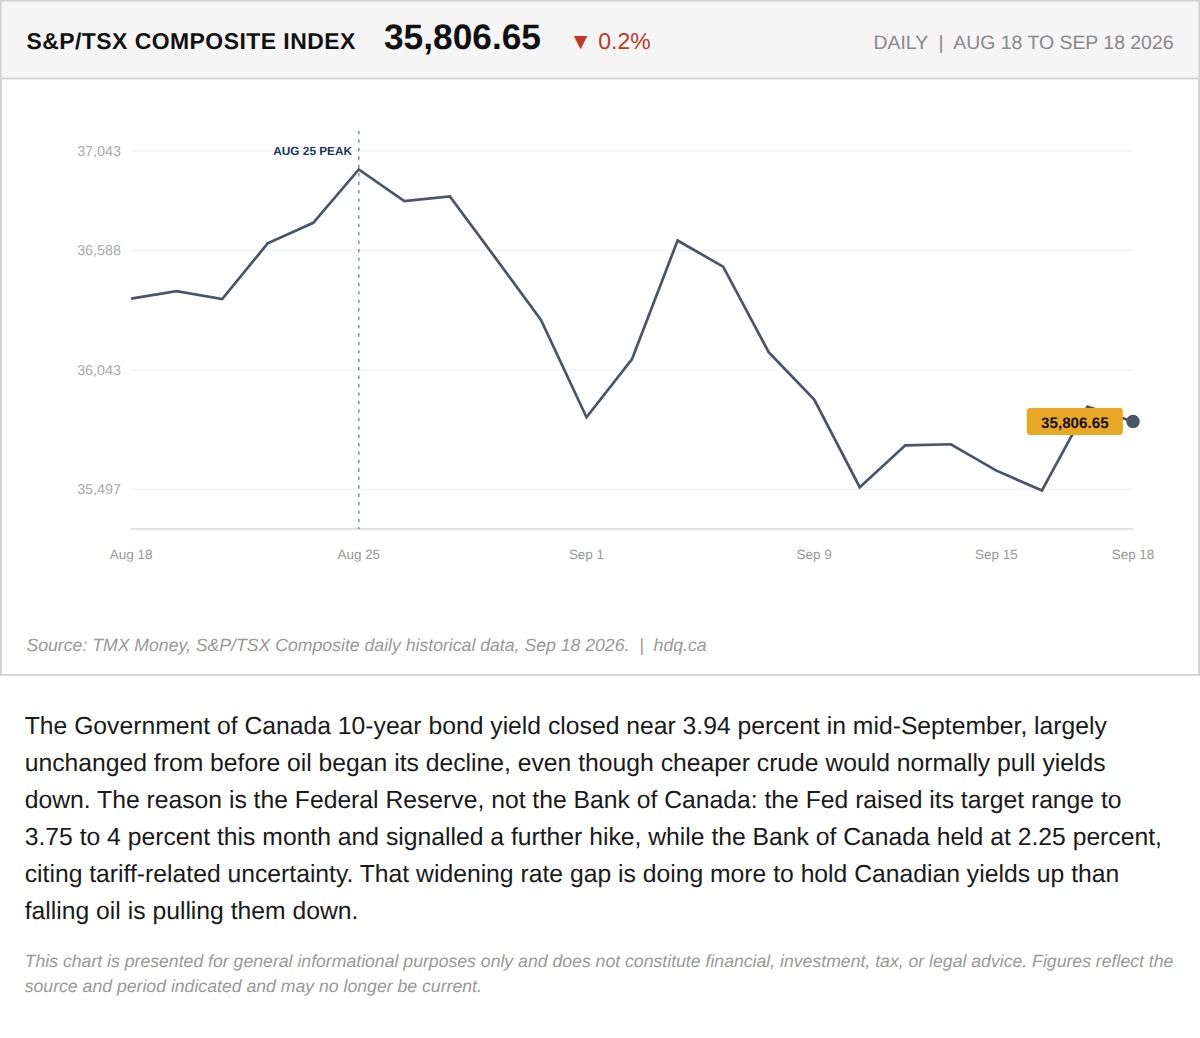
The Government of Canada 10-year bond yield closed near 3.94 percent in mid-September, largely unchanged from before oil began its decline,…
TSX Slides as Canadian Bond Yields Stay Elevated Despite Falling Oil
September 21, 2026
View chart & download