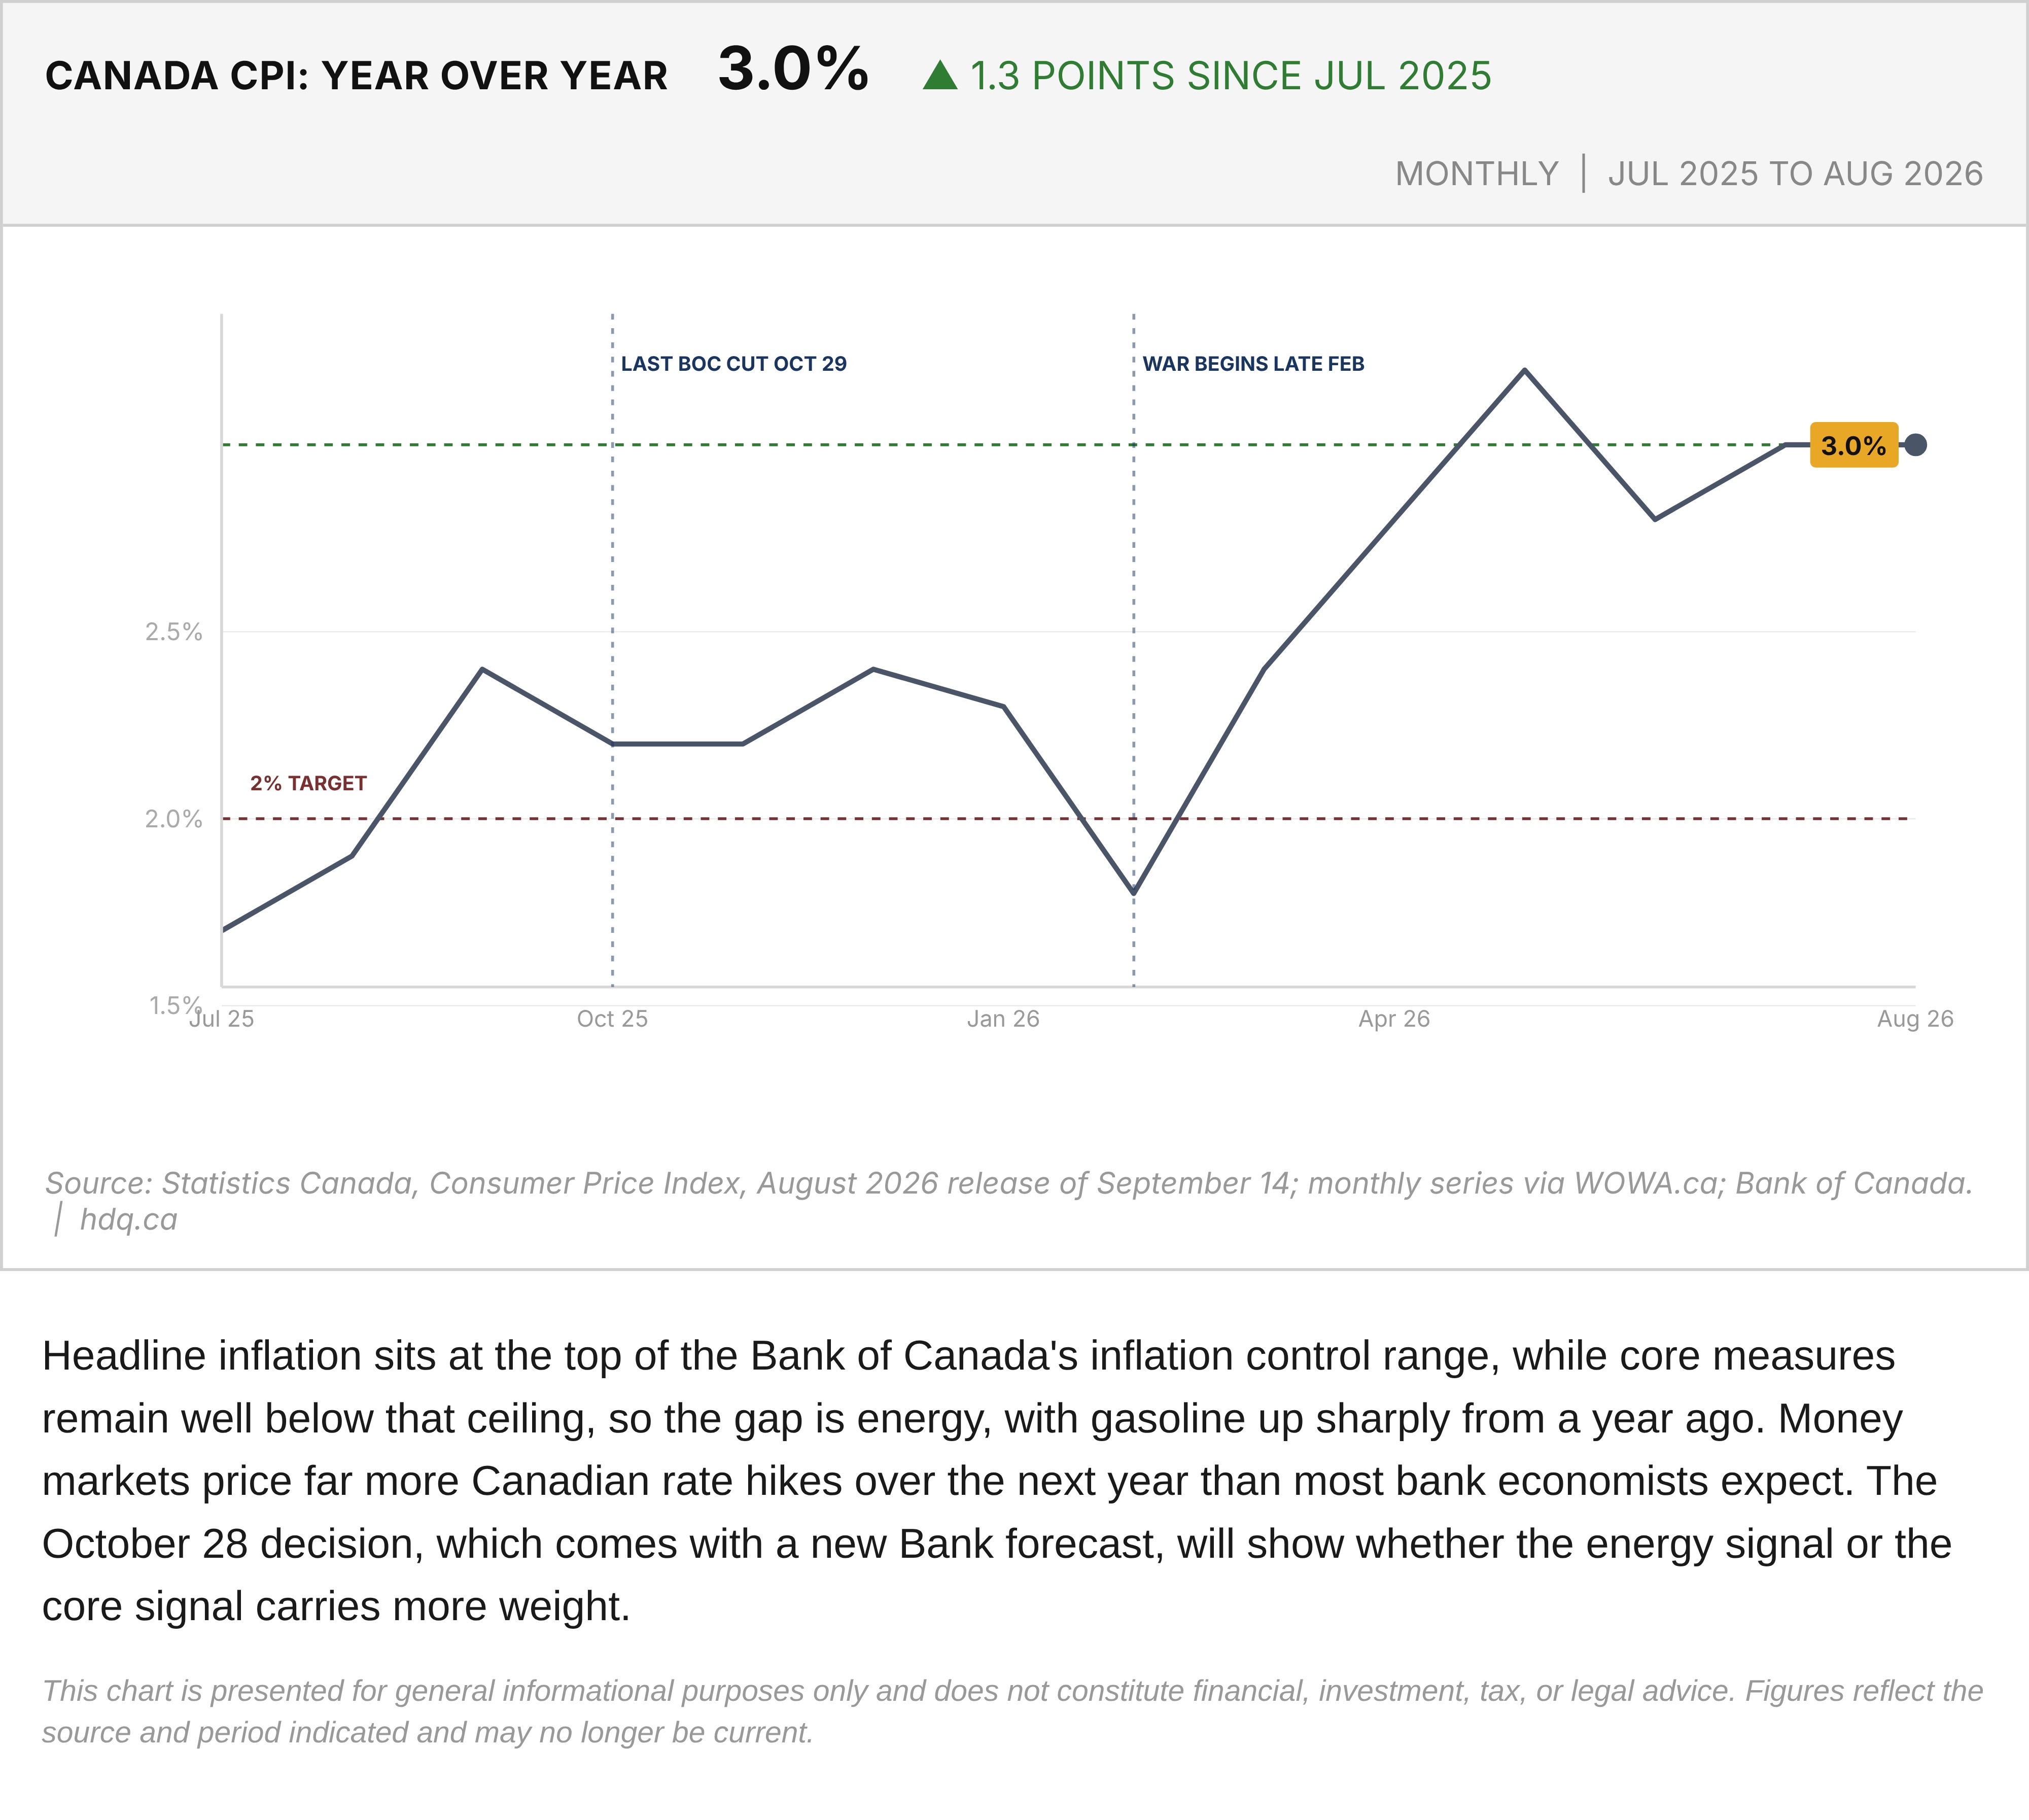
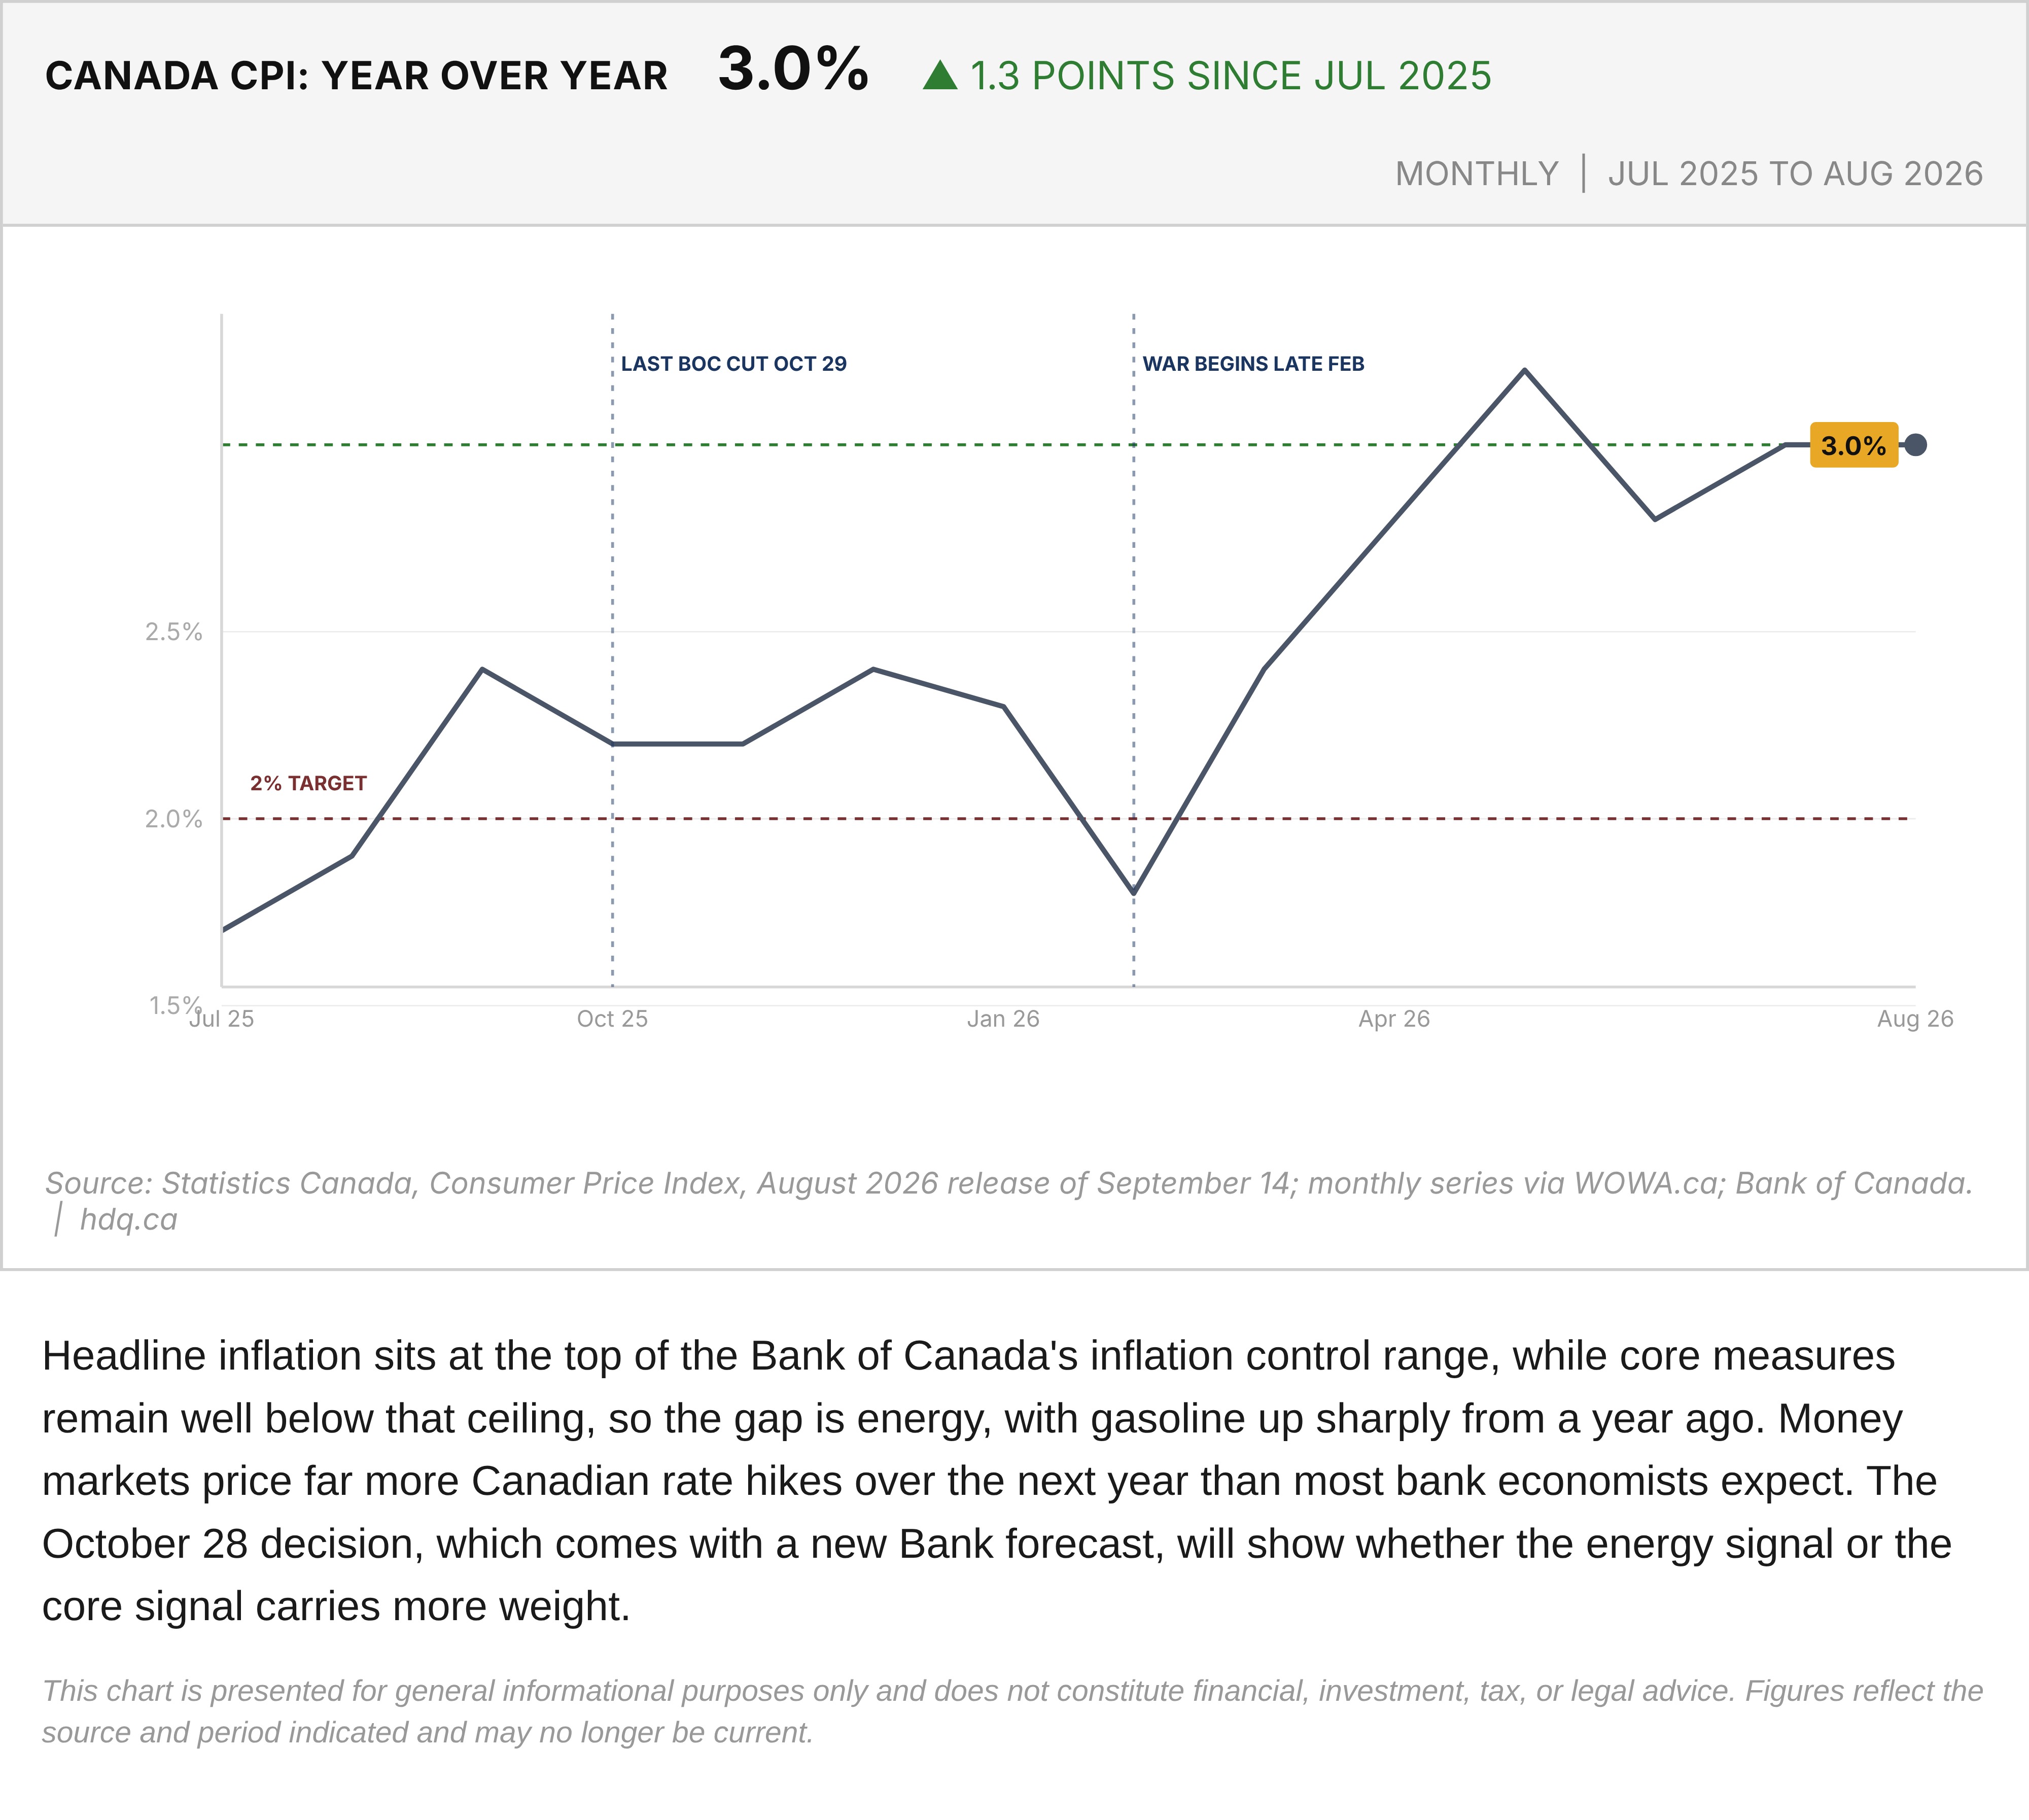
Headline inflation sits at the top of the Bank of Canada's inflation control range, while core measures remain well below that ceiling, so the gap is energy, with gasoline up sharply from a year ago. Money markets price far more Canadian rate hikes over the next year than most bank economists expect. The October 28 decision, which comes with a new Bank forecast, will show whether the energy signal or the core signal carries more weight.
This chart is presented for general informational purposes only and does not constitute financial, investment, tax, or legal advice. Figures reflect the source and period indicated and may no longer be current.
Related charts
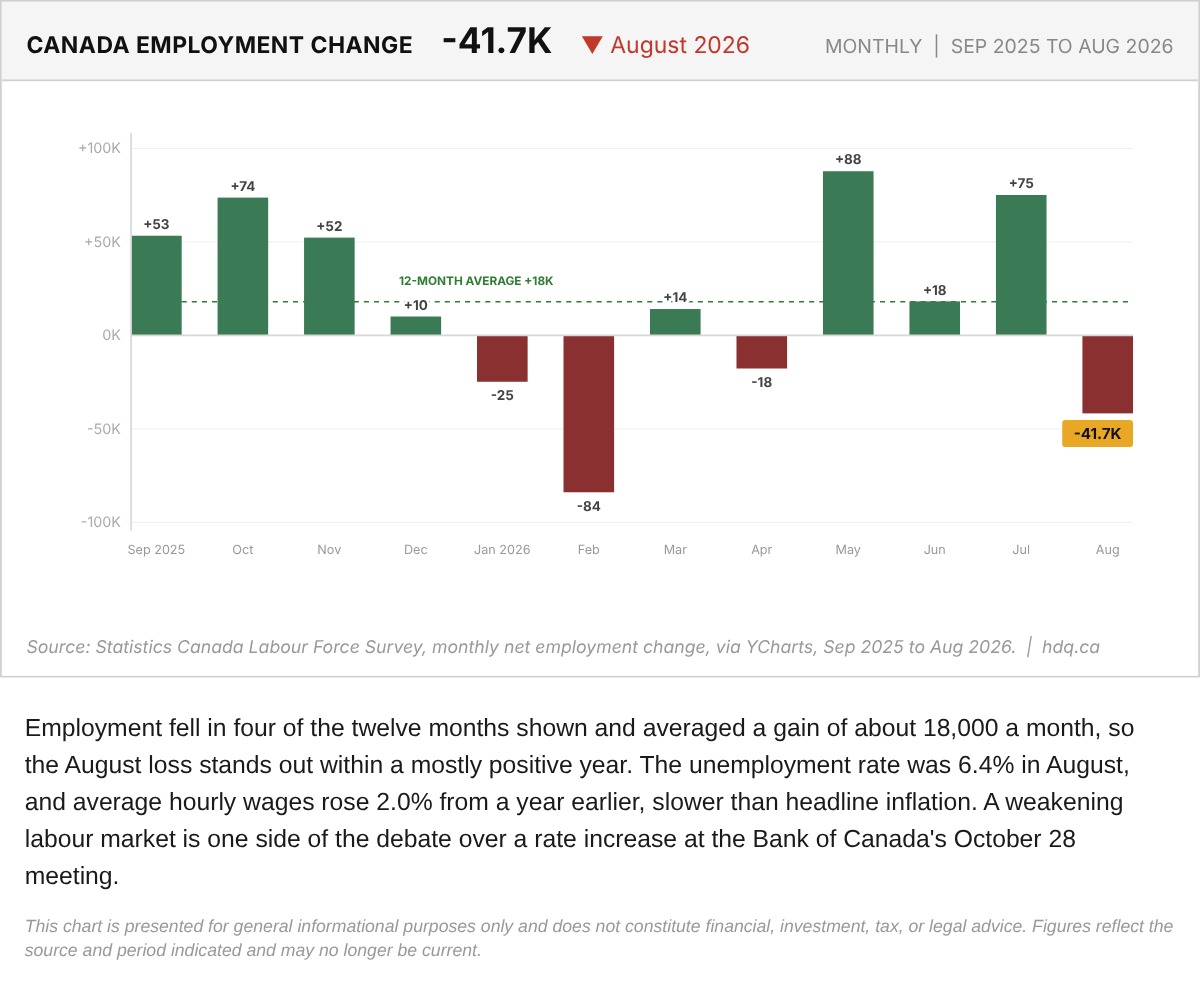
Employment fell in four of the twelve months shown and averaged a gain of about 18,000 a month, so the August loss stands out within a mostly positive year.
Canada Monthly Net Employment Change, September 2025 to August 2026
October 6, 2026
View chart & download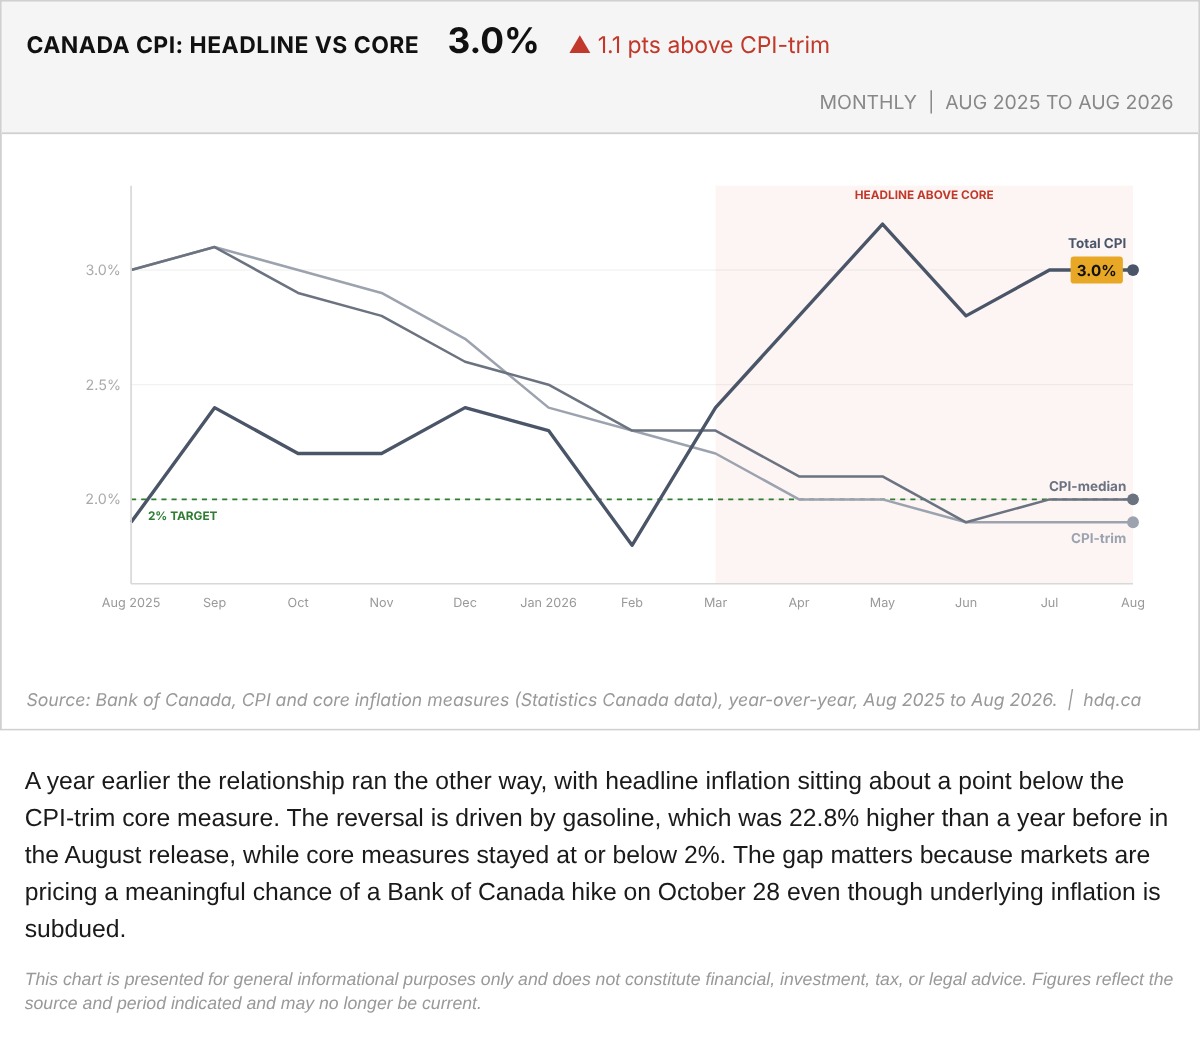
A year earlier the relationship ran the other way, with headline inflation sitting about a point below the CPI-trim core measure.
Canada Headline CPI Against Bank of Canada Core Measures, August 2026
October 6, 2026
View chart & download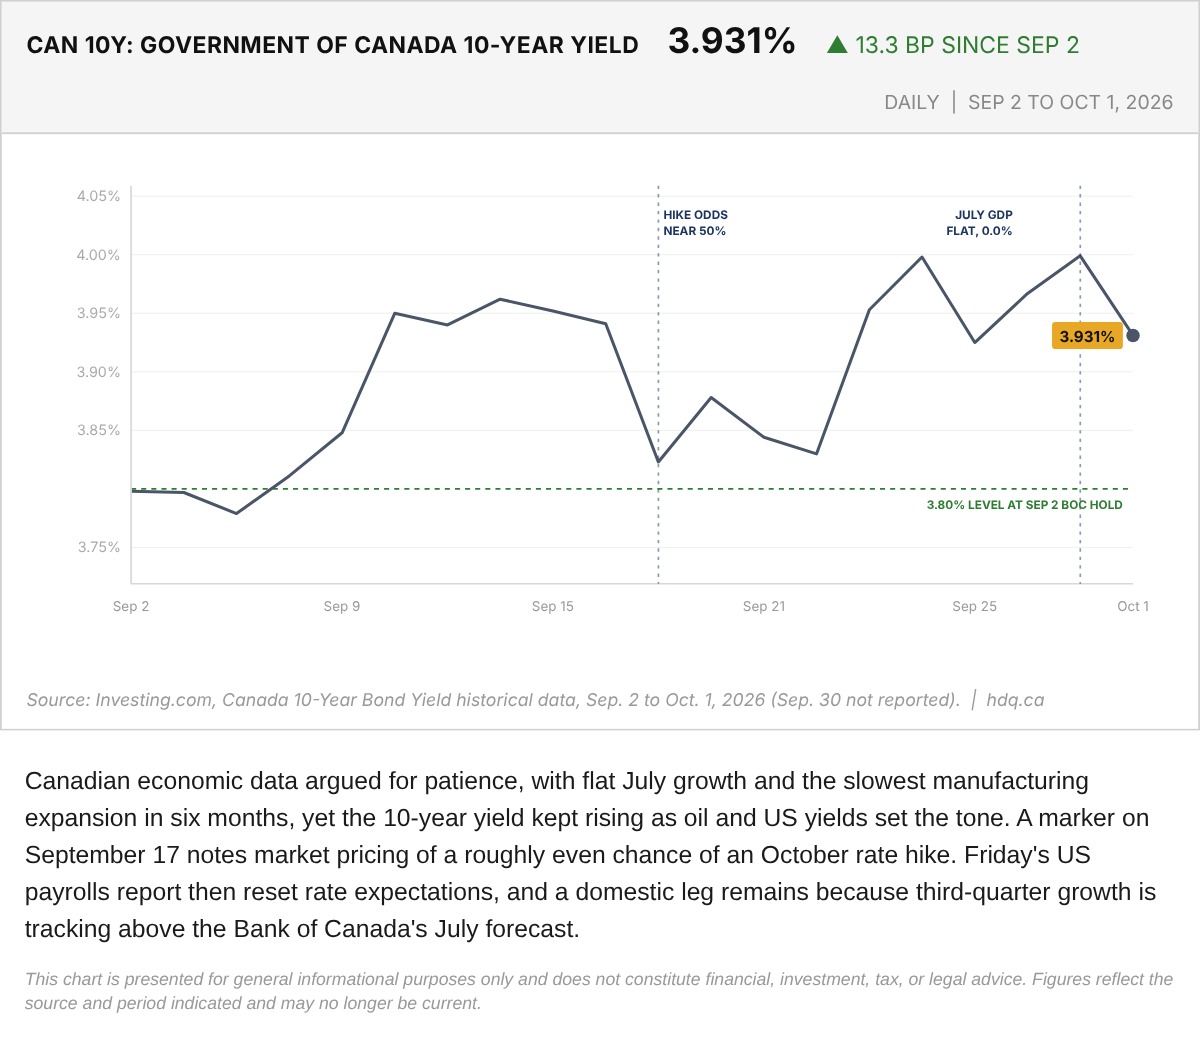
Canadian economic data argued for patience, with flat July growth and the slowest manufacturing expansion in six months, yet the 10-year…
Government of Canada 10-Year Bond Yield, September 2 to October 1, 2026
October 3, 2026
View chart & download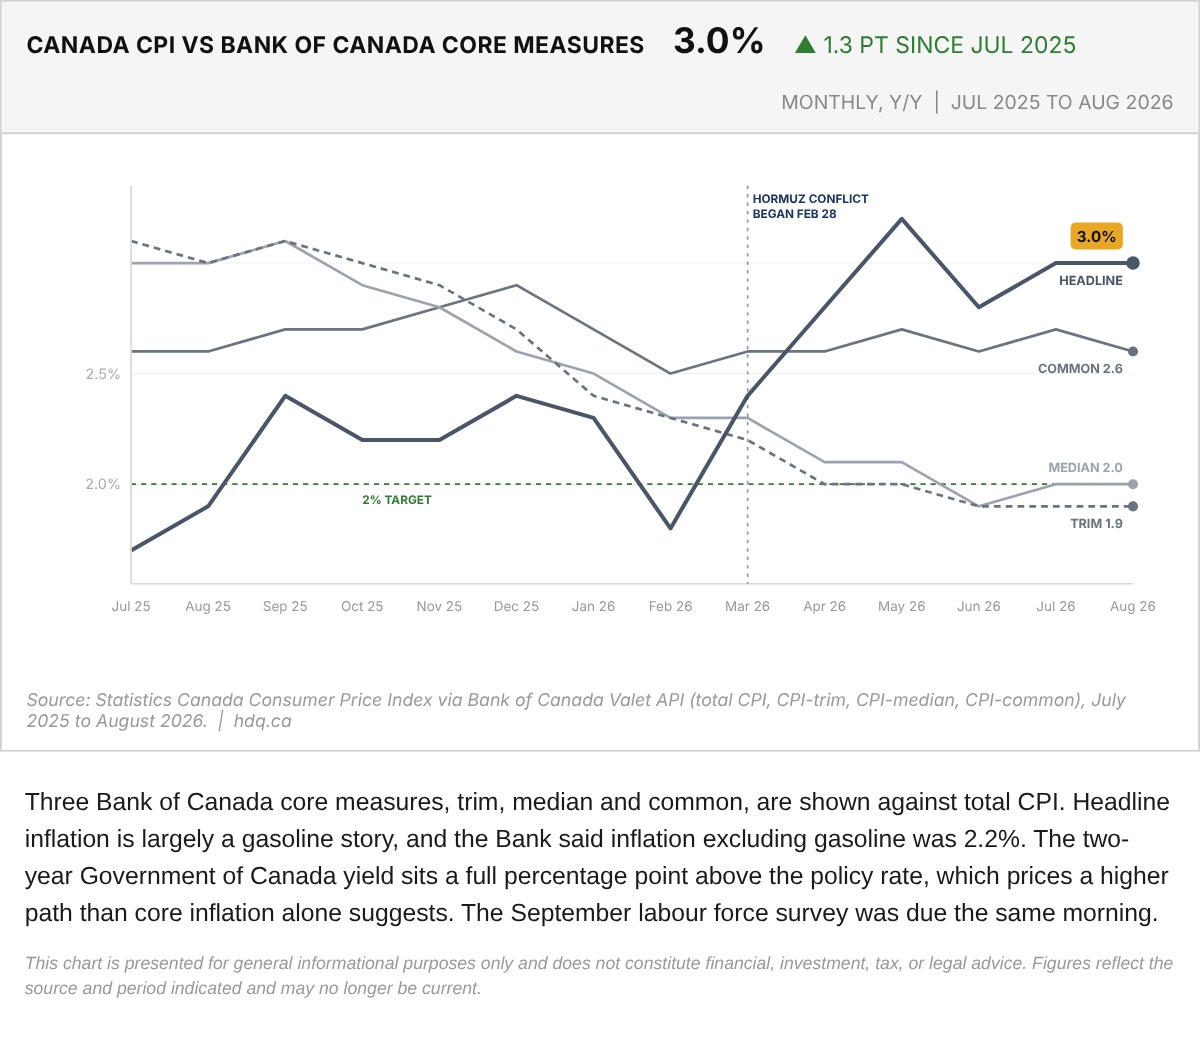
Three Bank of Canada core measures, trim, median and common, are shown against total CPI.
Canada CPI Against Bank of Canada Core Measures, July 2025 to August 2026
October 9, 2026
View chart & download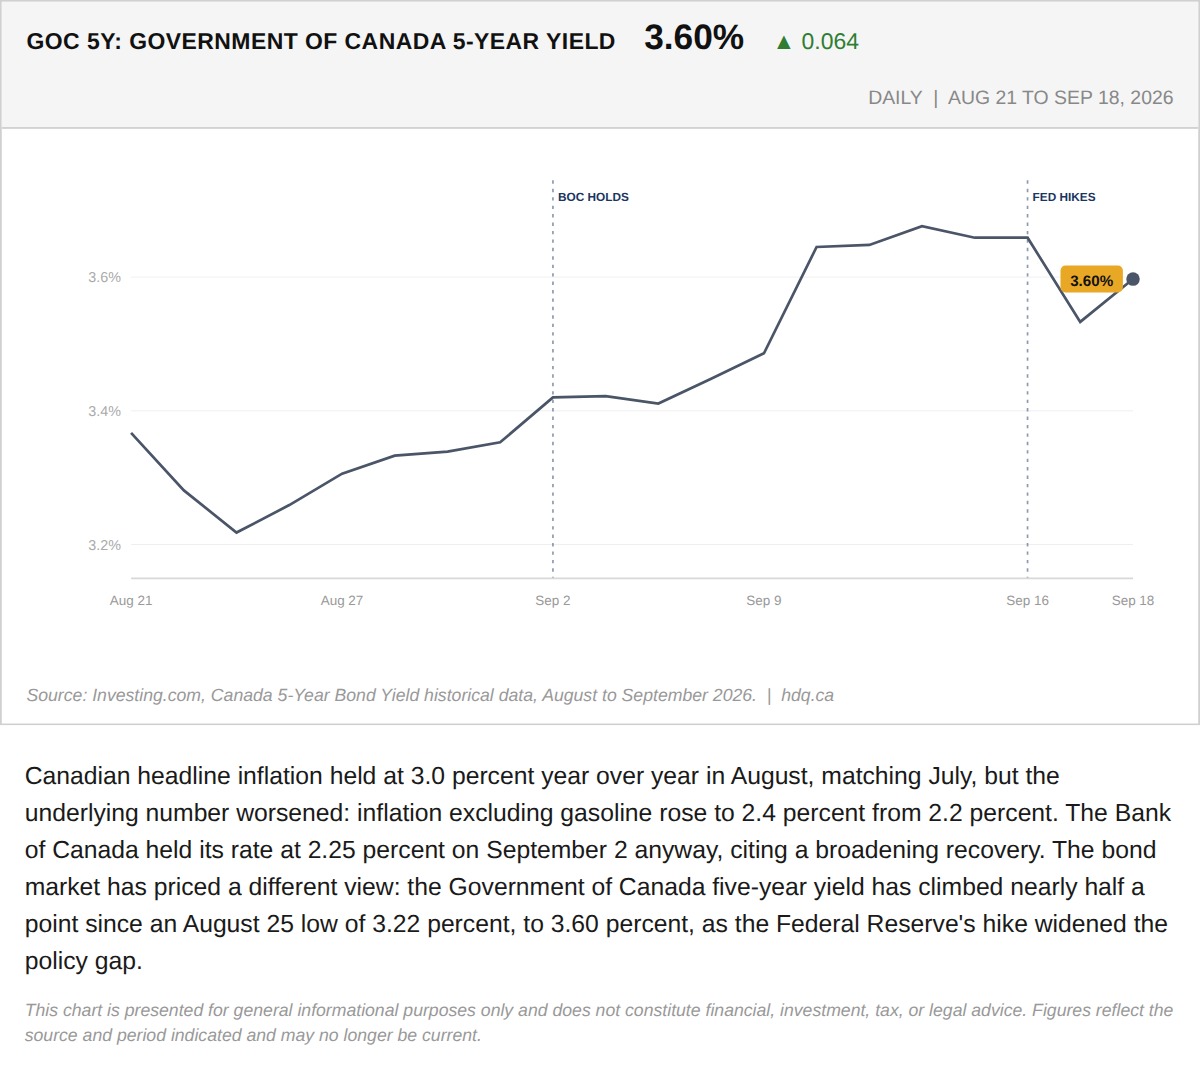
Canadian headline inflation held at 3.0 percent year over year in August, matching July, but the underlying number worsened: inflation…
The Bond Market Already Moved Before the Bank of Canada Has To
September 21, 2026
View chart & download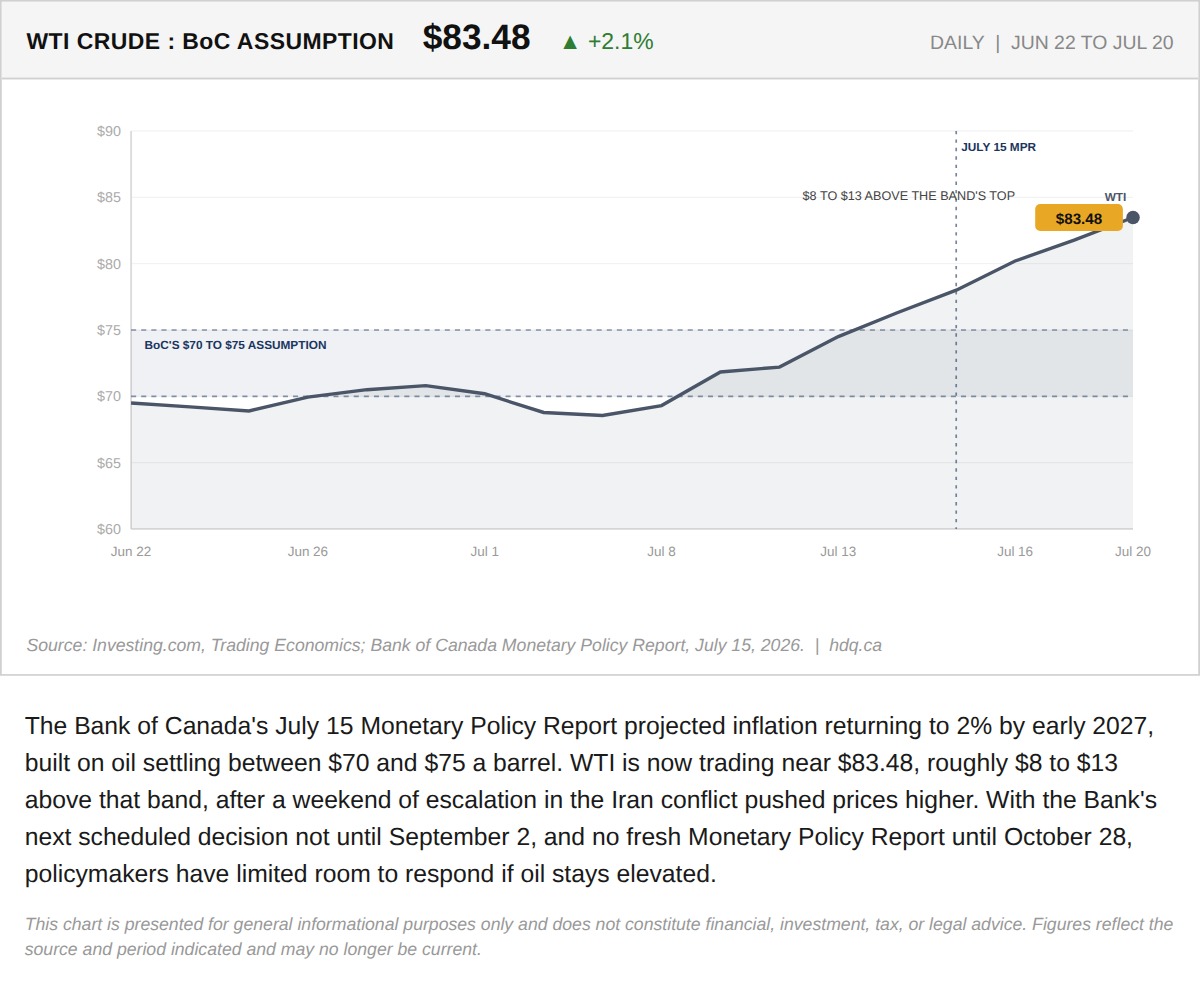
The Bank of Canada's July 15 Monetary Policy Report projected inflation returning to 2% by early 2027, built on oil settling between $70 and $75 a barrel.
The Bank of Canada's Path Back to 2% Assumed Oil at $70 to $75. It's Trading Near $84.
July 20, 2026
View chart & download