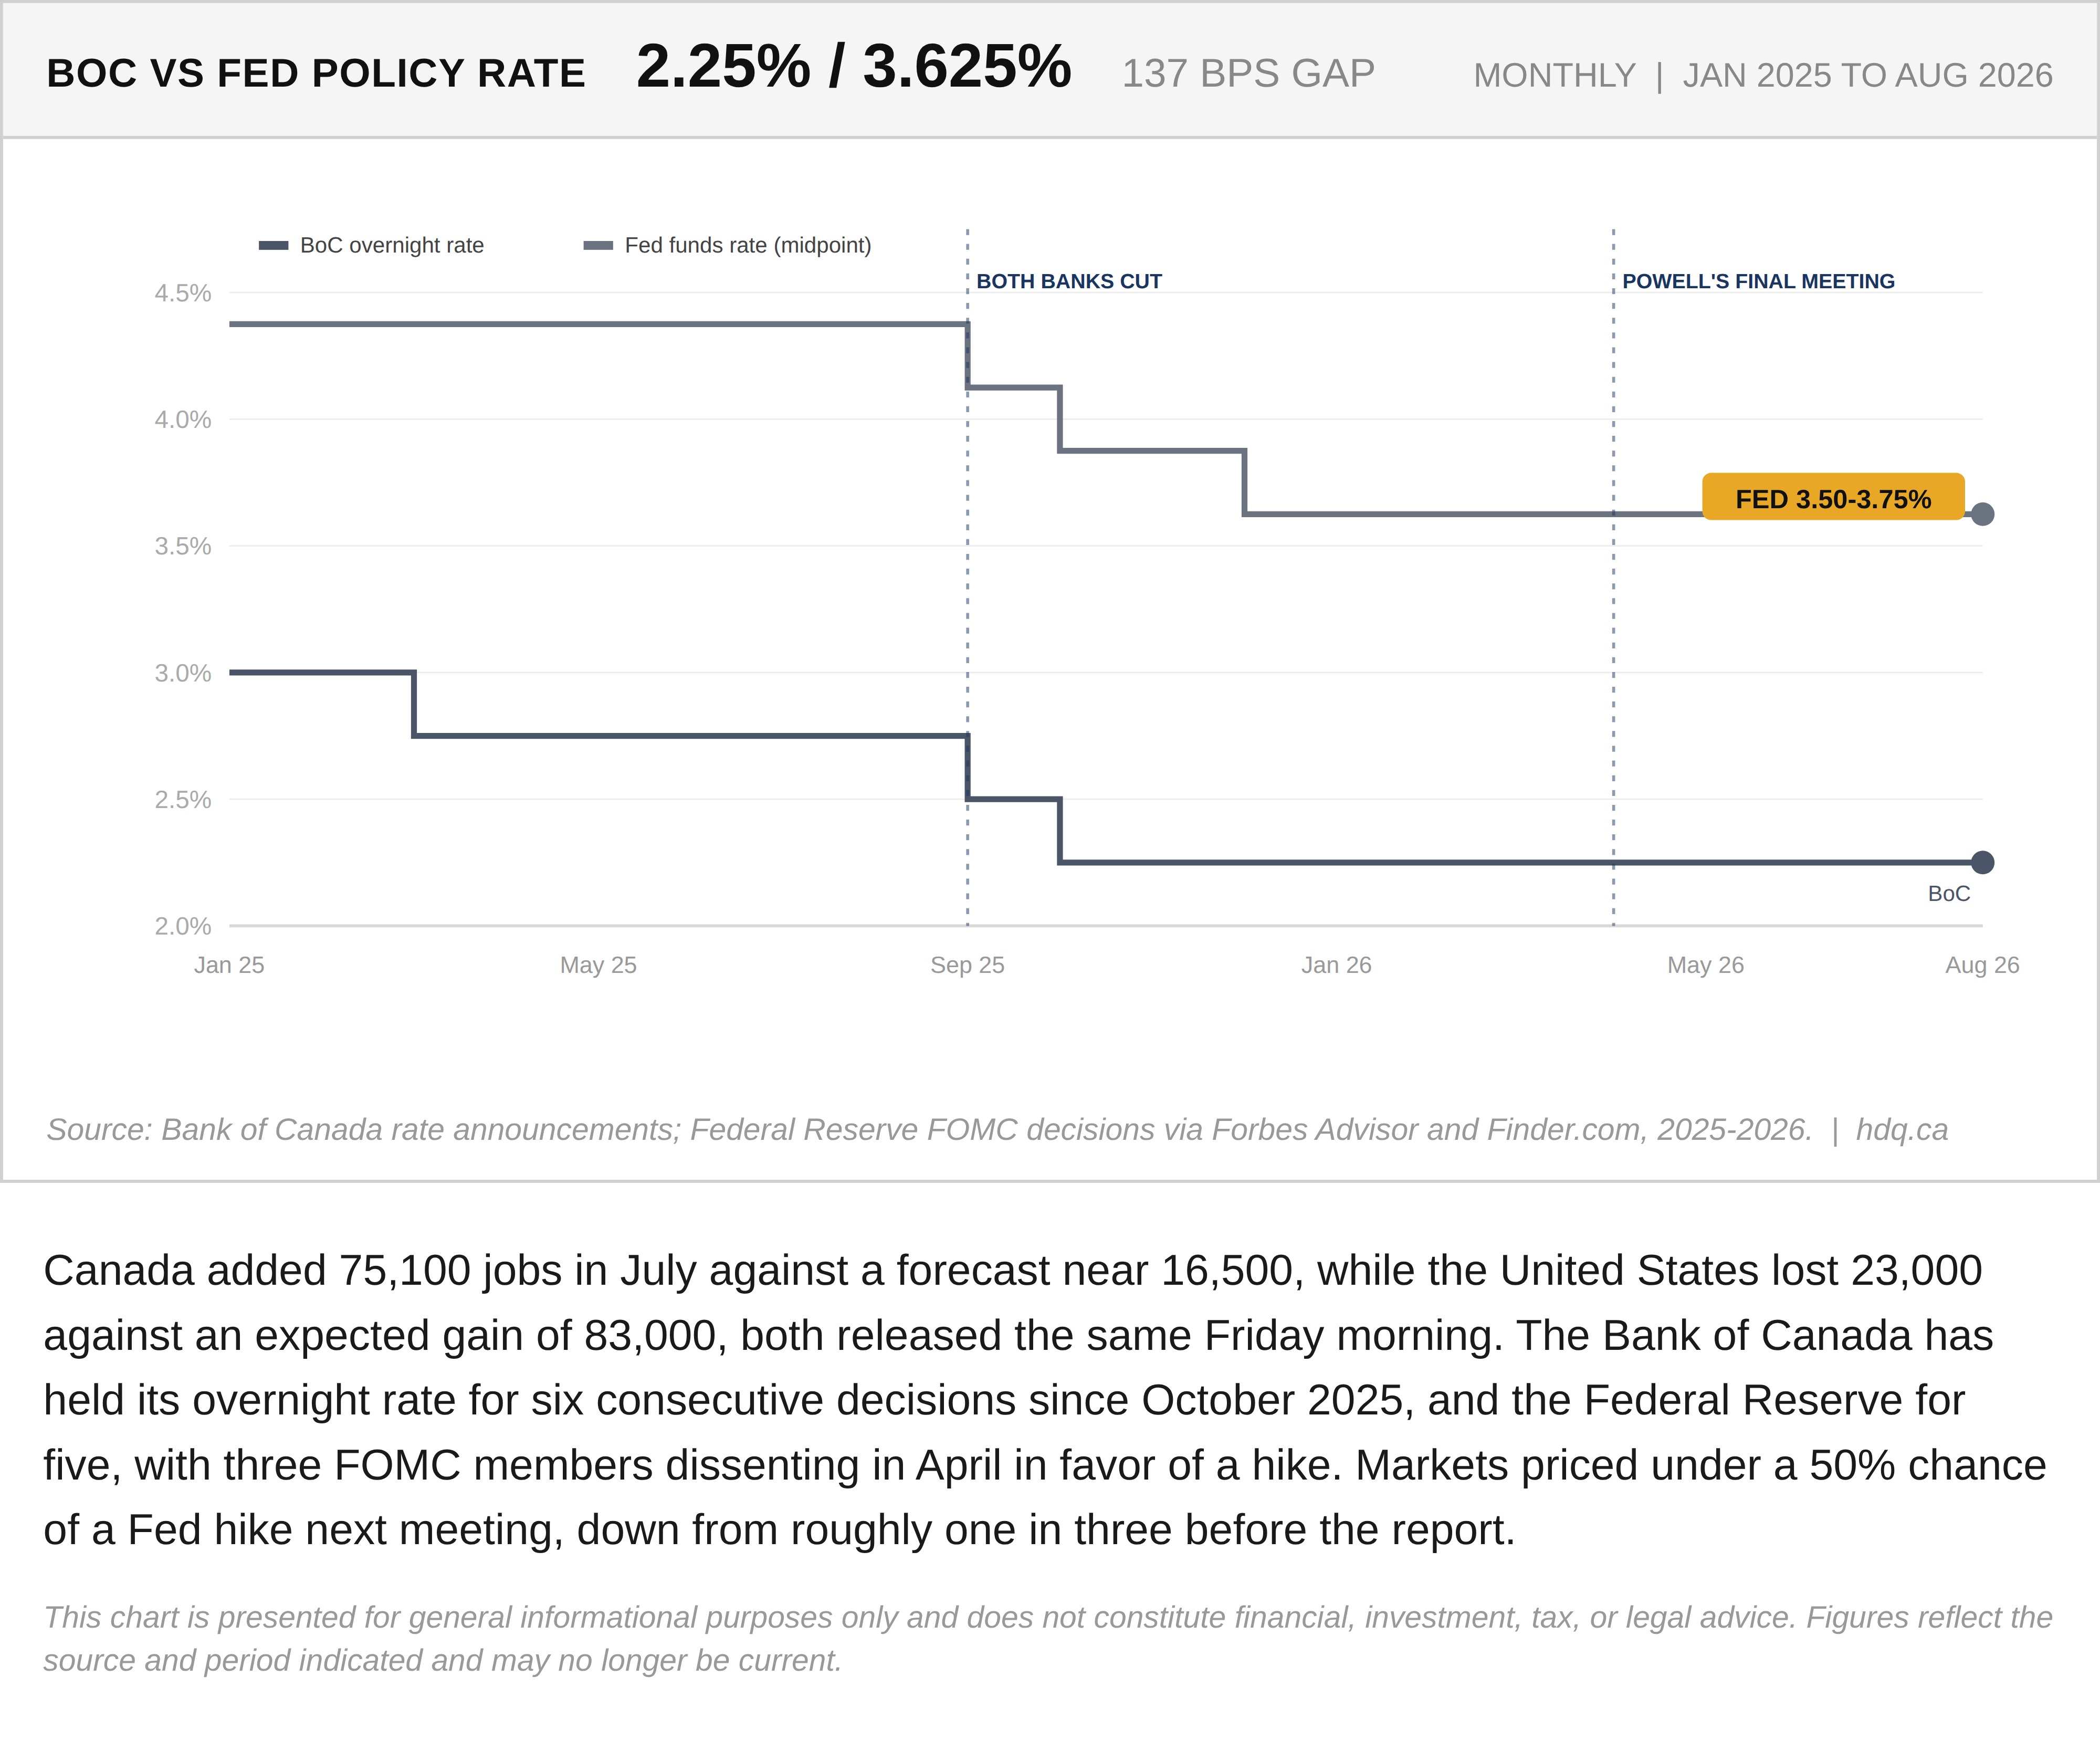
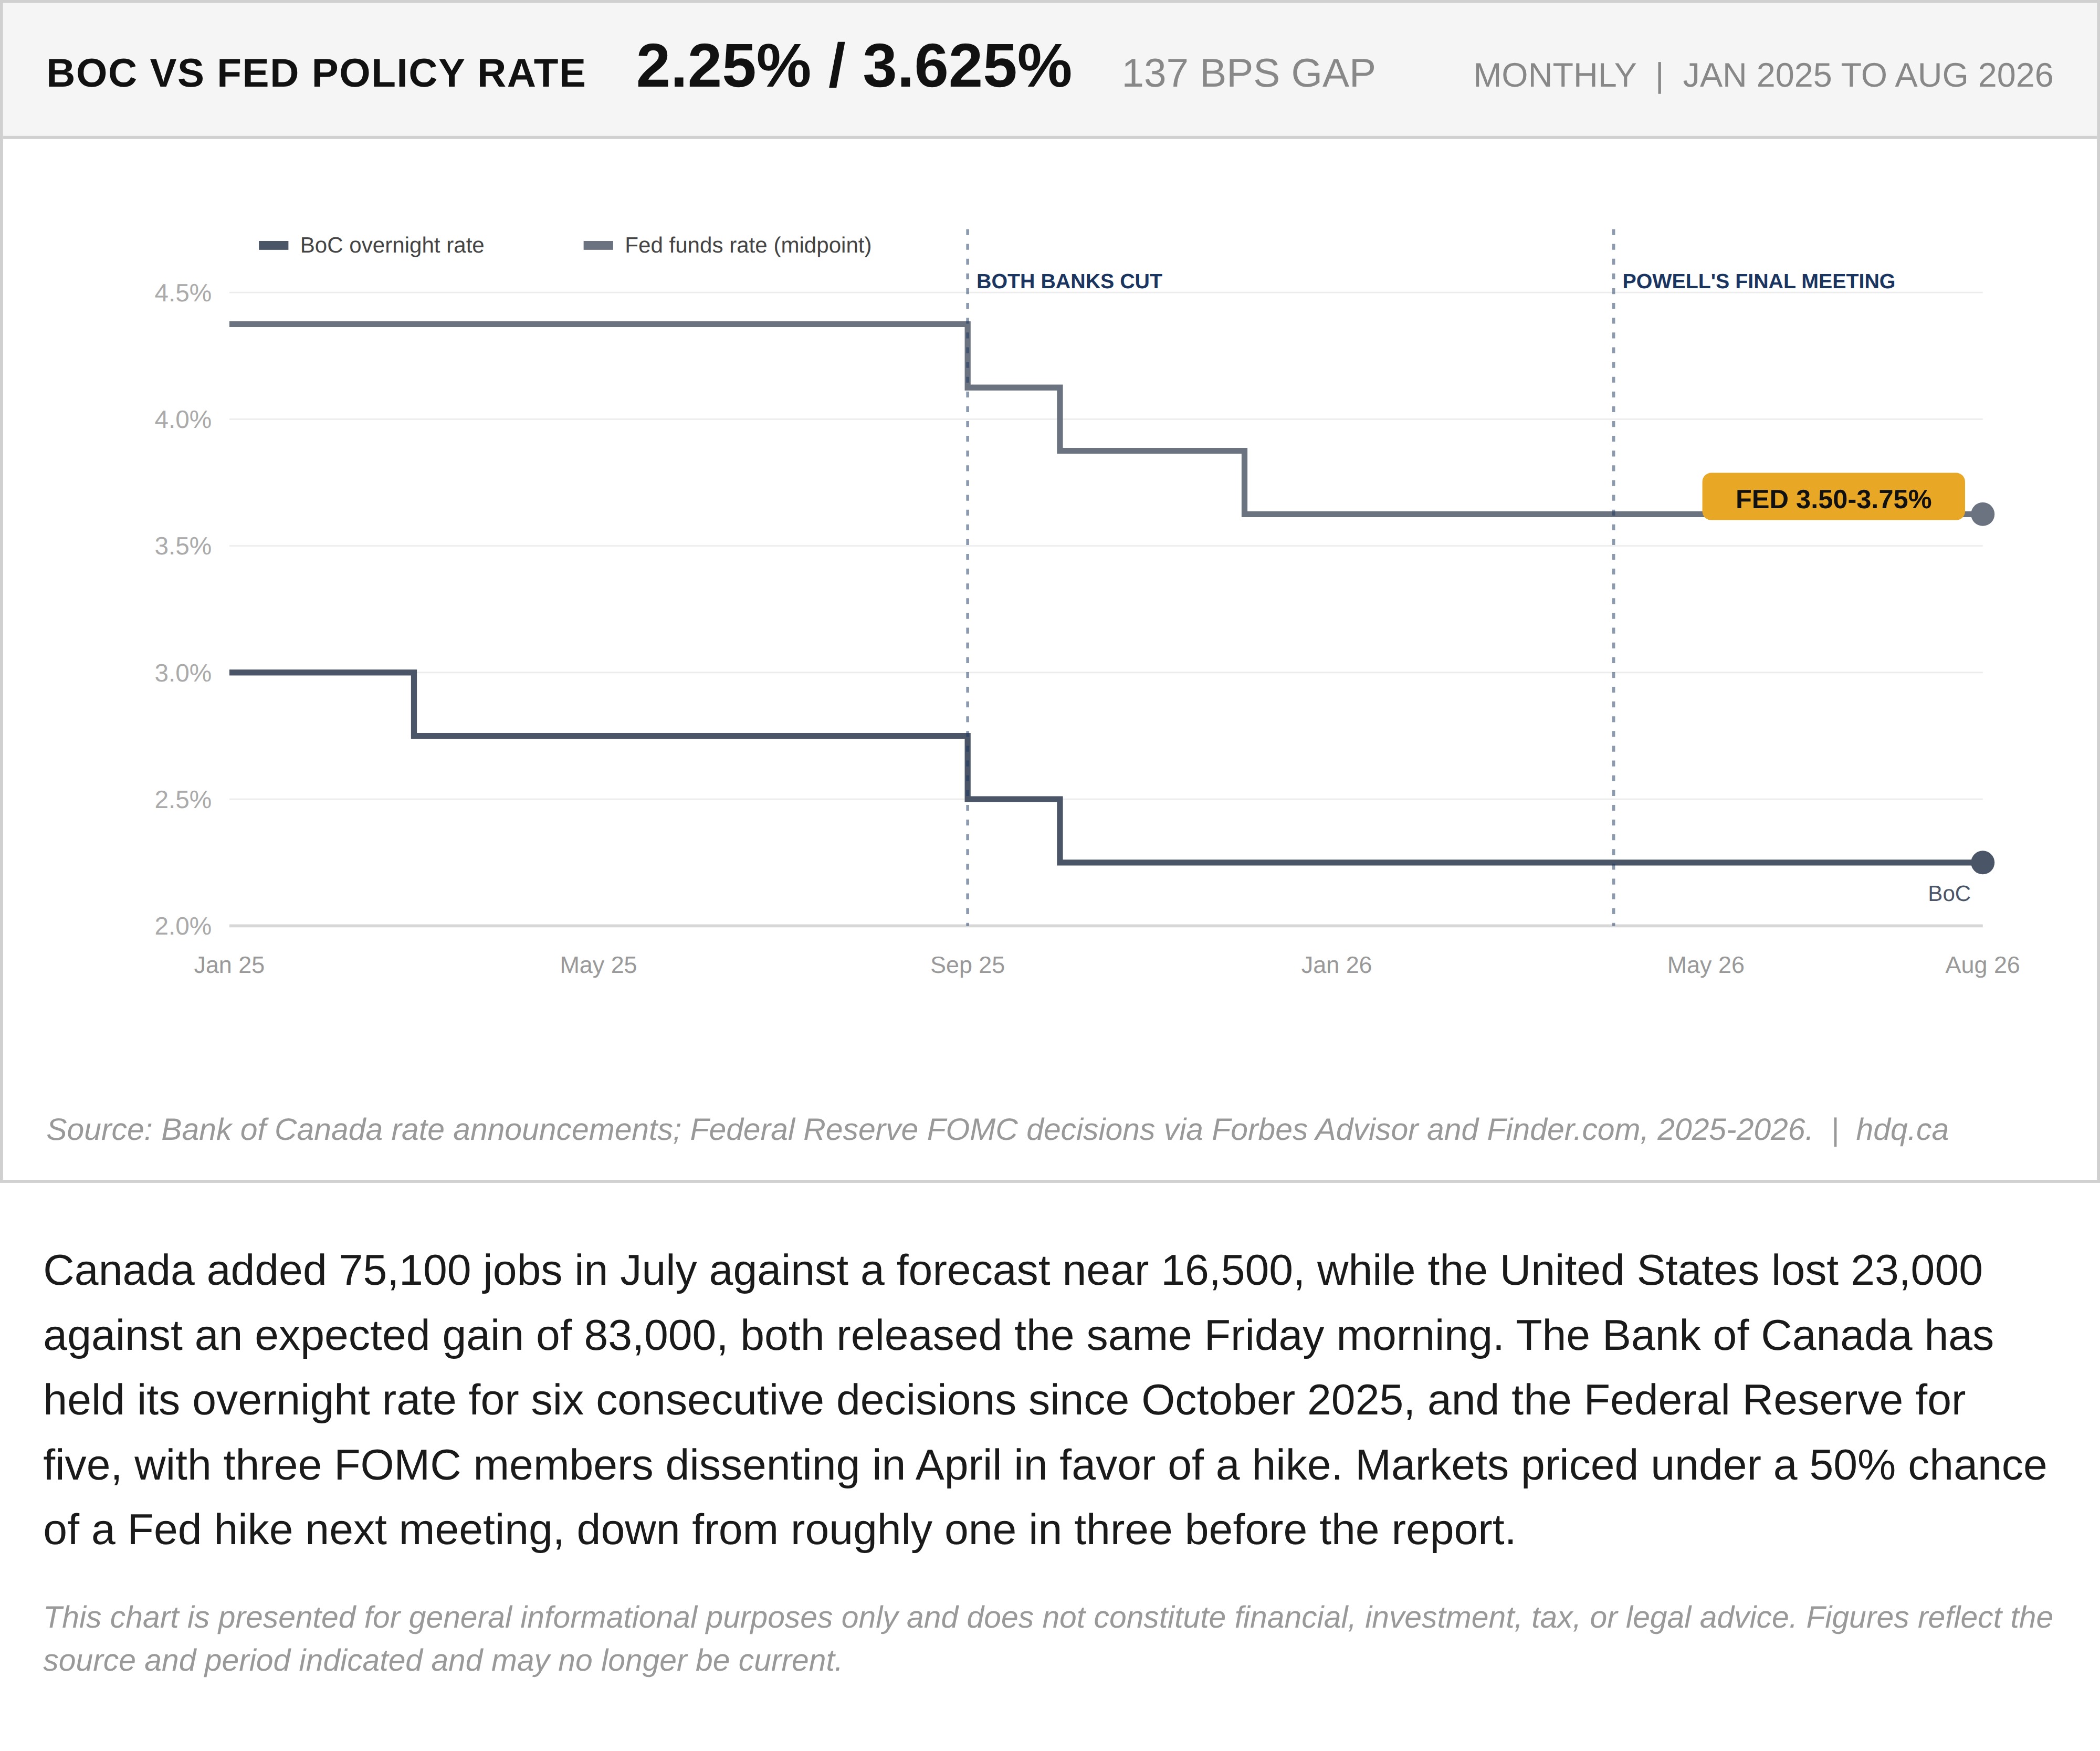
Canada added 75,100 jobs in July against a forecast near 16,500, while the United States lost 23,000 against an expected gain of 83,000, both released the same Friday morning. The Bank of Canada has held its overnight rate for six consecutive decisions since October 2025, and the Federal Reserve for five, with three FOMC members dissenting in April in favor of a hike. Markets priced under a 50% chance of a Fed hike next meeting, down from roughly one in three before the report.
This chart is presented for general informational purposes only and does not constitute financial, investment, tax, or legal advice. Figures reflect the source and period indicated and may no longer be current.
Related charts
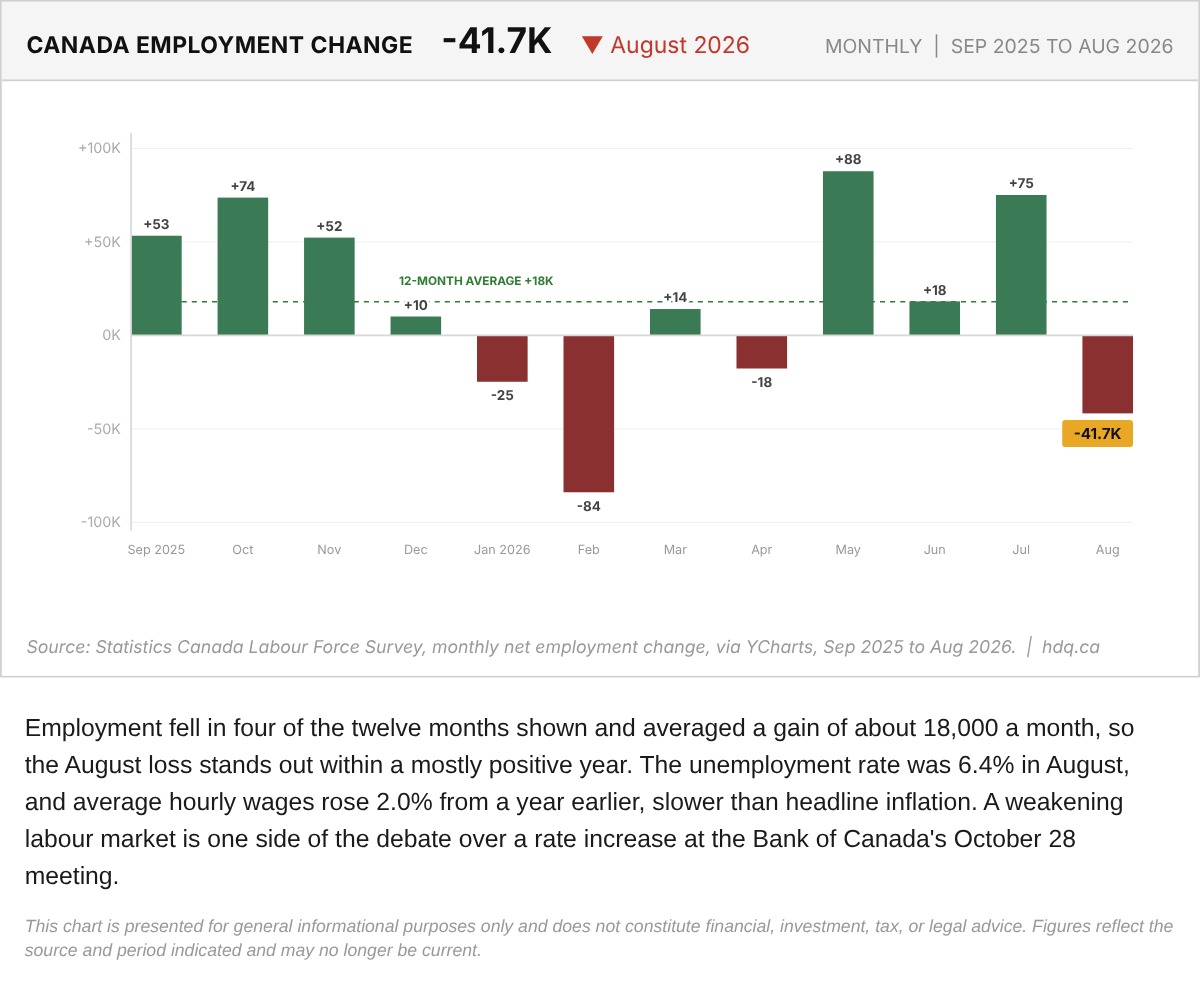
Employment fell in four of the twelve months shown and averaged a gain of about 18,000 a month, so the August loss stands out within a mostly positive year.
Canada Monthly Net Employment Change, September 2025 to August 2026
October 6, 2026
View chart & download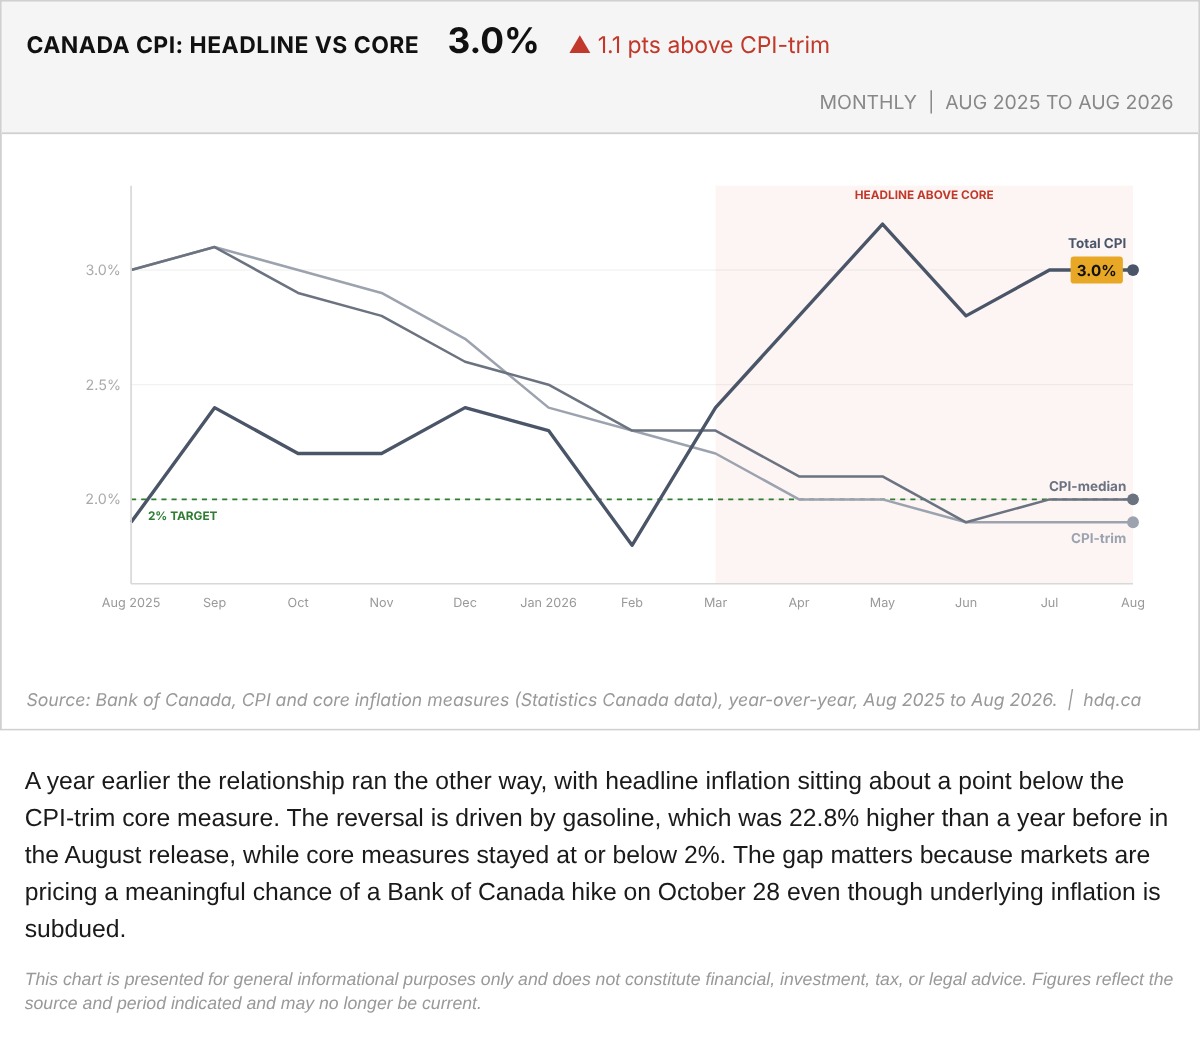
A year earlier the relationship ran the other way, with headline inflation sitting about a point below the CPI-trim core measure.
Canada Headline CPI Against Bank of Canada Core Measures, August 2026
October 6, 2026
View chart & download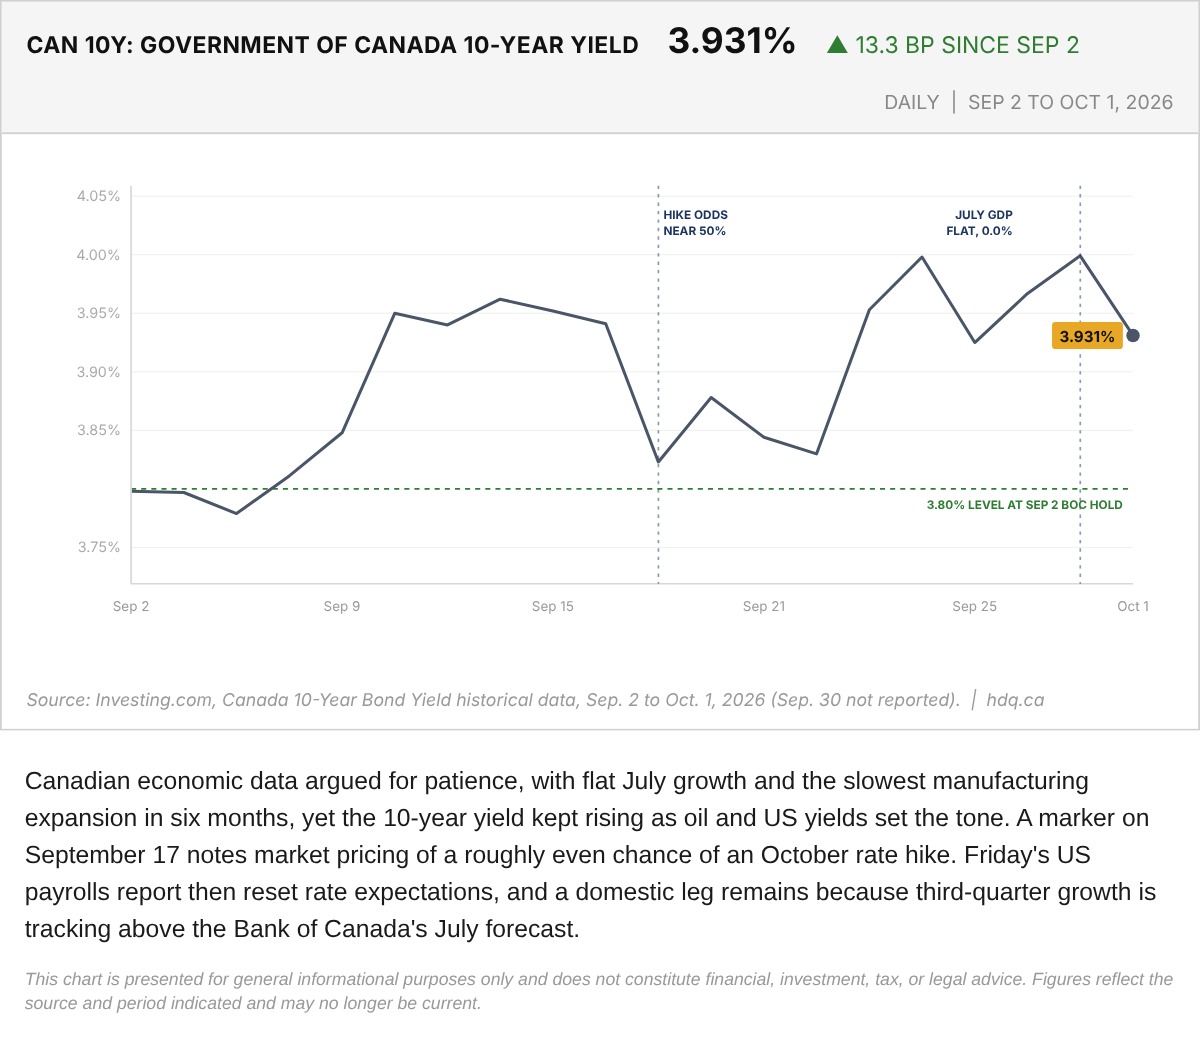
Canadian economic data argued for patience, with flat July growth and the slowest manufacturing expansion in six months, yet the 10-year…
Government of Canada 10-Year Bond Yield, September 2 to October 1, 2026
October 3, 2026
View chart & download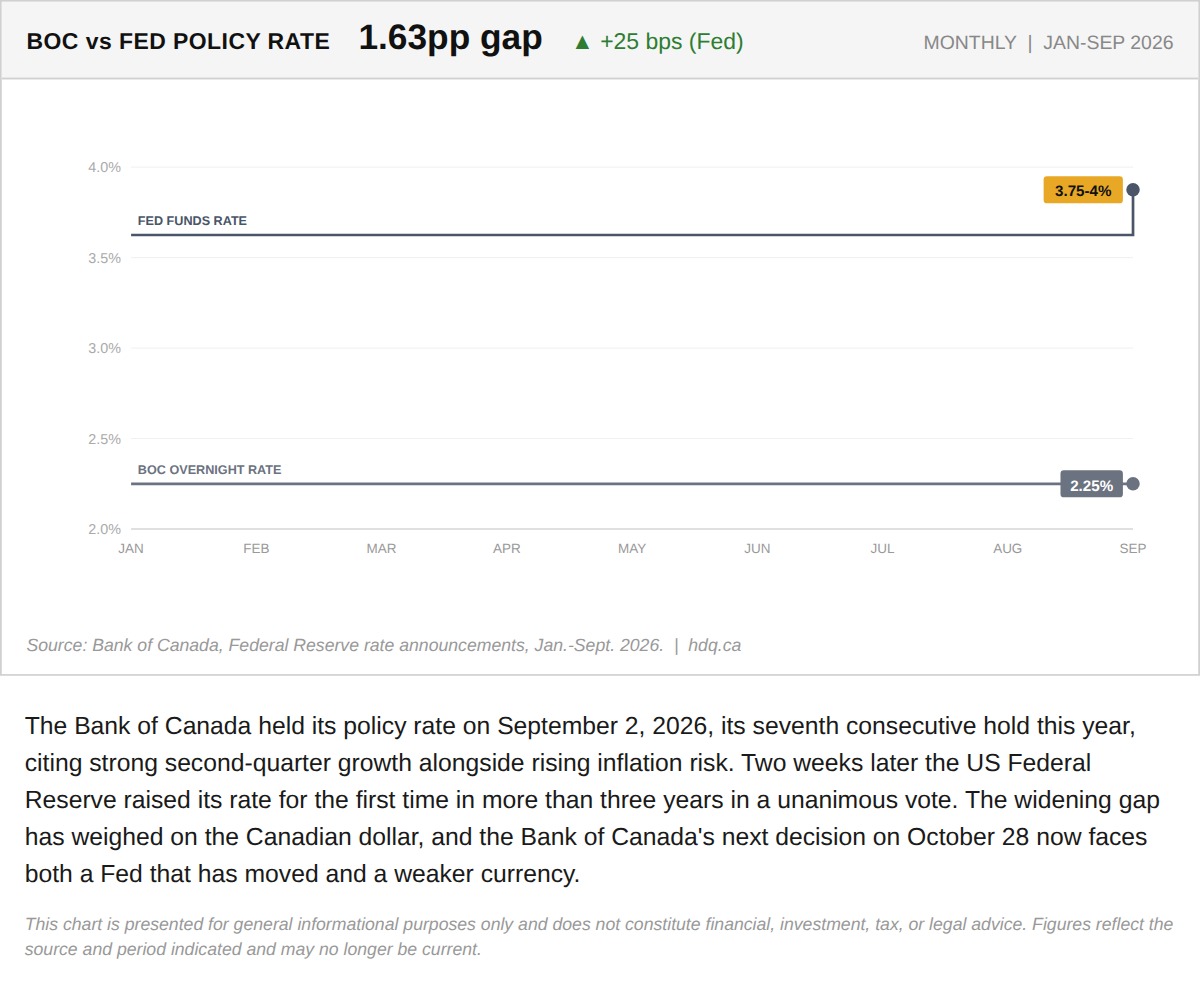
The Bank of Canada held its policy rate on September 2, 2026, its seventh consecutive hold this year, citing strong second-quarter growth alongside rising inflation risk.
The Bank of Canada Has Held Seven Times This Year. The Fed Just Broke Its Own Pattern.
September 23, 2026
View chart & download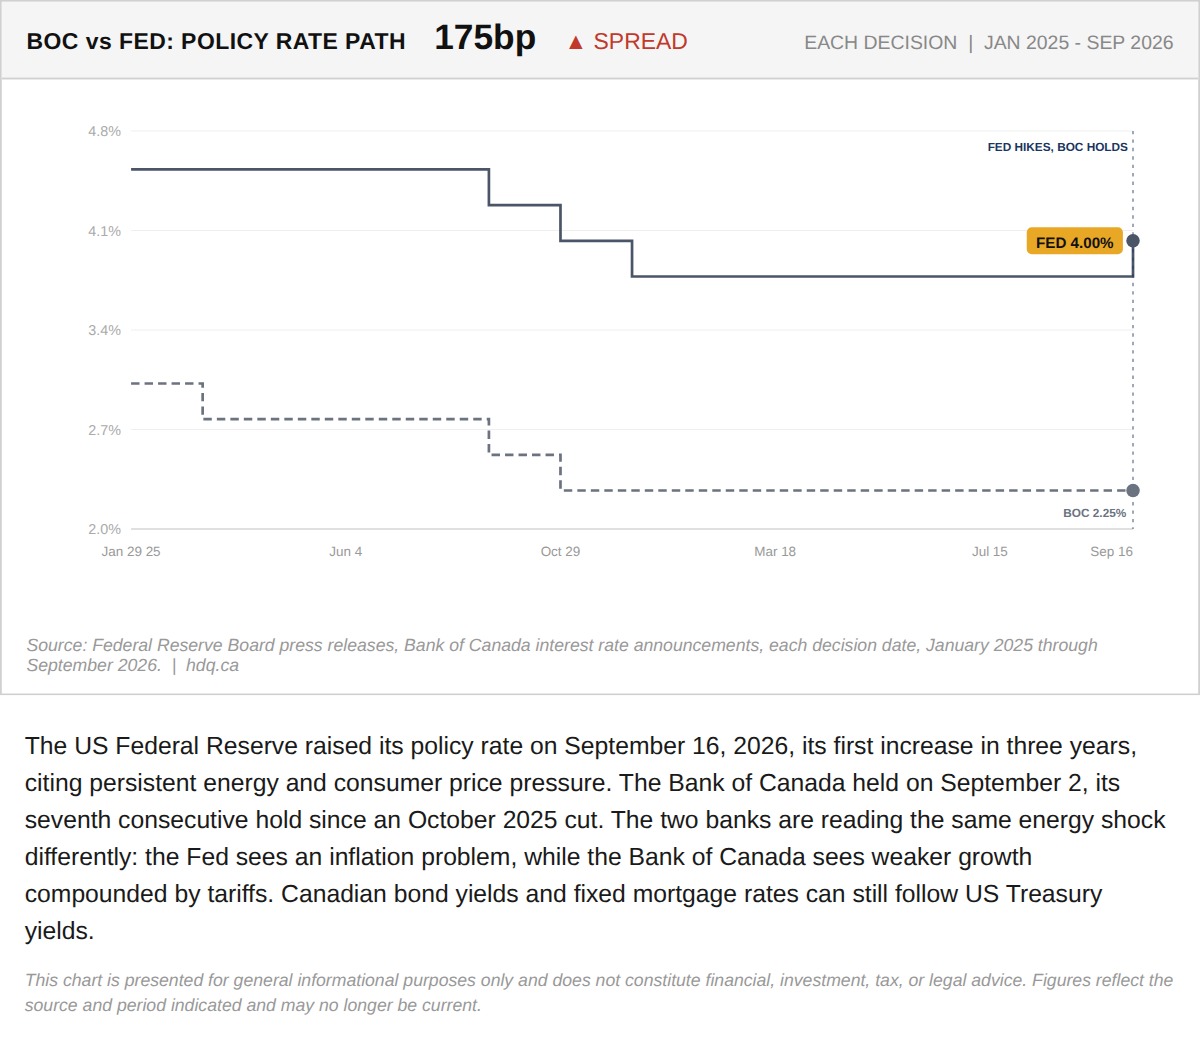
The US Federal Reserve raised its policy rate on September 16, 2026, its first increase in three years, citing persistent energy and consumer price pressure.
Why the Fed Just Broke Rank With the Bank of Canada
September 22, 2026
View chart & download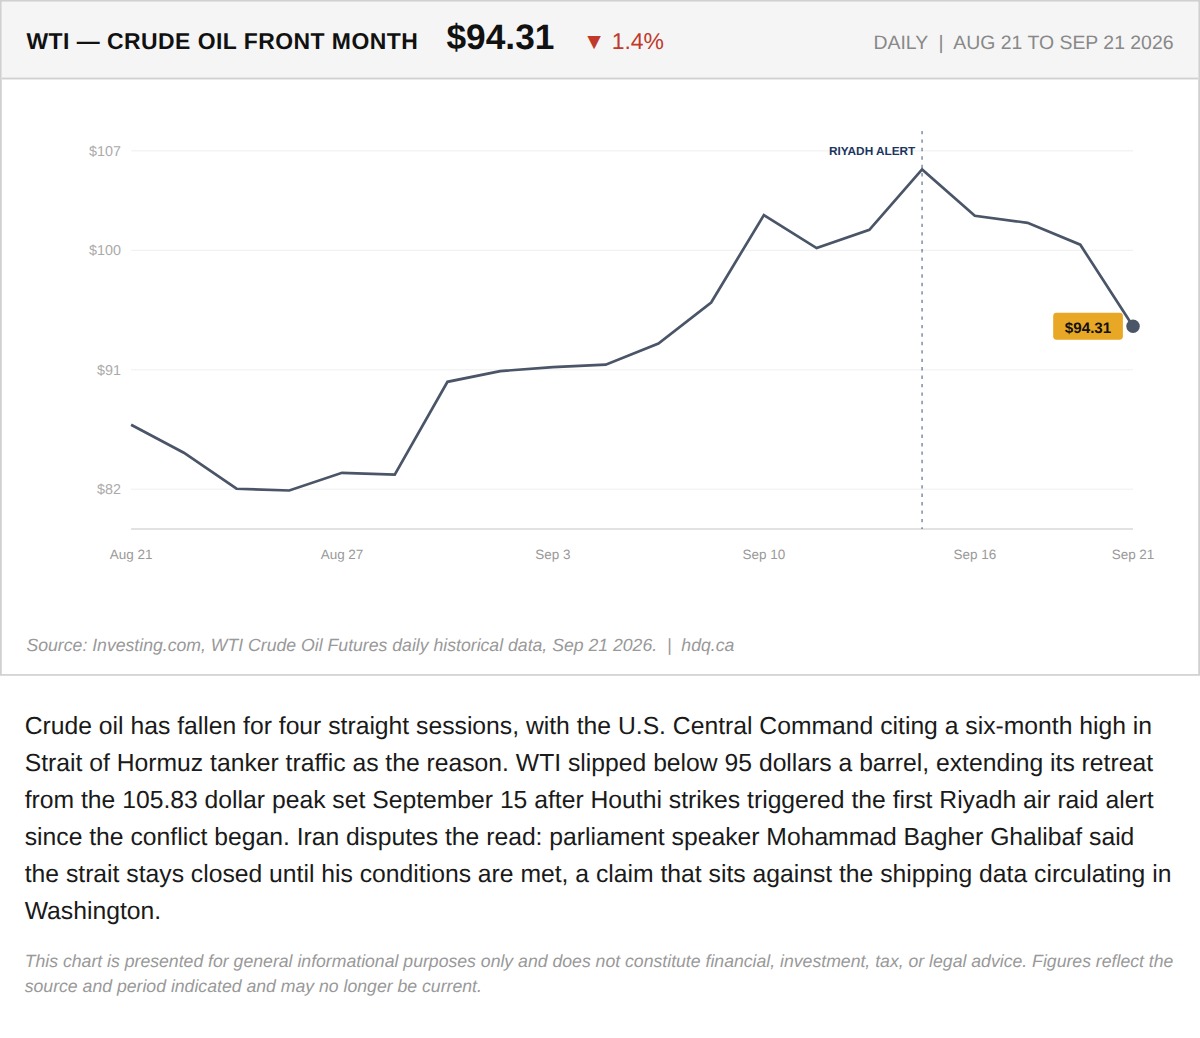
Crude oil has fallen for four straight sessions, with the U.S.
Oil Falls for a Fourth Session as Hormuz Shipping Data Is Disputed
September 21, 2026
View chart & download