August 2026
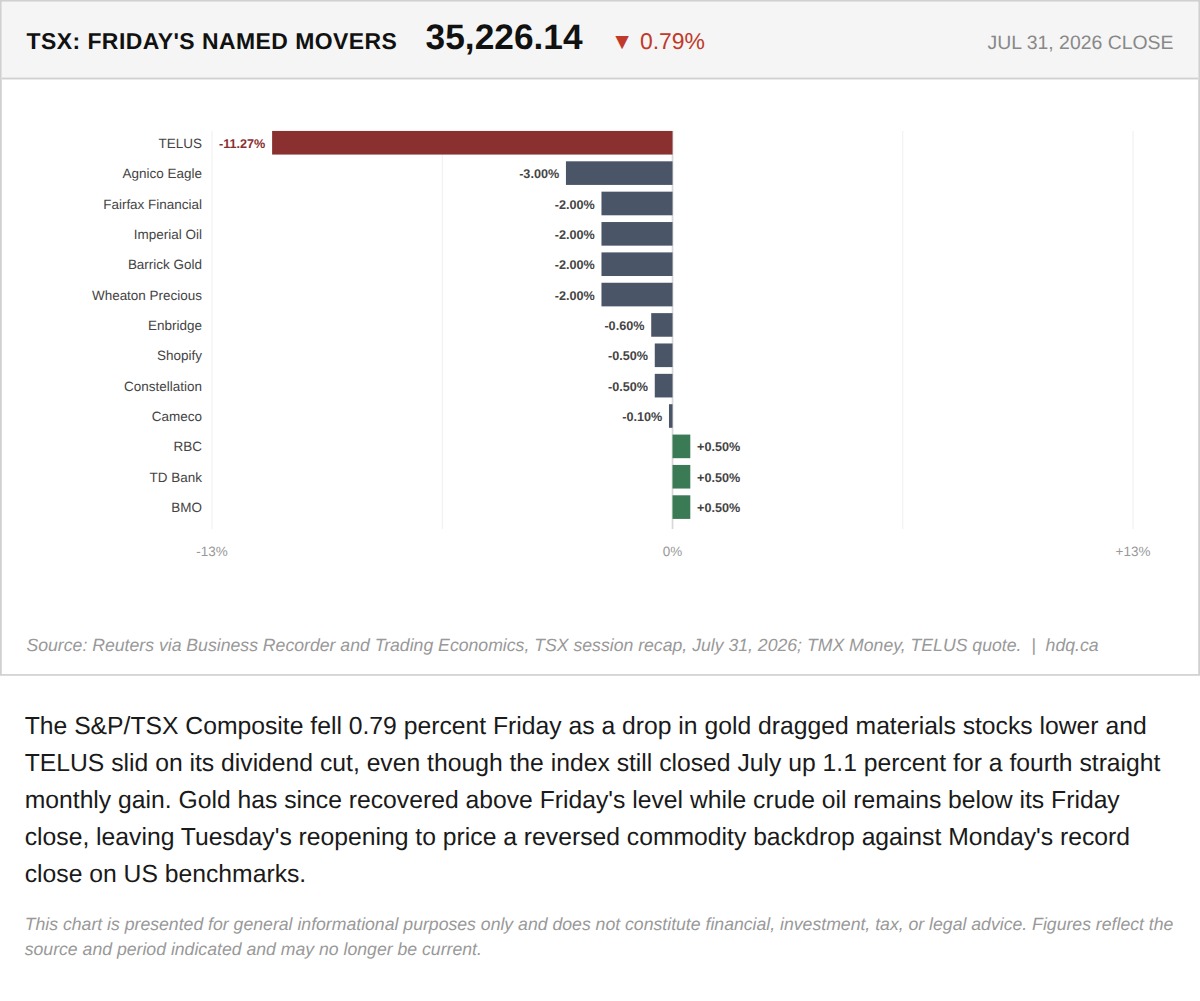
The S&P/TSX Composite fell 0.79 percent Friday as a drop in gold dragged materials stocks lower and TELUS slid on its dividend cut, even…
The TSX Closed Friday on Falling Gold. It Reopens on Rising Gold.
August 4, 2026
View chart & download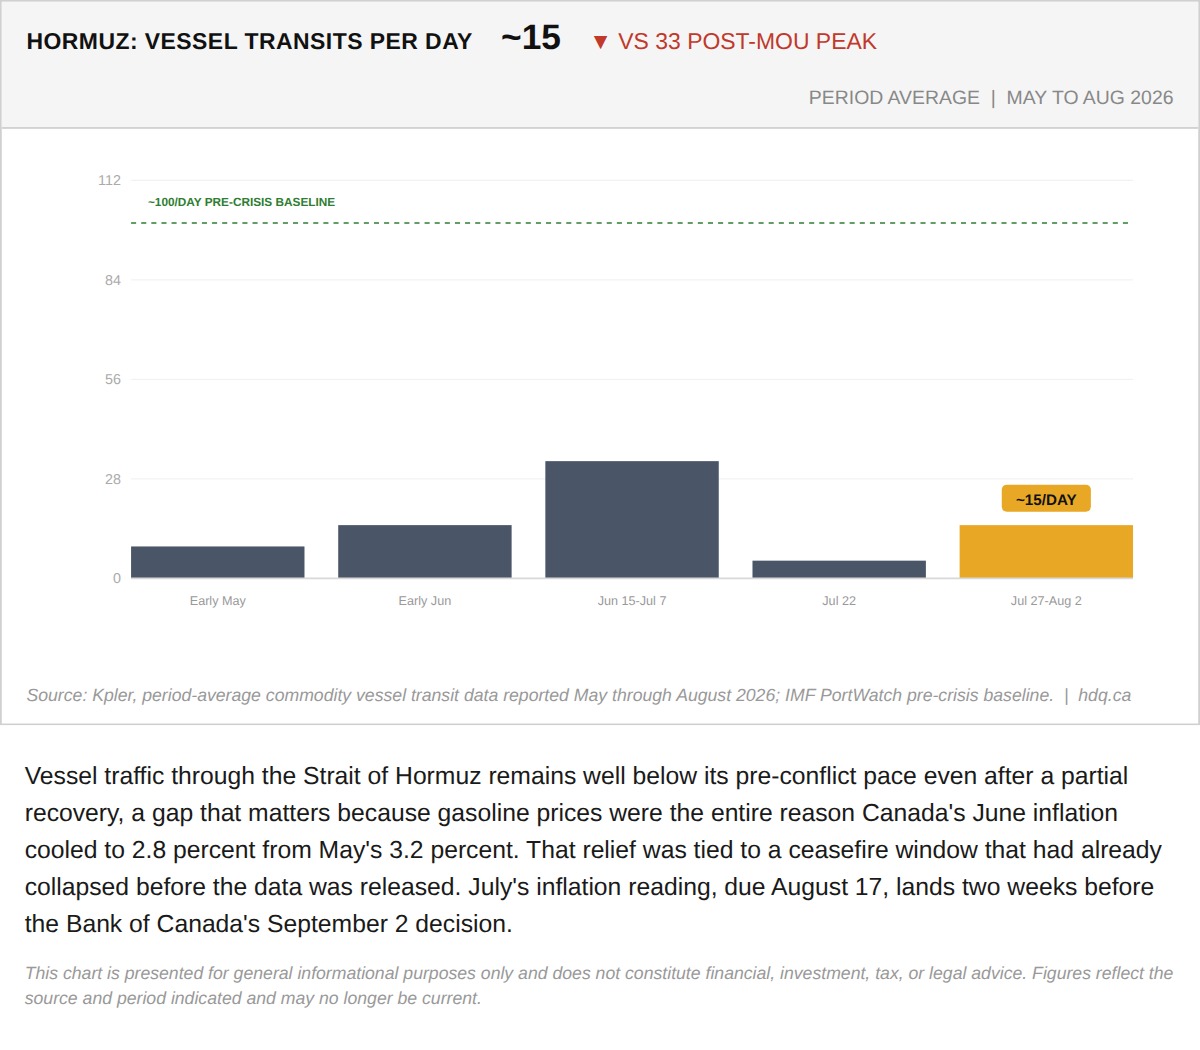
Vessel traffic through the Strait of Hormuz remains well below its pre-conflict pace even after a partial recovery, a gap that matters…
The Cancelled Iran Strike Reopens a Gasoline-Price Risk for the Bank of Canada
August 4, 2026
View chart & download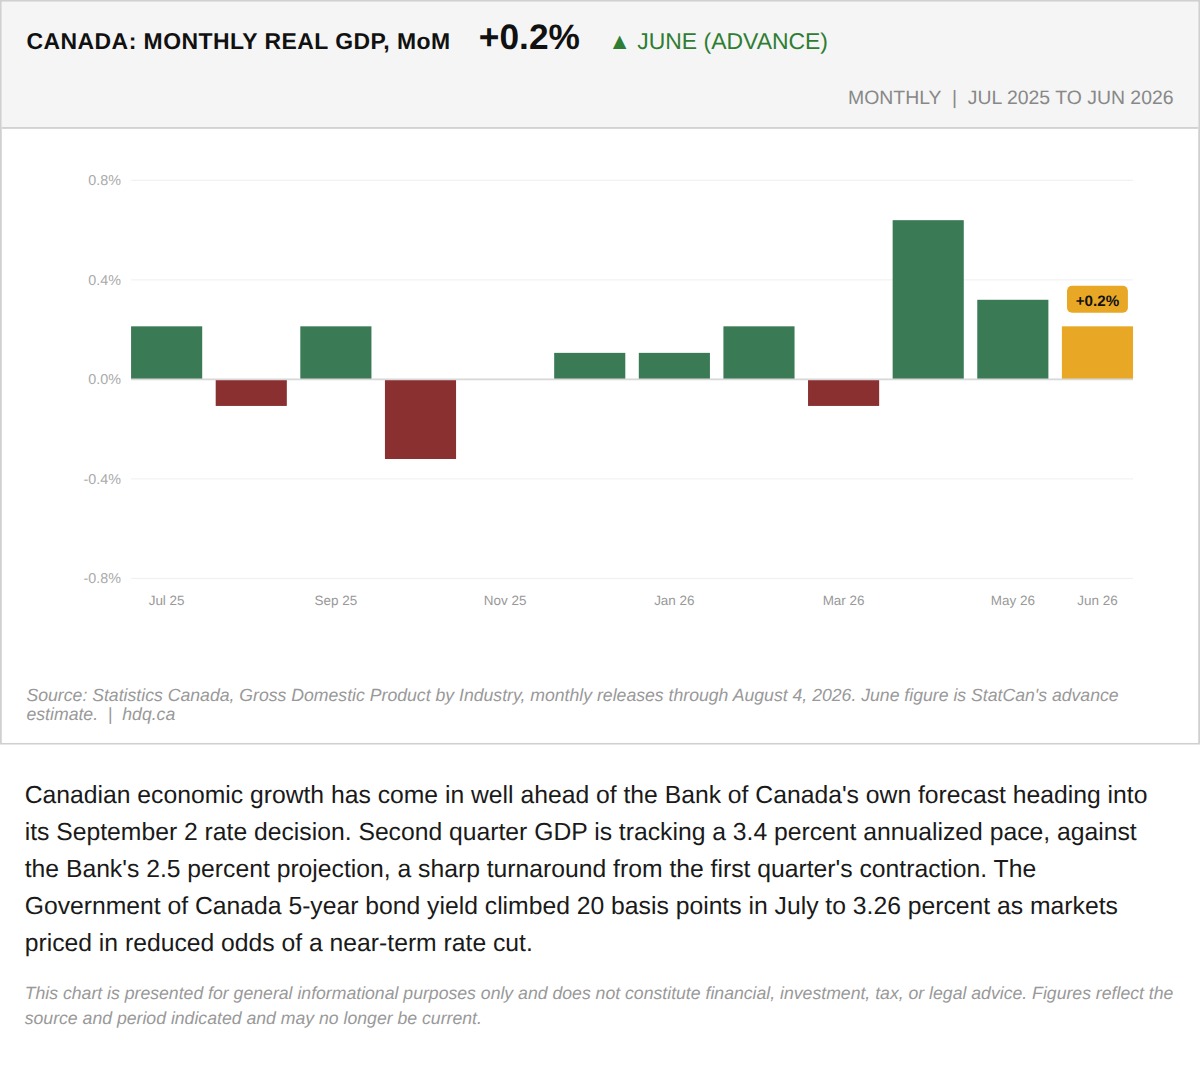
Canadian economic growth has come in well ahead of the Bank of Canada's own forecast heading into its September 2 rate decision.
Canada's Economy Is Outrunning the Bank of Canada's Own Forecast
August 4, 2026
View chart & download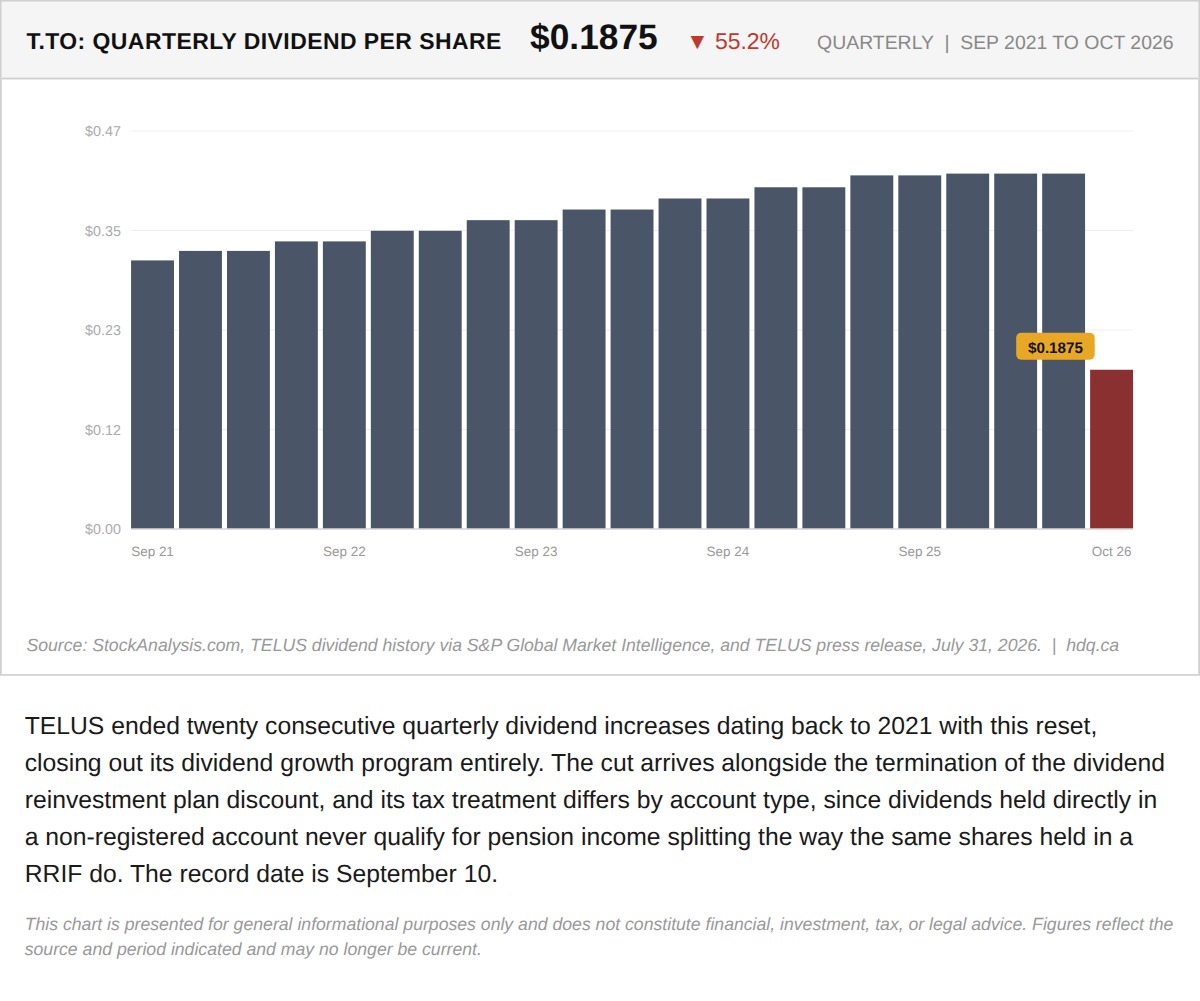
TELUS ended twenty consecutive quarterly dividend increases dating back to 2021 with this reset, closing out its dividend growth program entirely.
TELUS's Dividend Cut Ends a Five-Year Run of Increases
August 4, 2026
View chart & download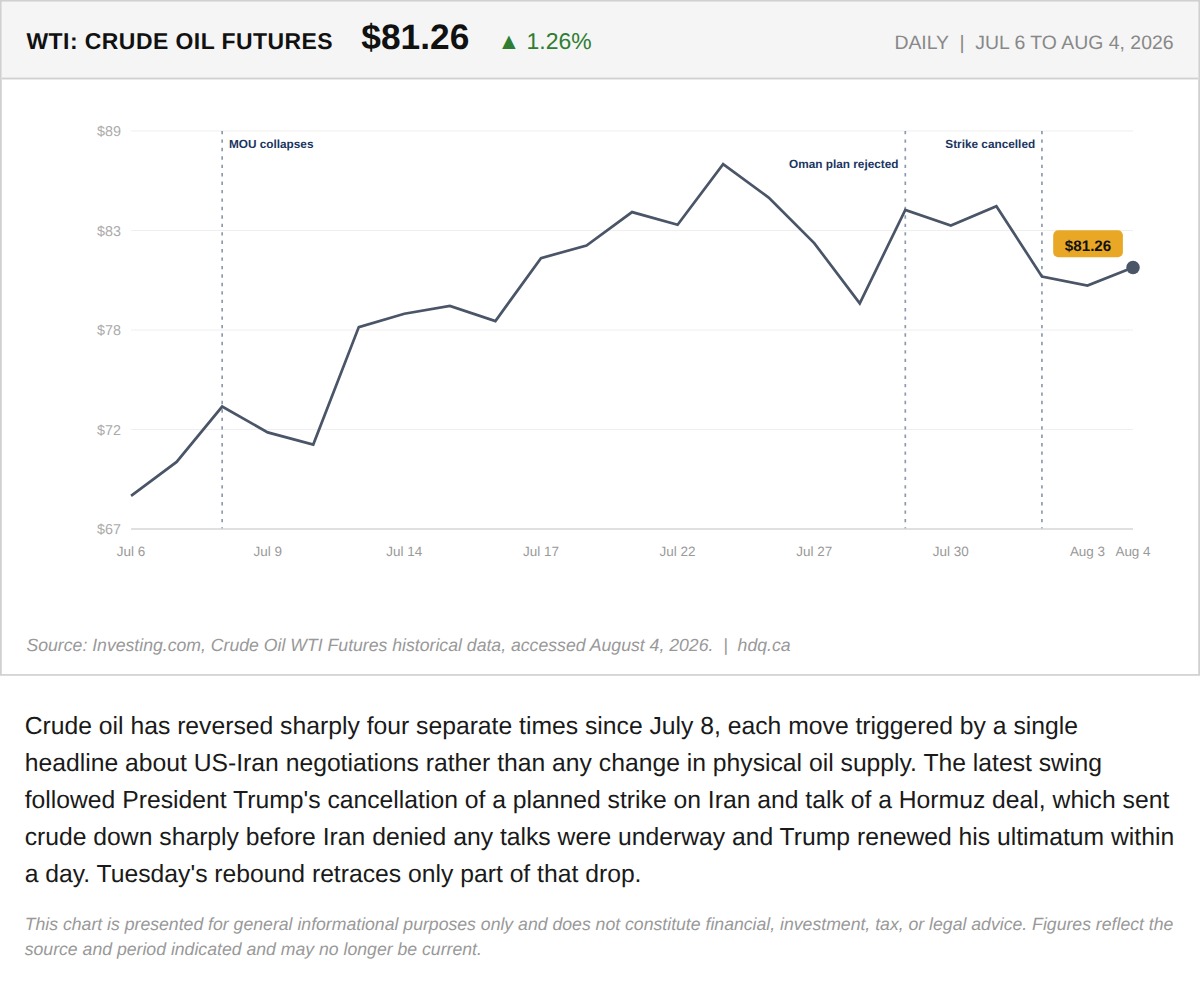
Crude oil has reversed sharply four separate times since July 8, each move triggered by a single headline about US-Iran negotiations rather than any change in physical oil supply.
Why Oil Keeps Pricing In an Iran Deal That Has Not Happened
August 4, 2026
View chart & download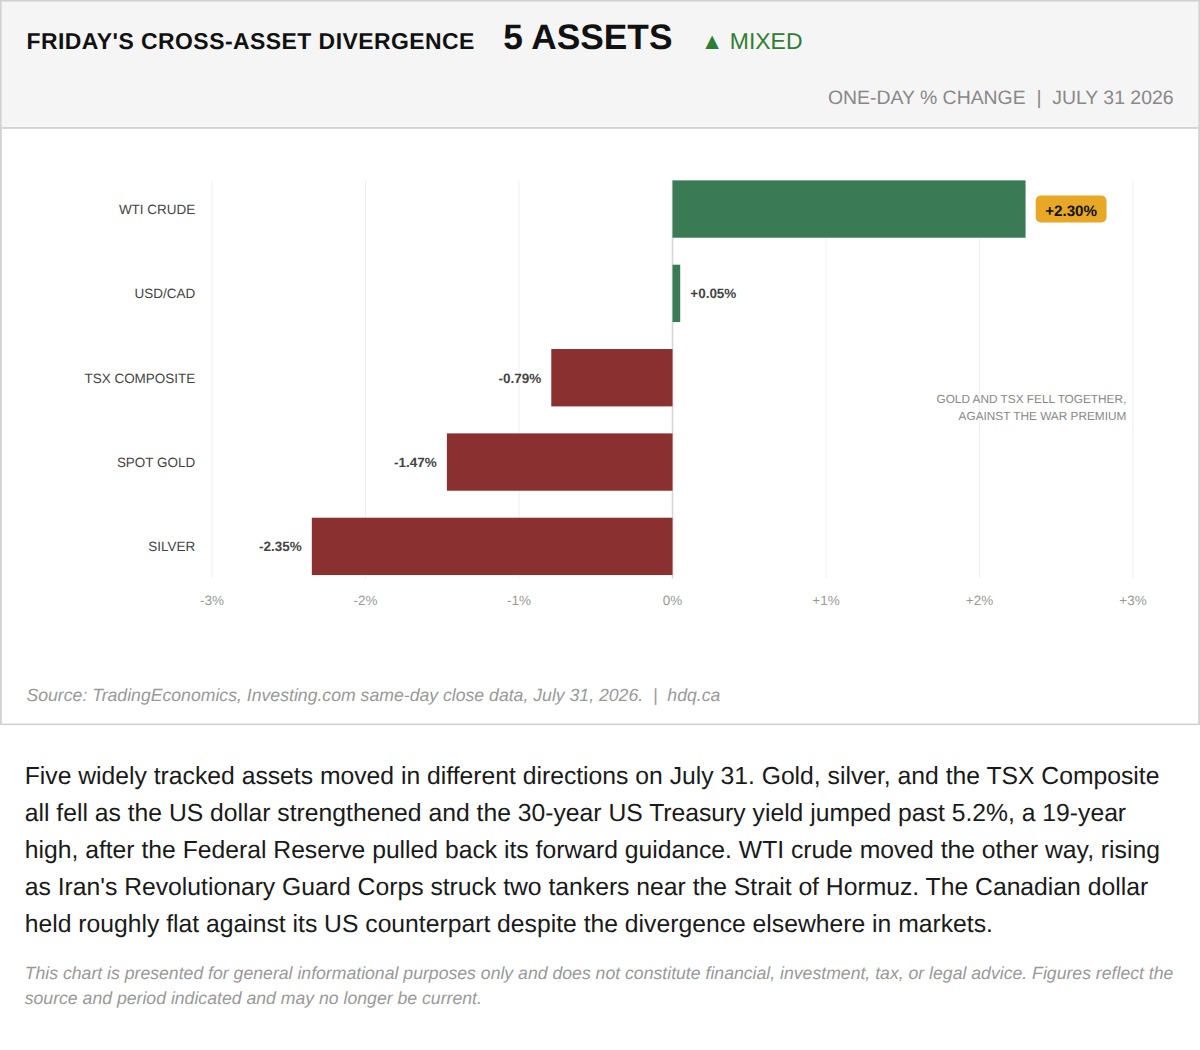
Five widely tracked assets moved in different directions on July 31.
Gold, silver, and the TSX fall as WTI rises in Friday's cross-asset divergence
August 1, 2026
View chart & download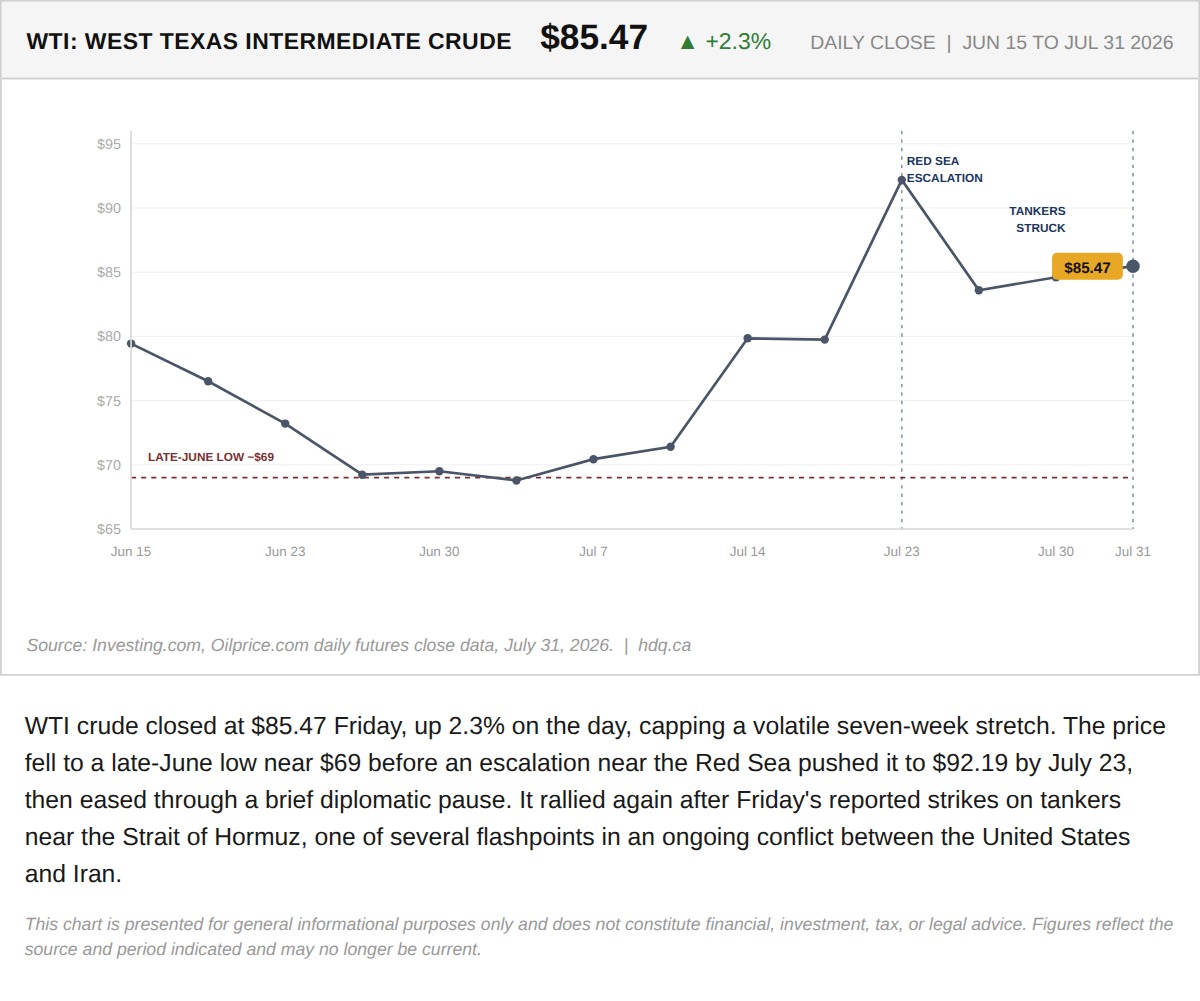
WTI crude closed at $85.47 Friday, up 2.3% on the day, capping a volatile seven-week stretch.
WTI crude closes at $85.47 after tanker strikes near the Strait of Hormuz
August 1, 2026
View chart & download