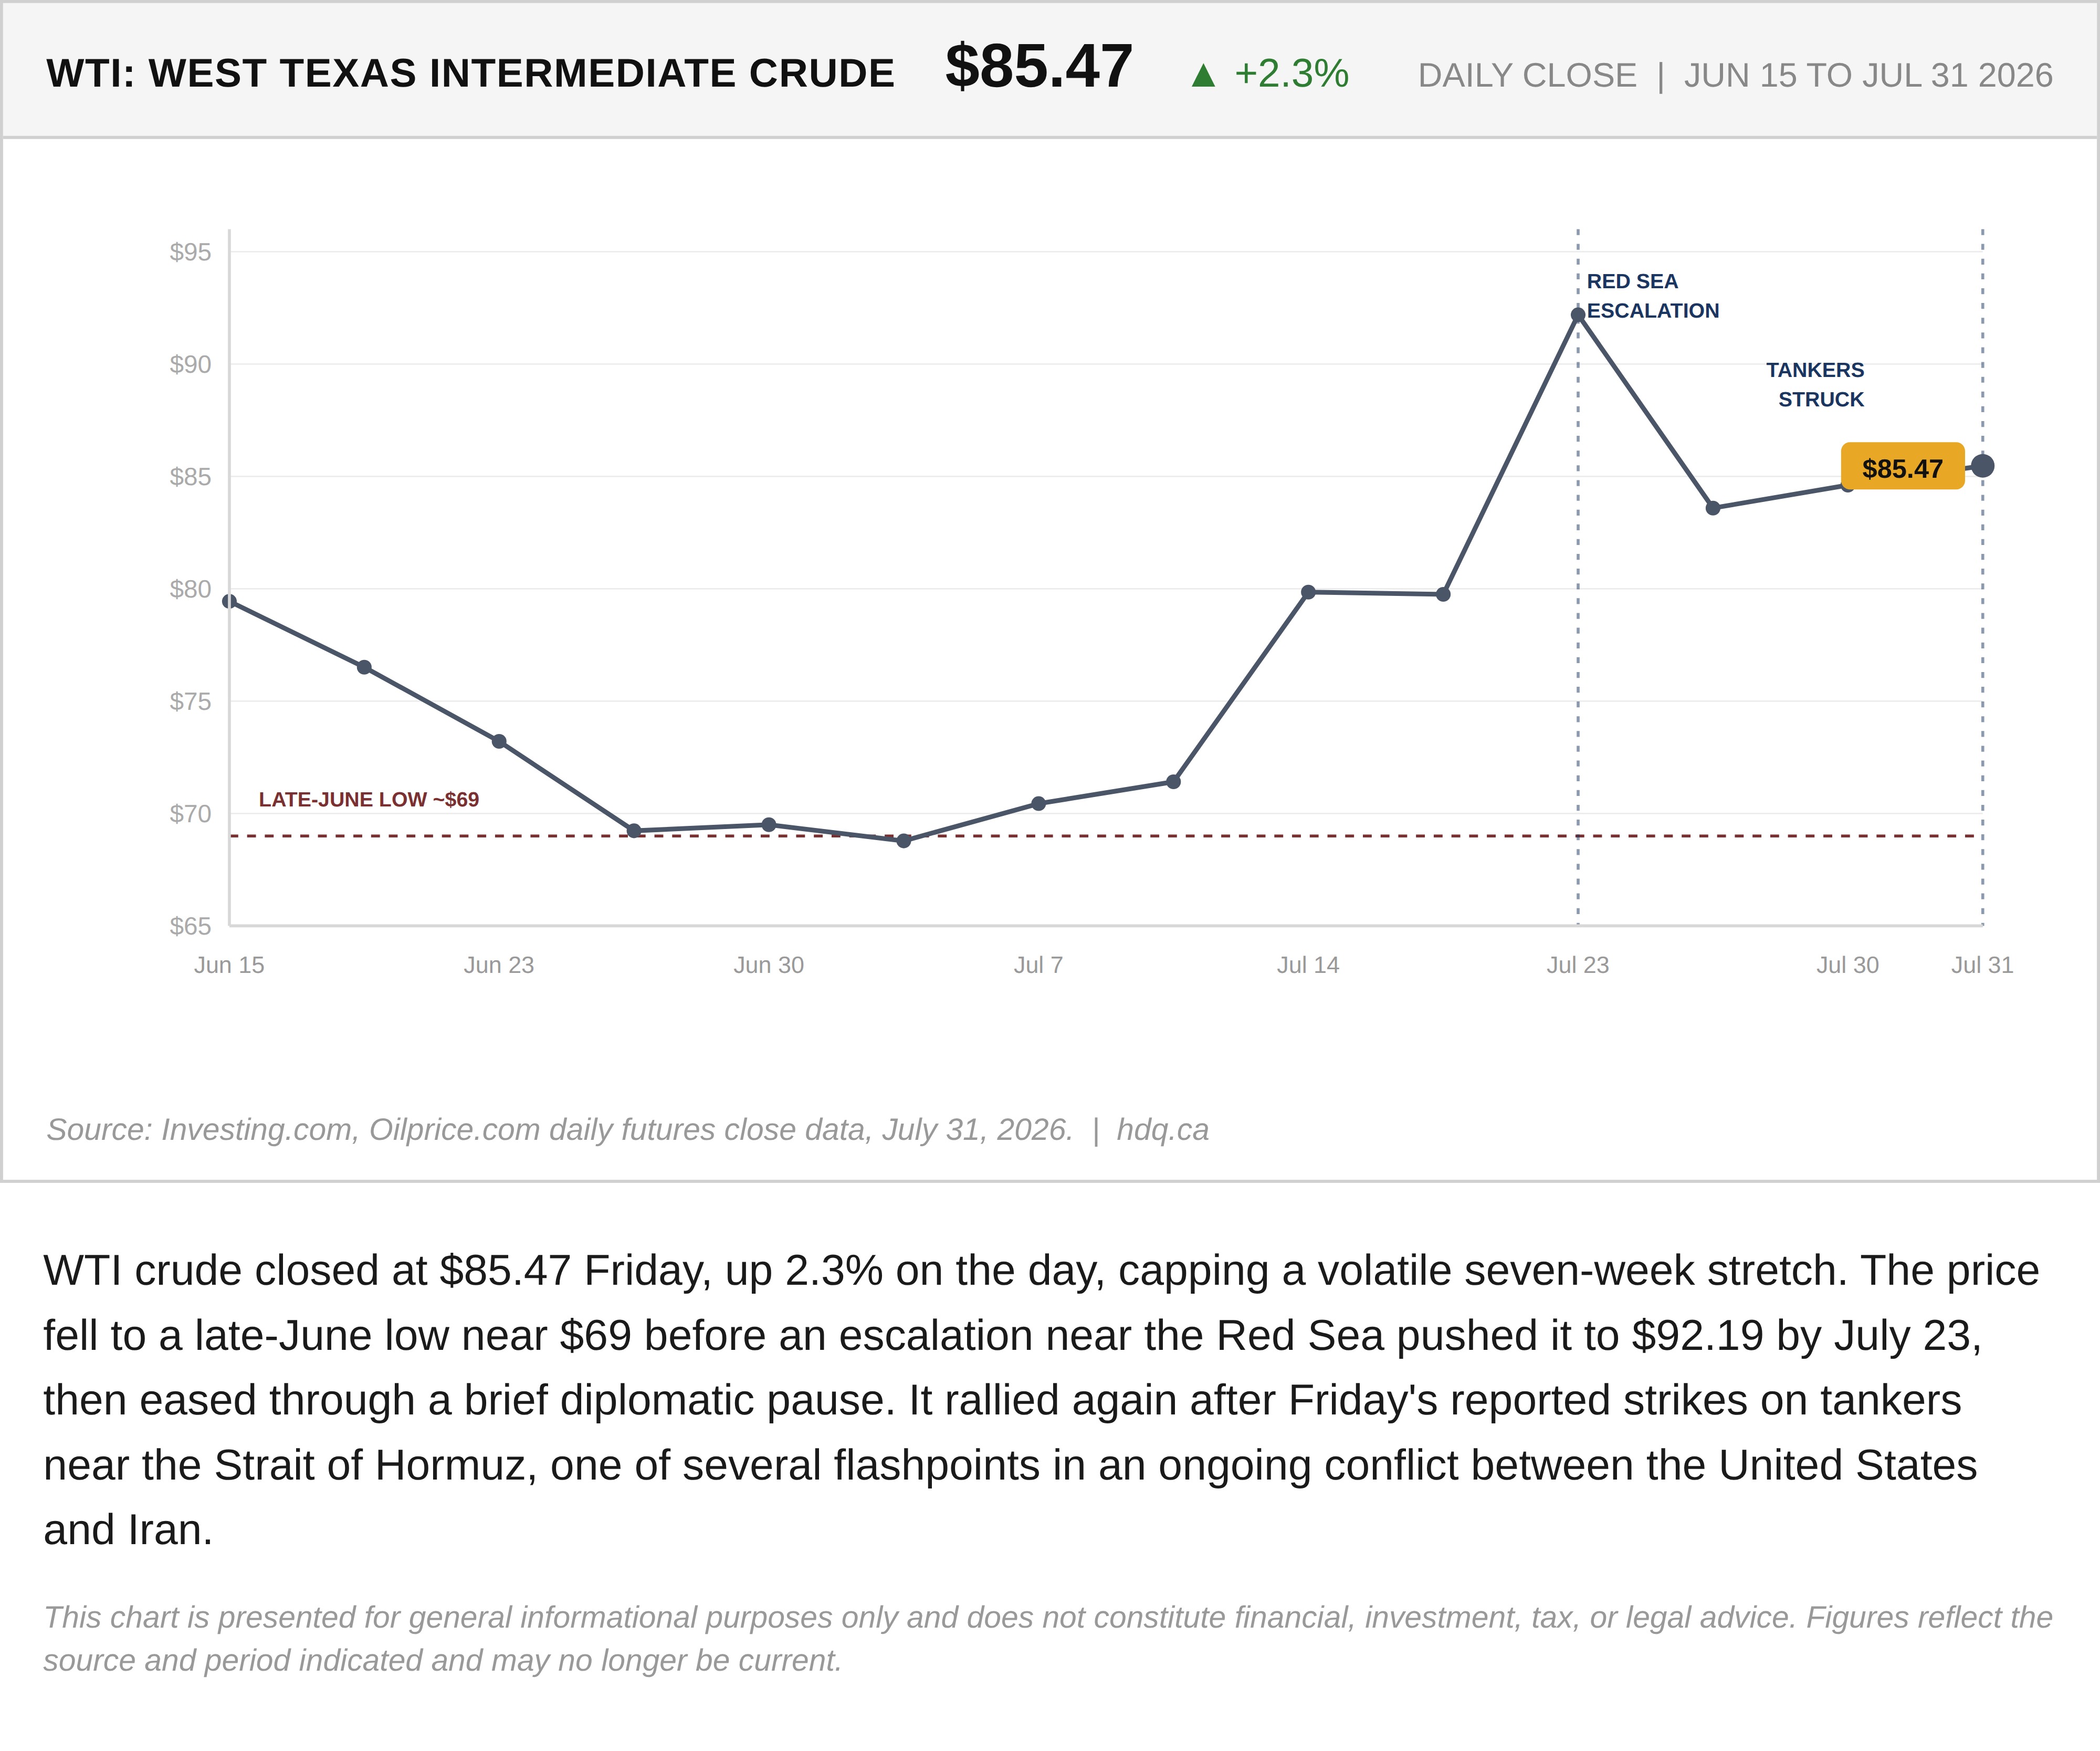
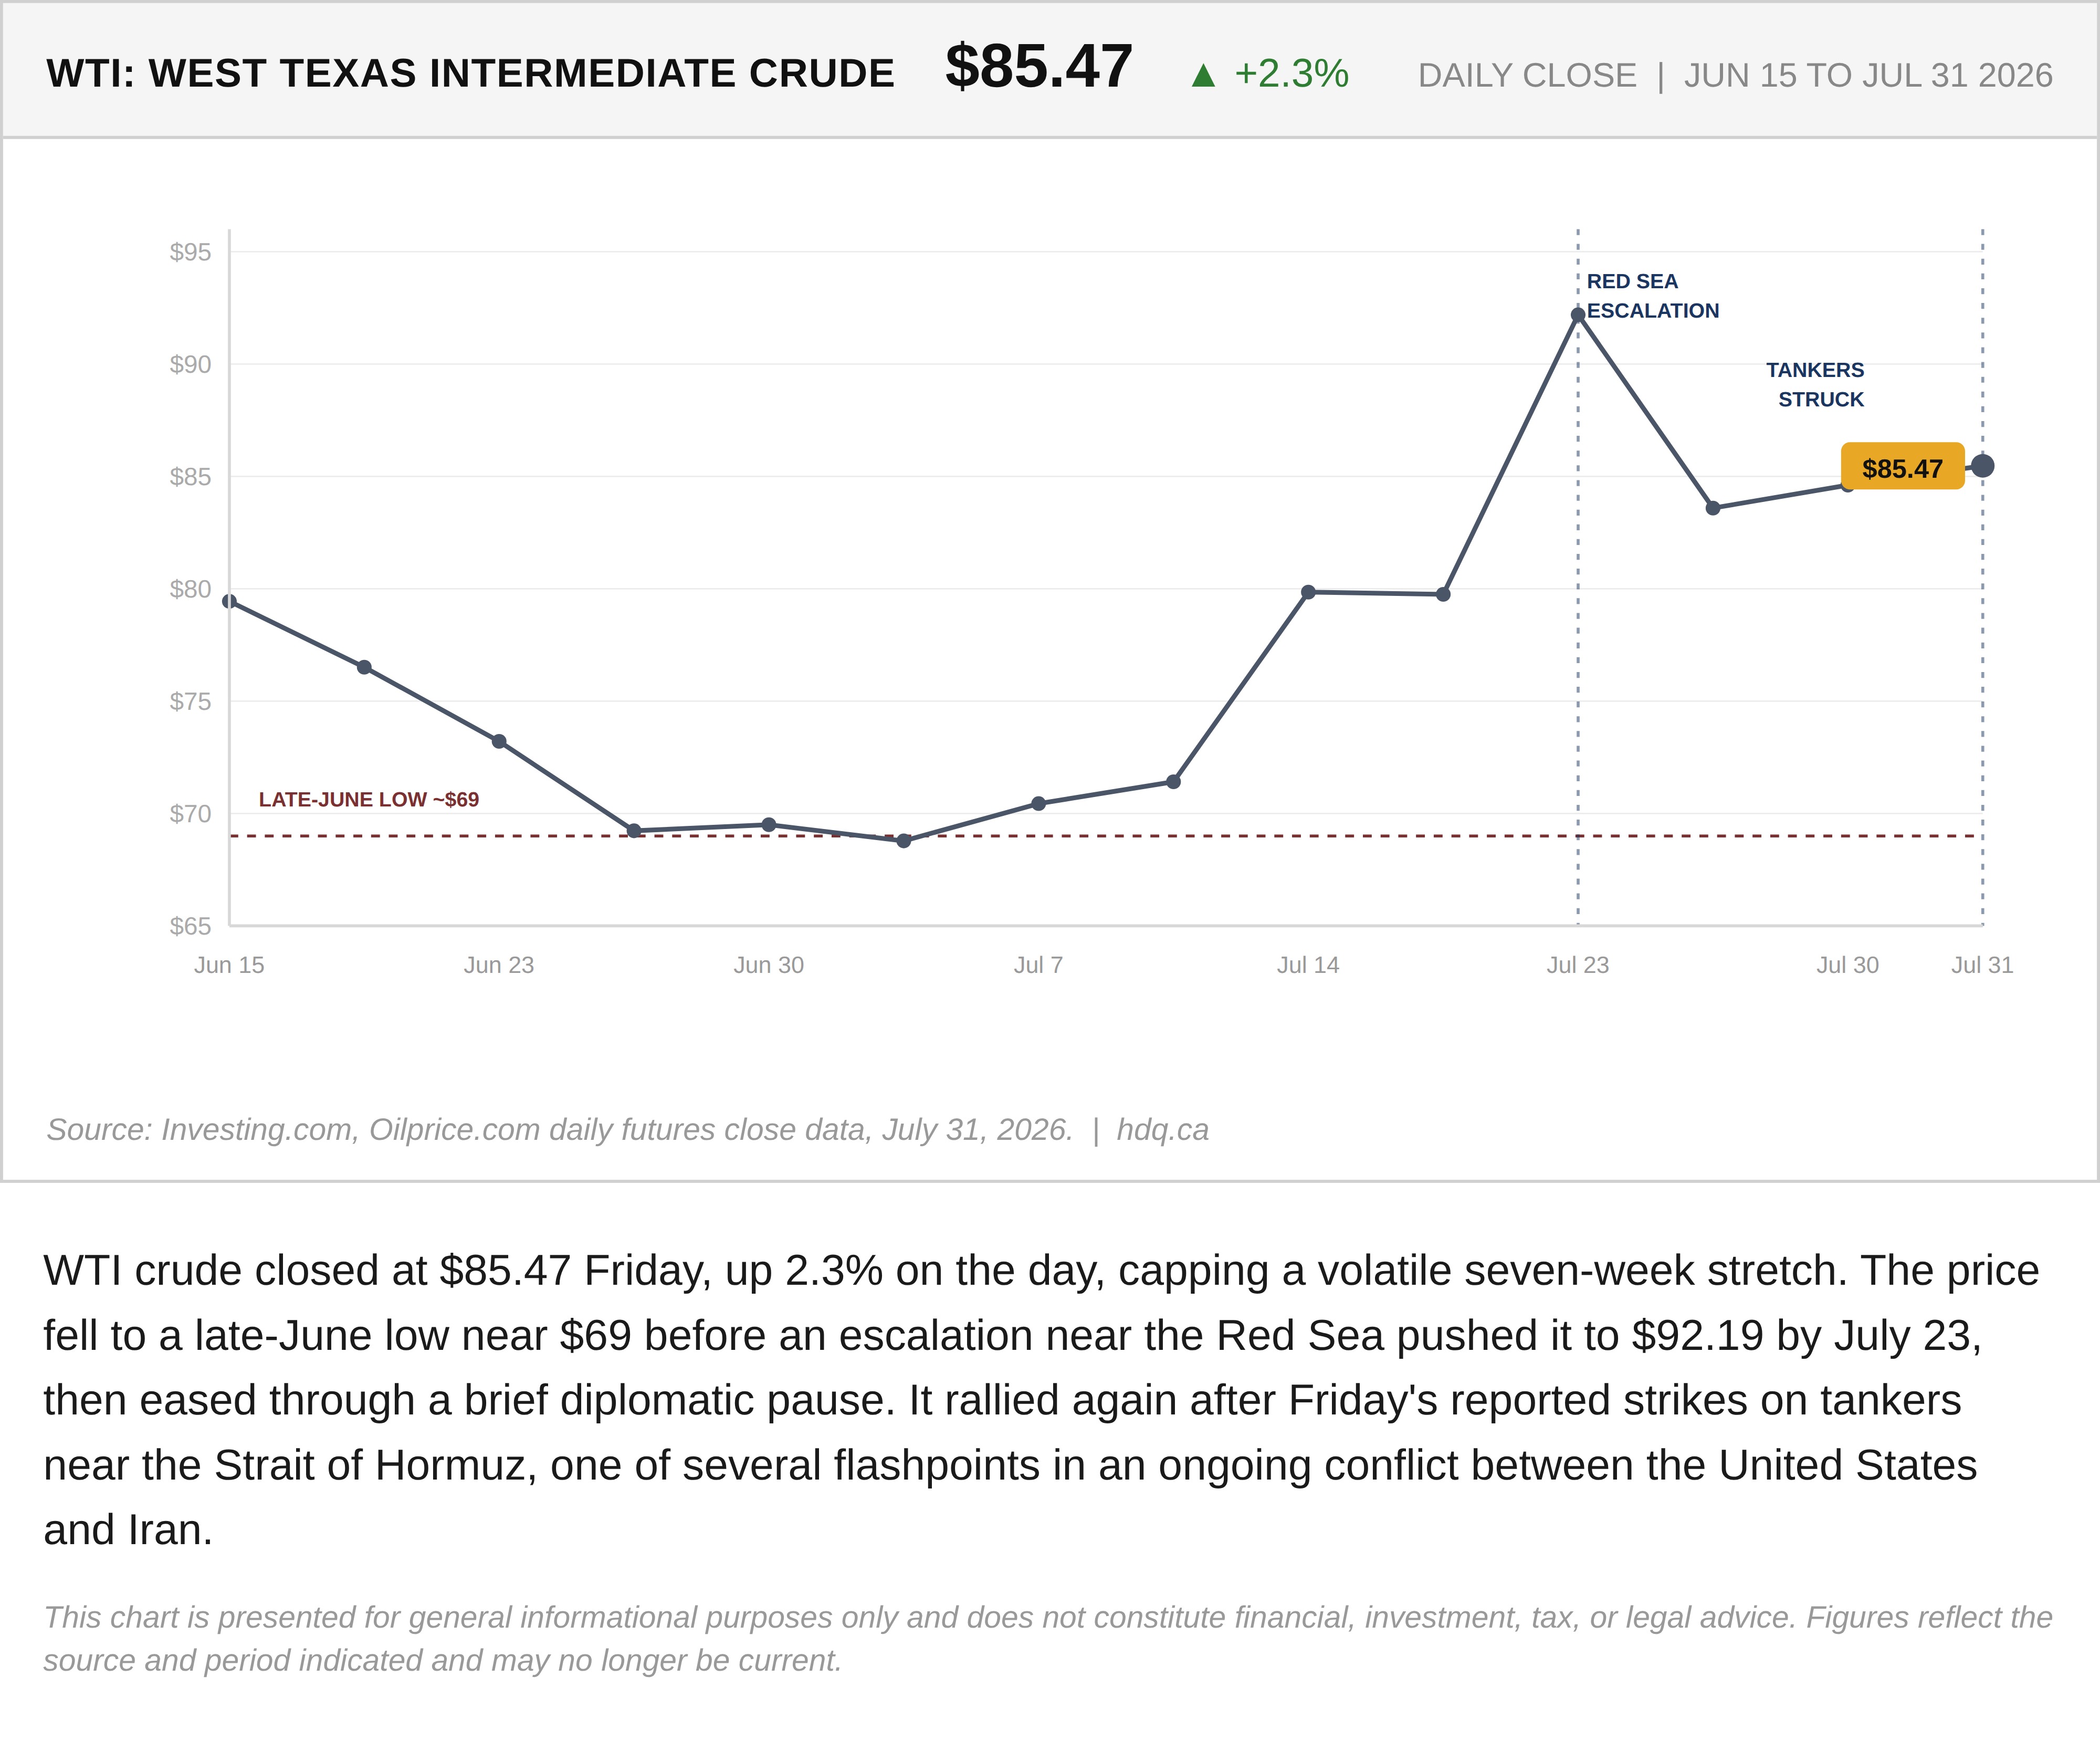
WTI crude closed at $85.47 Friday, up 2.3% on the day, capping a volatile seven-week stretch. The price fell to a late-June low near $69 before an escalation near the Red Sea pushed it to $92.19 by July 23, then eased through a brief diplomatic pause. It rallied again after Friday's reported strikes on tankers near the Strait of Hormuz, one of several flashpoints in an ongoing conflict between the United States and Iran.
This chart is presented for general informational purposes only and does not constitute financial, investment, tax, or legal advice. Figures reflect the source and period indicated and may no longer be current.
Related charts

The S&P/TSX Composite closed July at 35,226, up 1.06% for the month, a modest headline figure that conceals sharp intra-month swings.
S&P/TSX Composite closes July up 1.06% after a volatile month
July 31, 2026
View chart & download
Brent and WTI crude both surged in July, with WTI ending the month at $85.47, up 23.0%, after round-tripping from a five-month low near $68.74.
WTI and Brent crude surge in July as the Iran ceasefire collapses
July 31, 2026
View chart & download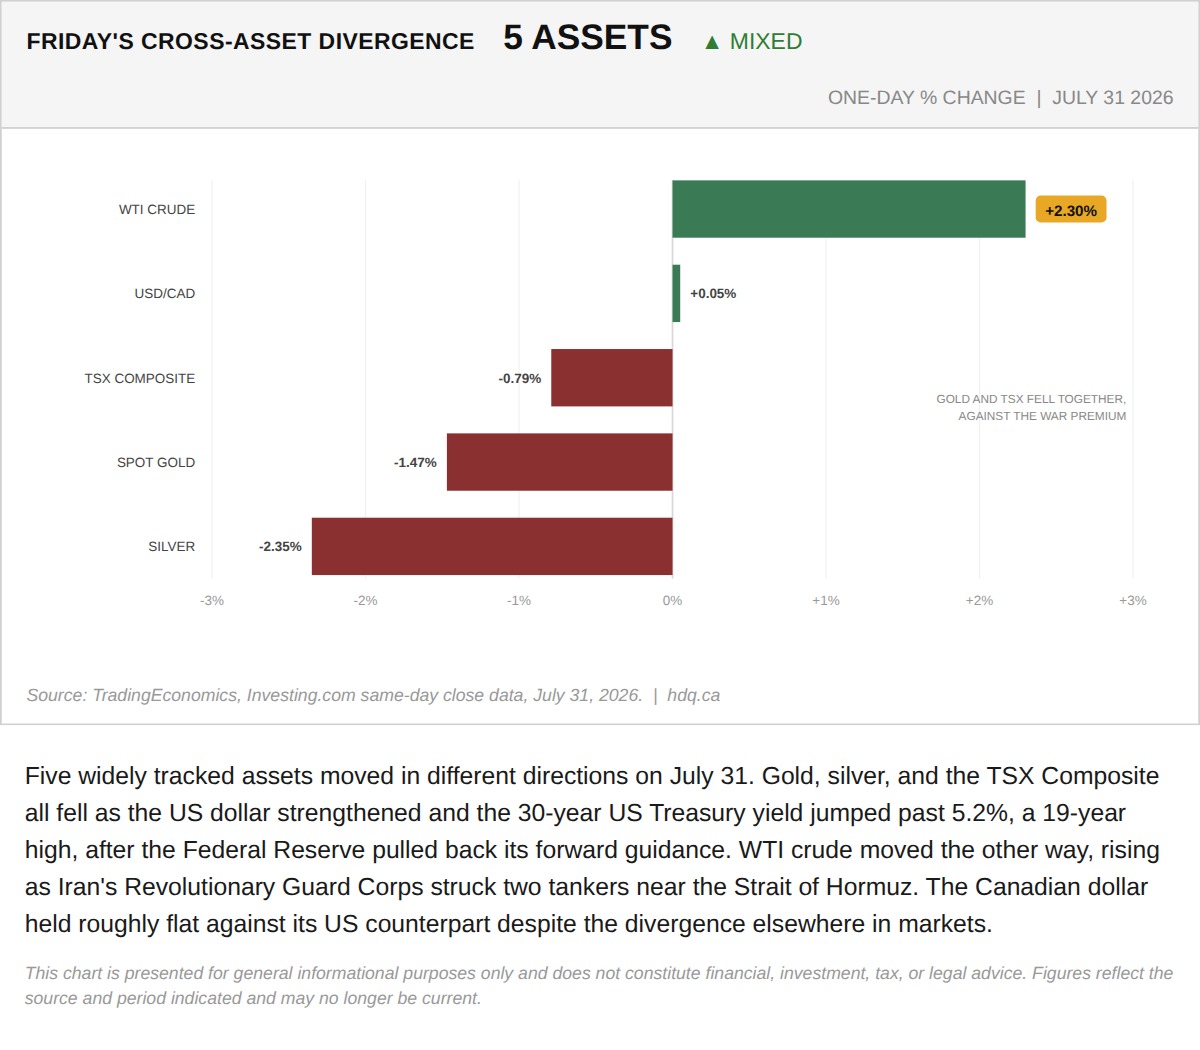
Five widely tracked assets moved in different directions on July 31.
Gold, silver, and the TSX fall as WTI rises in Friday's cross-asset divergence
August 1, 2026
View chart & download
Brent was the only one of the three to finish above its starting level, while the index and gold both fell.
Brent, TSX and Gold Rebased to the August 31 Close
September 30, 2026
View chart & download
The Bank of Canada held its policy rate at 2.25% for a seventh straight time, yet Canadian yields rose as United States yields surged.
Government of Canada Benchmark Yields, September 2026
September 30, 2026
View chart & download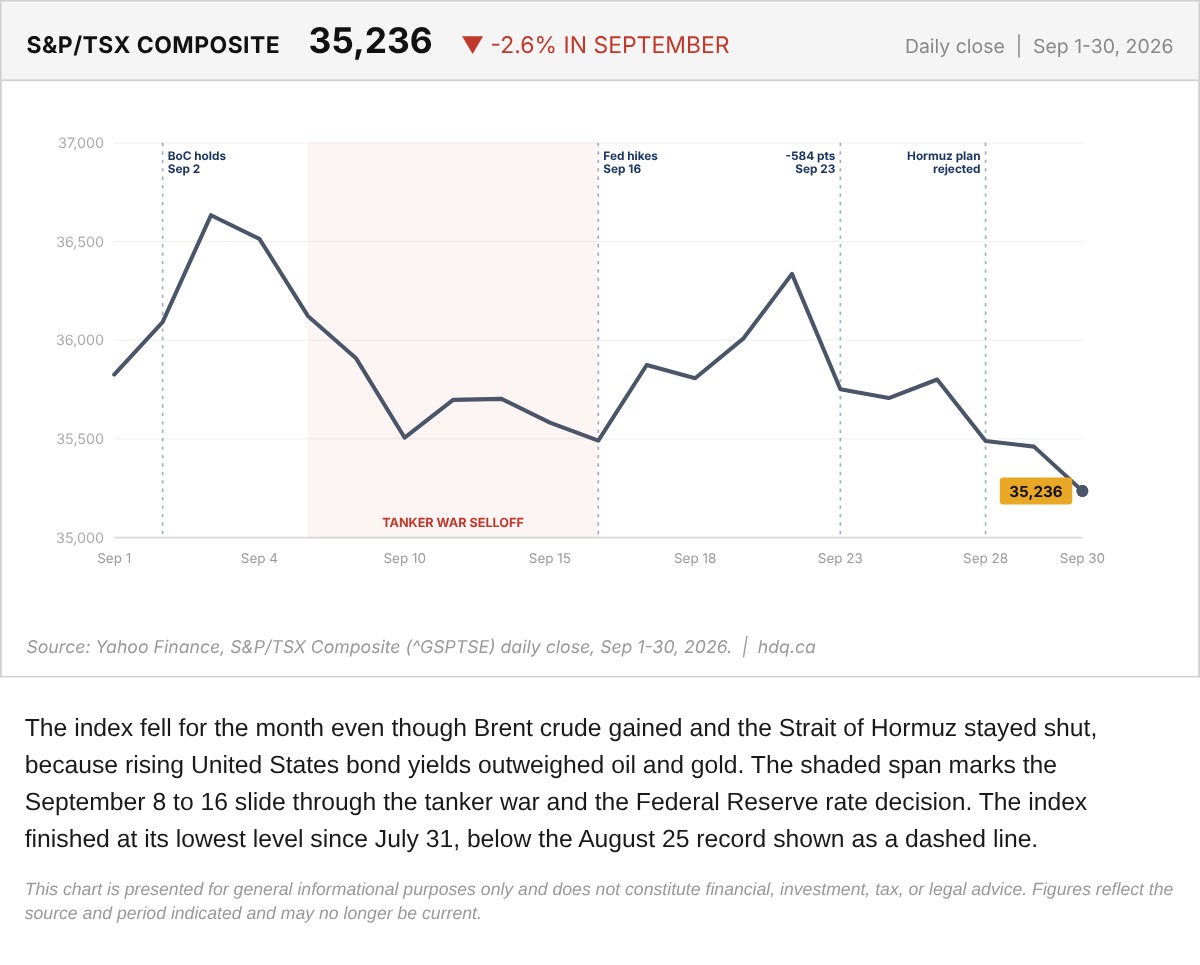
The index fell for the month even though Brent crude gained and the Strait of Hormuz stayed shut, because rising United States bond yields outweighed oil and gold.
S&P/TSX Composite Daily Close Through September 2026
September 30, 2026
View chart & download