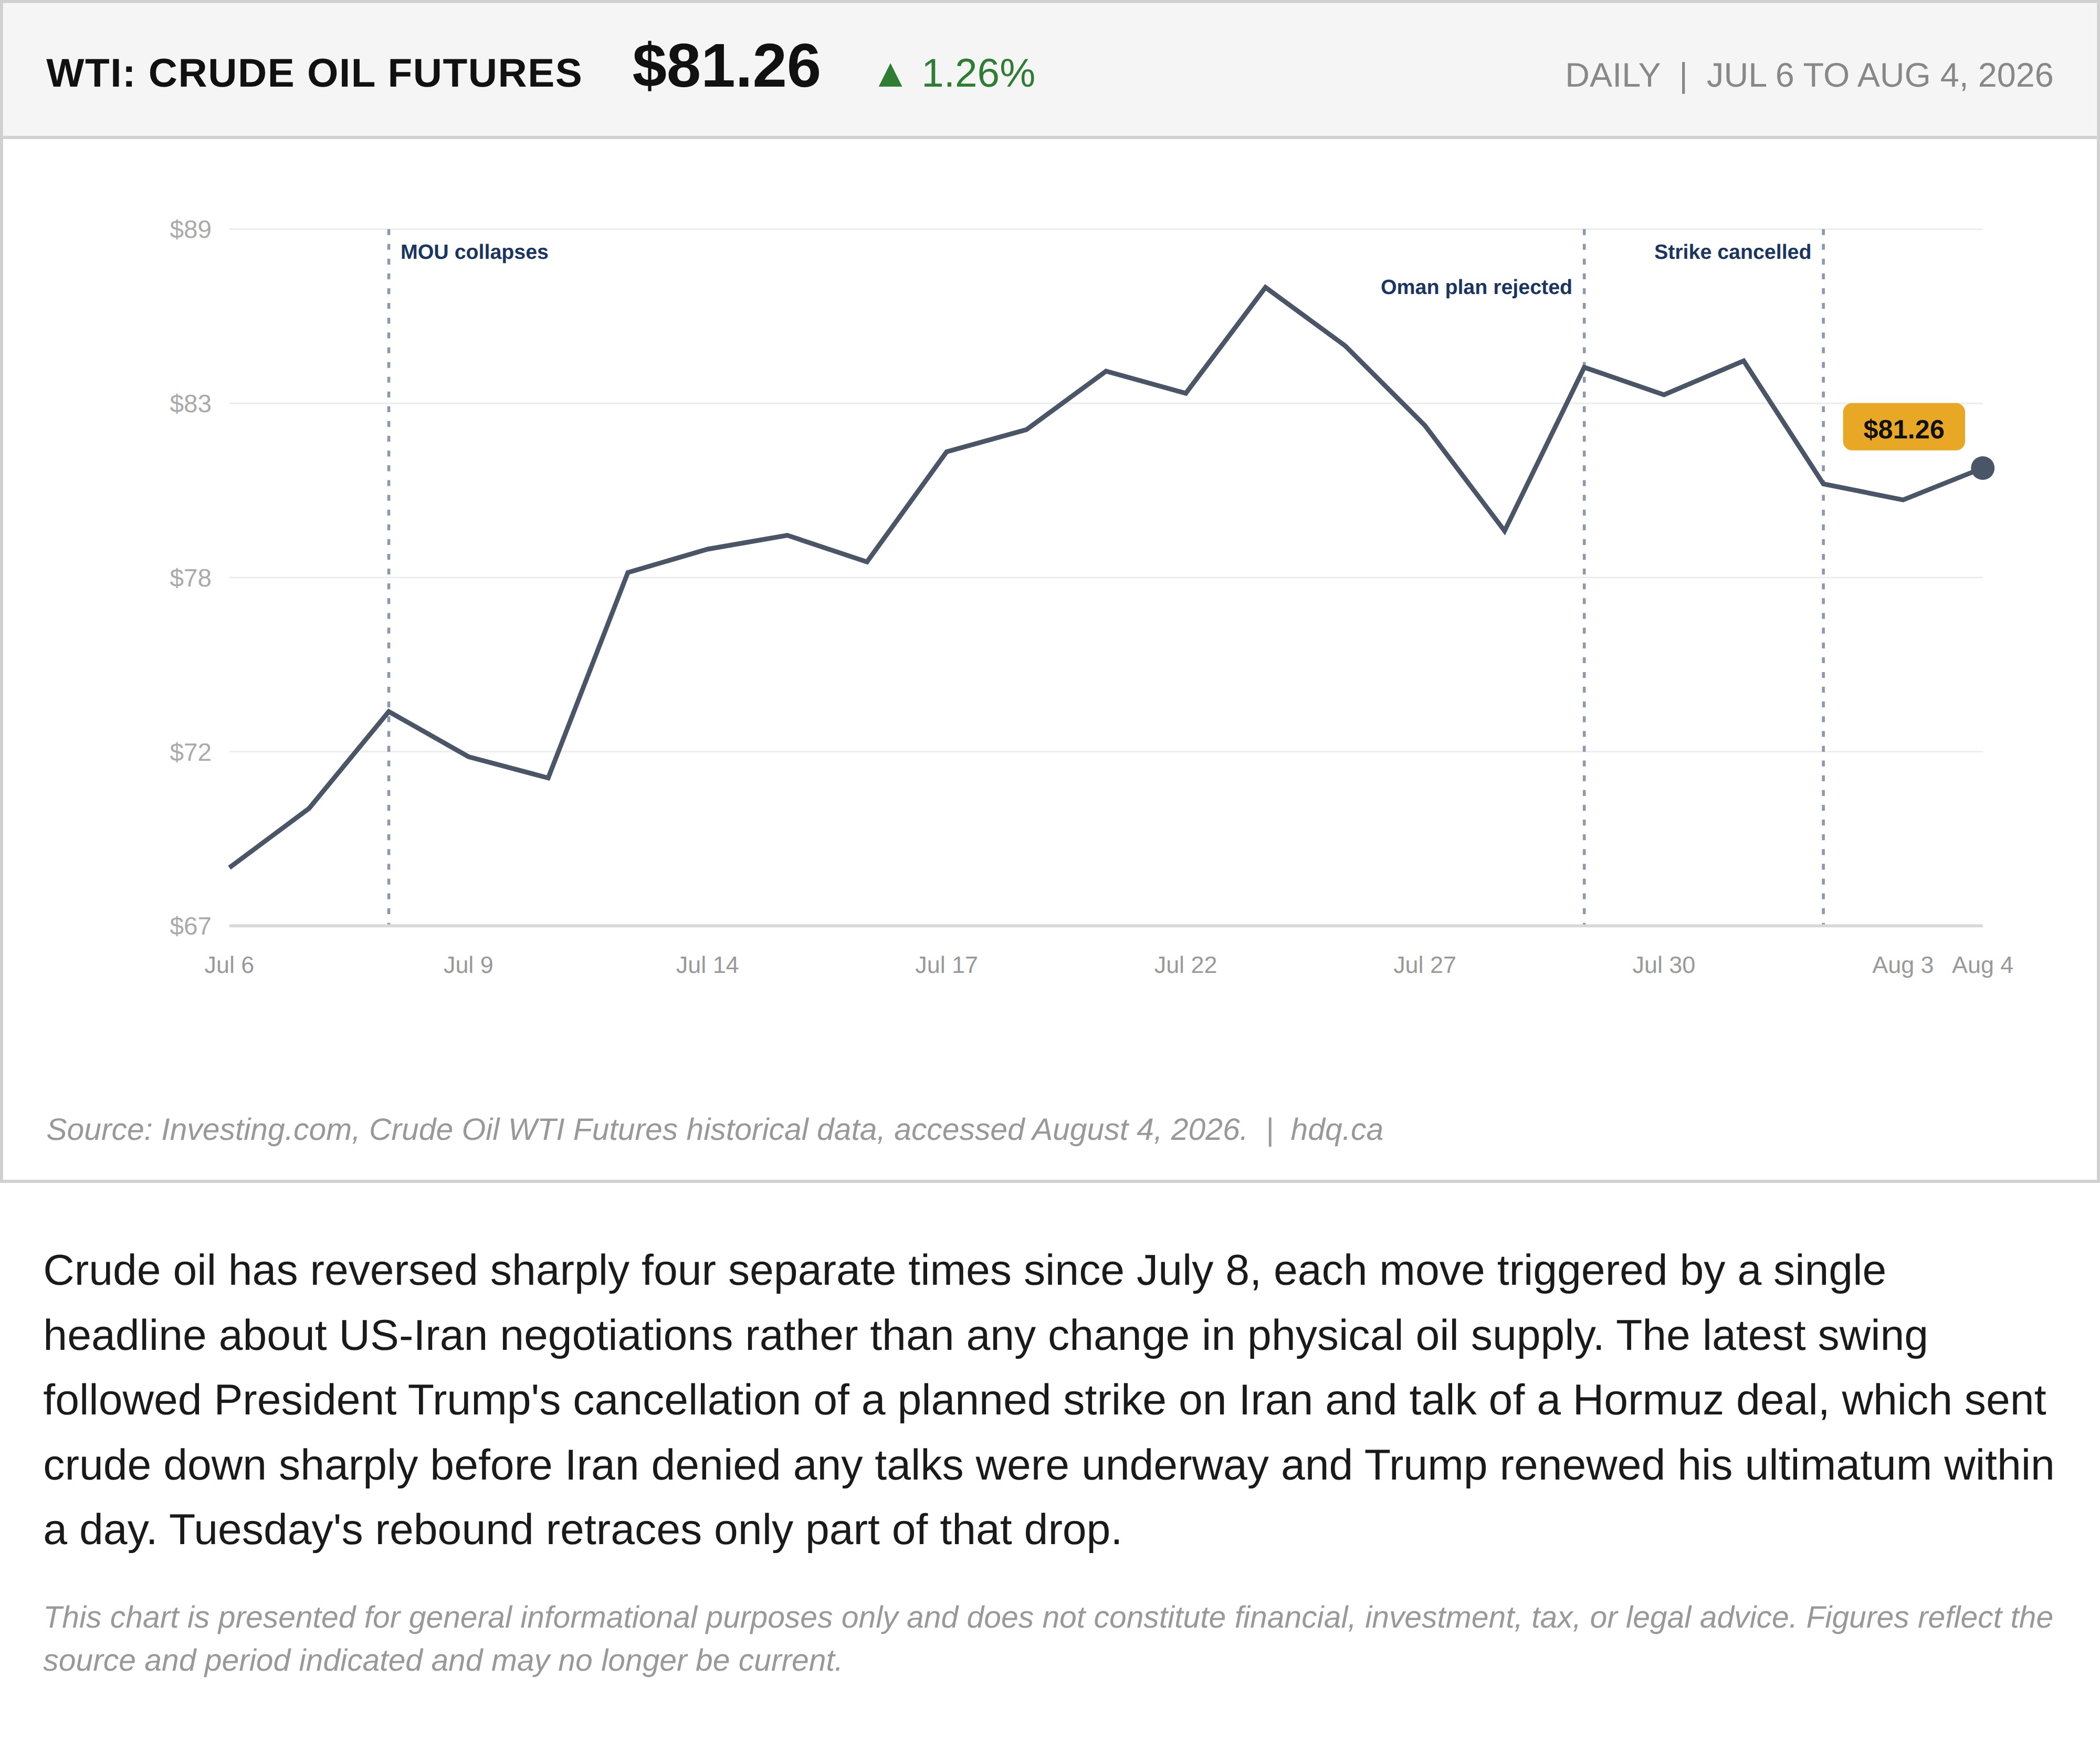
Crude oil has reversed sharply four separate times since July 8, each move triggered by a single headline about US-Iran negotiations rather than any change in physical oil supply. The latest swing followed President Trump's cancellation of a planned strike on Iran and talk of a Hormuz deal, which sent crude down sharply before Iran denied any talks were underway and Trump renewed his ultimatum within a day. Tuesday's rebound retraces only part of that drop.
This chart is presented for general informational purposes only and does not constitute financial, investment, tax, or legal advice. Figures reflect the source and period indicated and may no longer be current.
Related charts
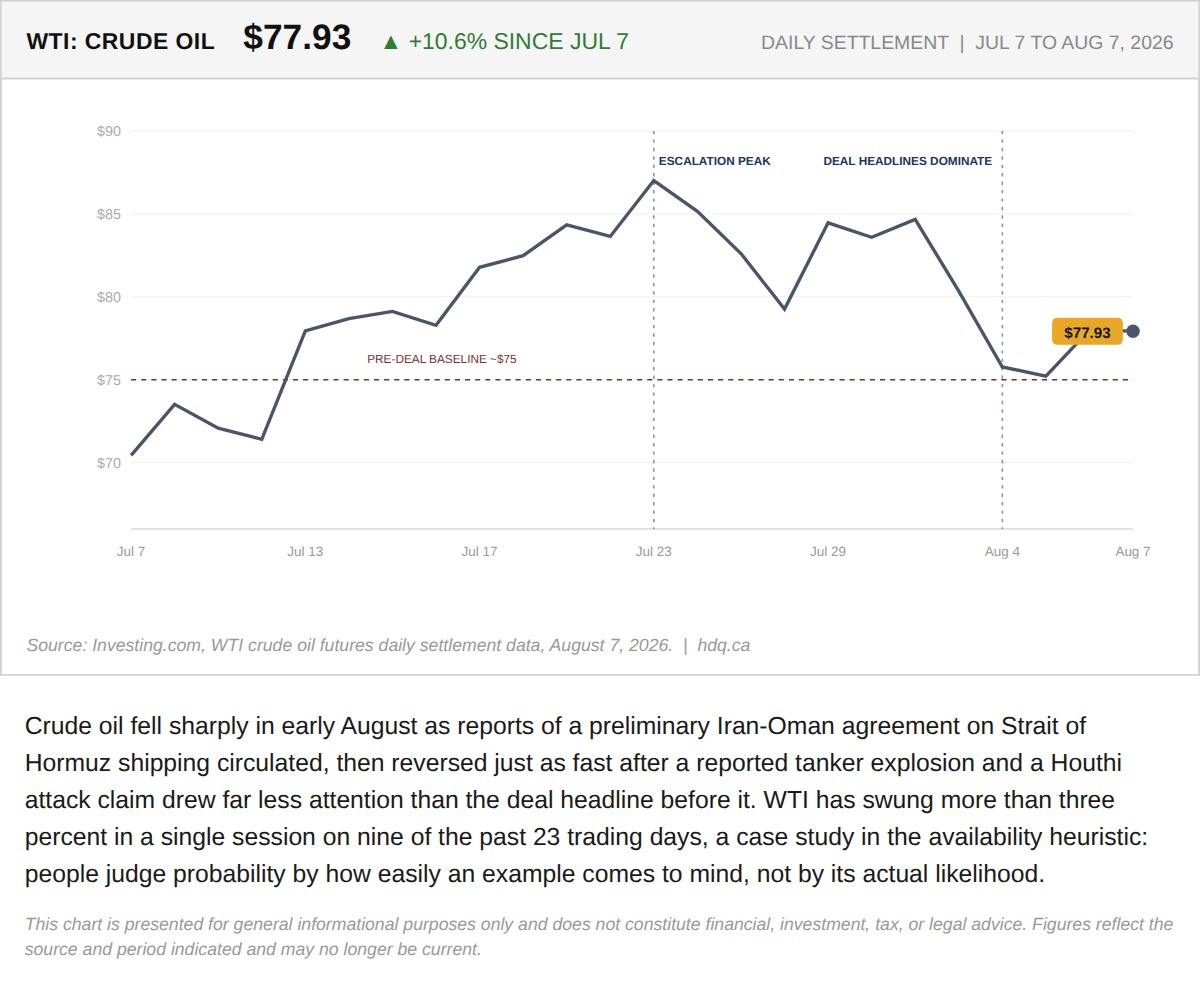
Crude oil fell sharply in early August as reports of a preliminary Iran-Oman agreement on Strait of Hormuz shipping circulated, then…
WTI Swung More Than 10% in a Week on Headlines the Availability Heuristic Explains
August 7, 2026
View chart & download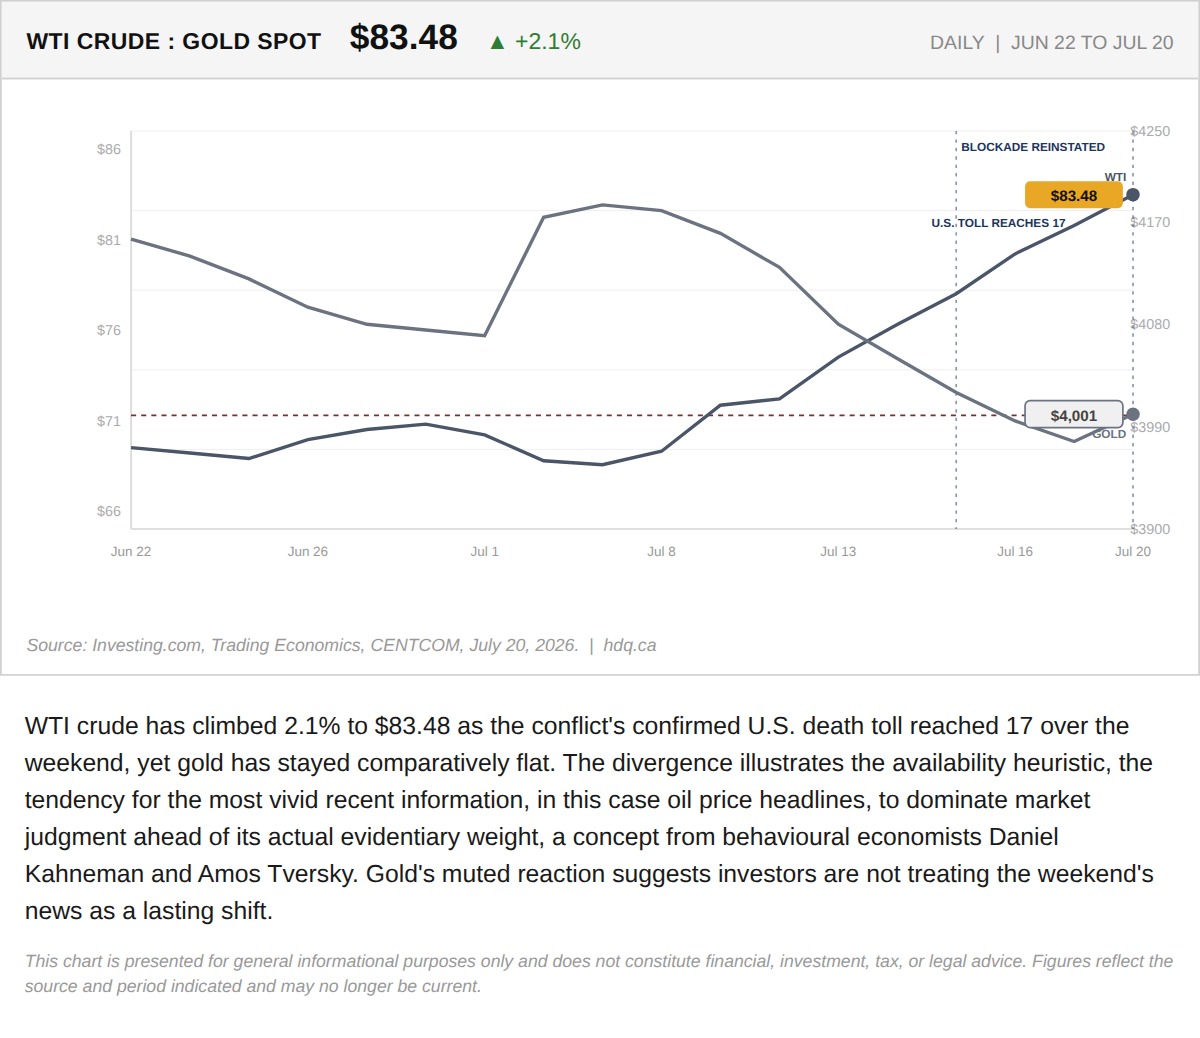
WTI crude has climbed 2.1% to $83.48 as the conflict's confirmed U.S.
Oil Spiked Past $85 as the War's U.S. Death Toll Hit 17. It Gave Back Most of the Move by Noon.
July 20, 2026
View chart & download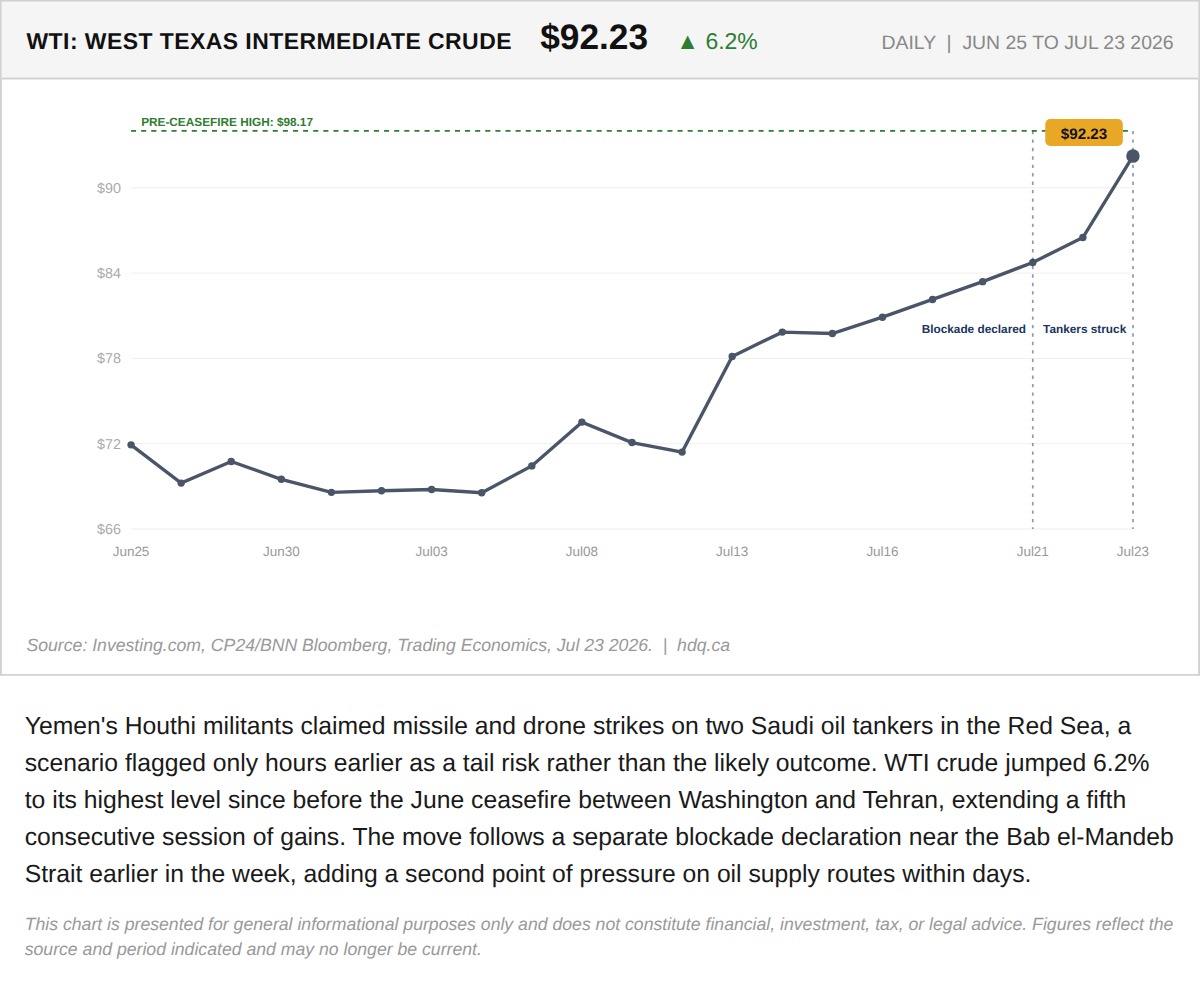
WTI crude has climbed to $74.40, up 11.1% since June 24, as the U.S.
The Strikes on Iran Got Bigger Overnight. The Market's Reaction Got Smaller.
July 9, 2026
View chart & download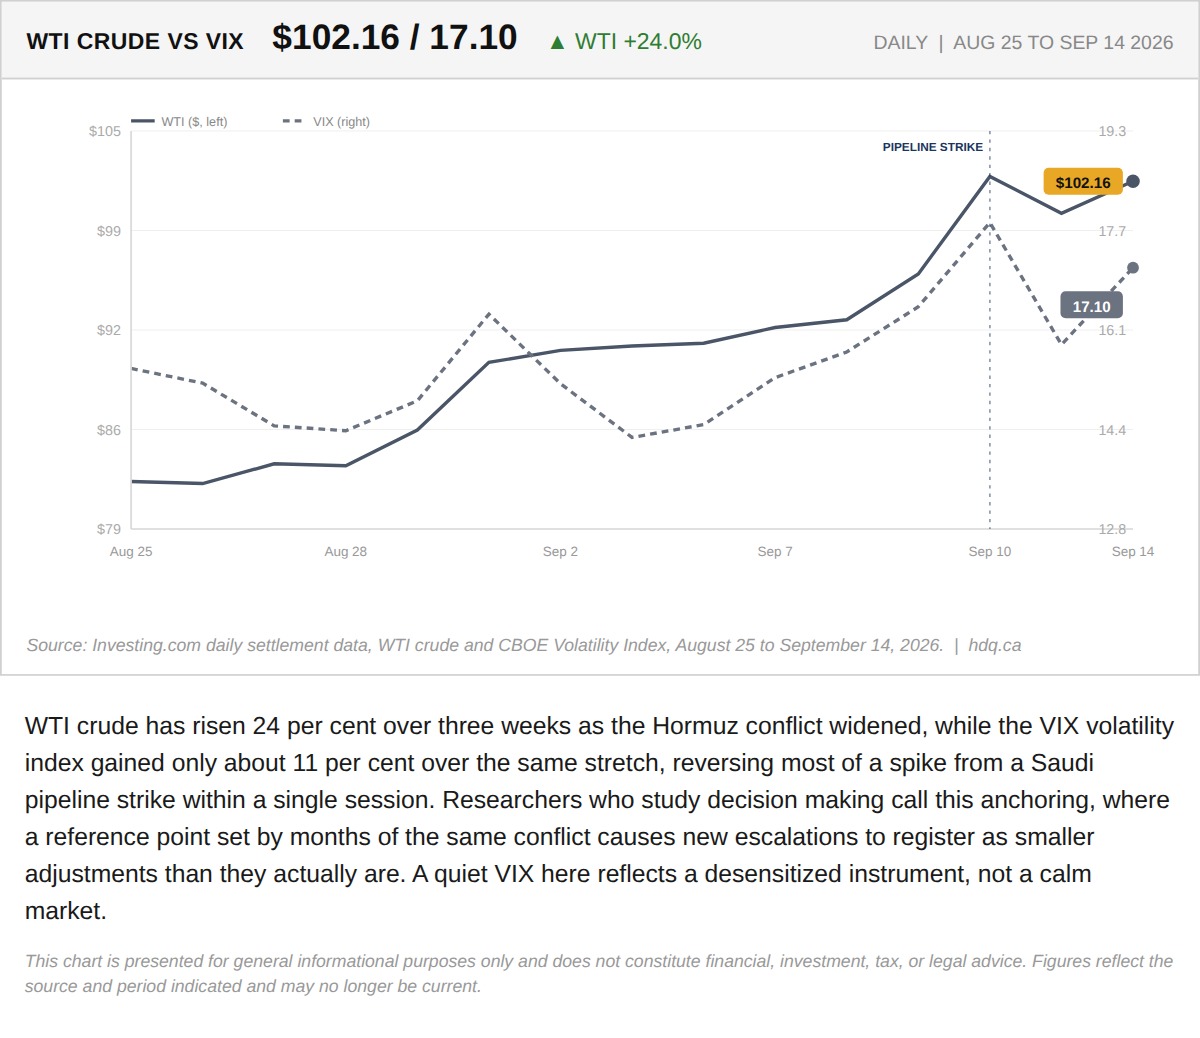
WTI crude has risen 24 per cent over three weeks as the Hormuz conflict widened, while the VIX volatility index gained only about 11 per…
Oil Has Risen 24 Per Cent in Three Weeks and the Fear Gauge Barely Moved
September 15, 2026
View chart & download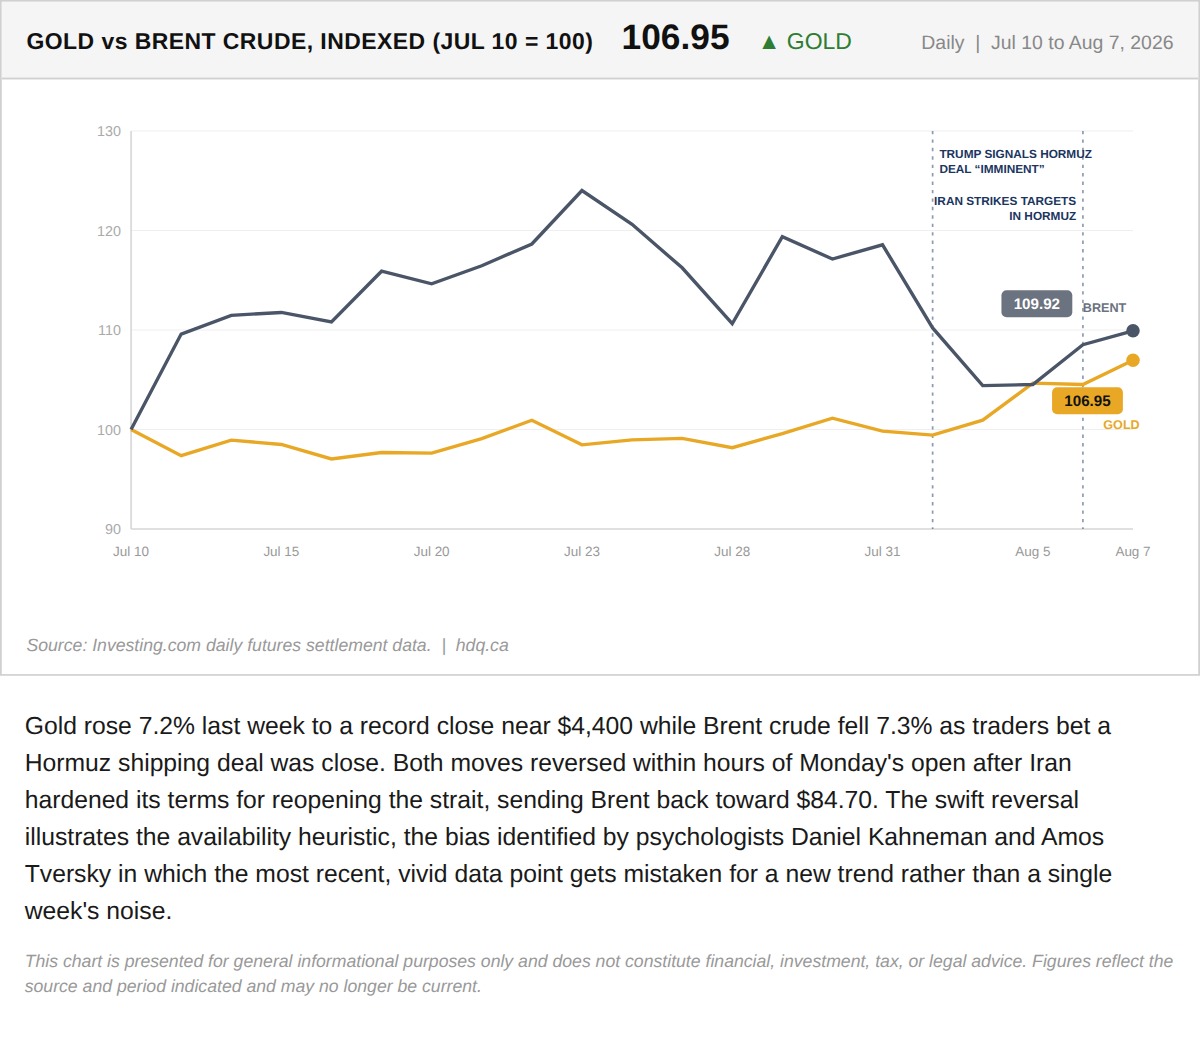
Gold rose 7.2% last week to a record close near $4,400 while Brent crude fell 7.3% as traders bet a Hormuz shipping deal was close.
Gold's Record Week Made the Story Feel Settled. Monday Already Disagrees.
August 10, 2026
View chart & download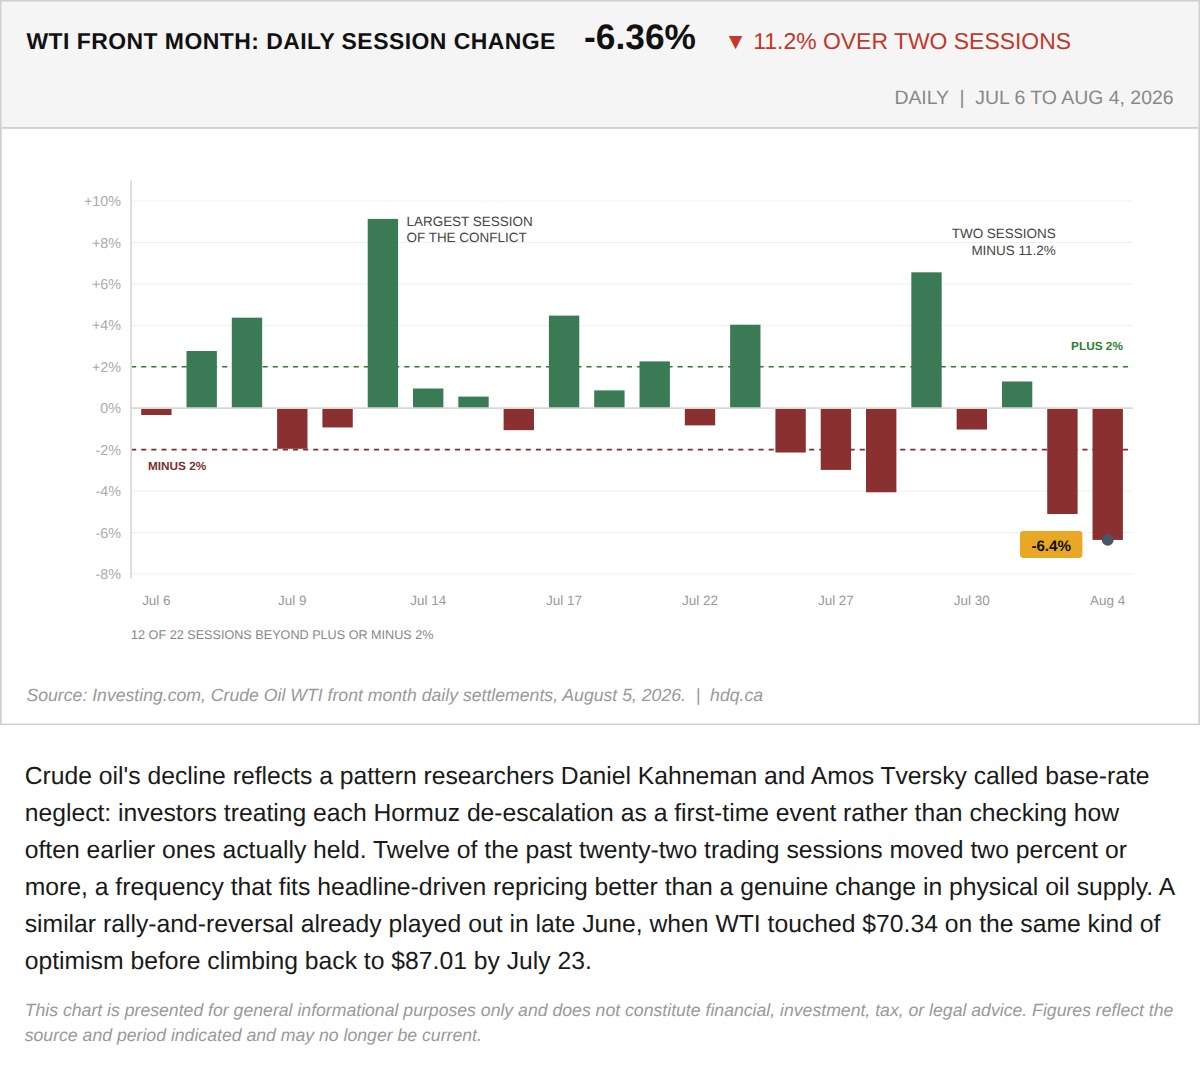
Crude oil's decline reflects a pattern researchers Daniel Kahneman and Amos Tversky called base-rate neglect: investors treating each…
August 5, 2026
View chart & download