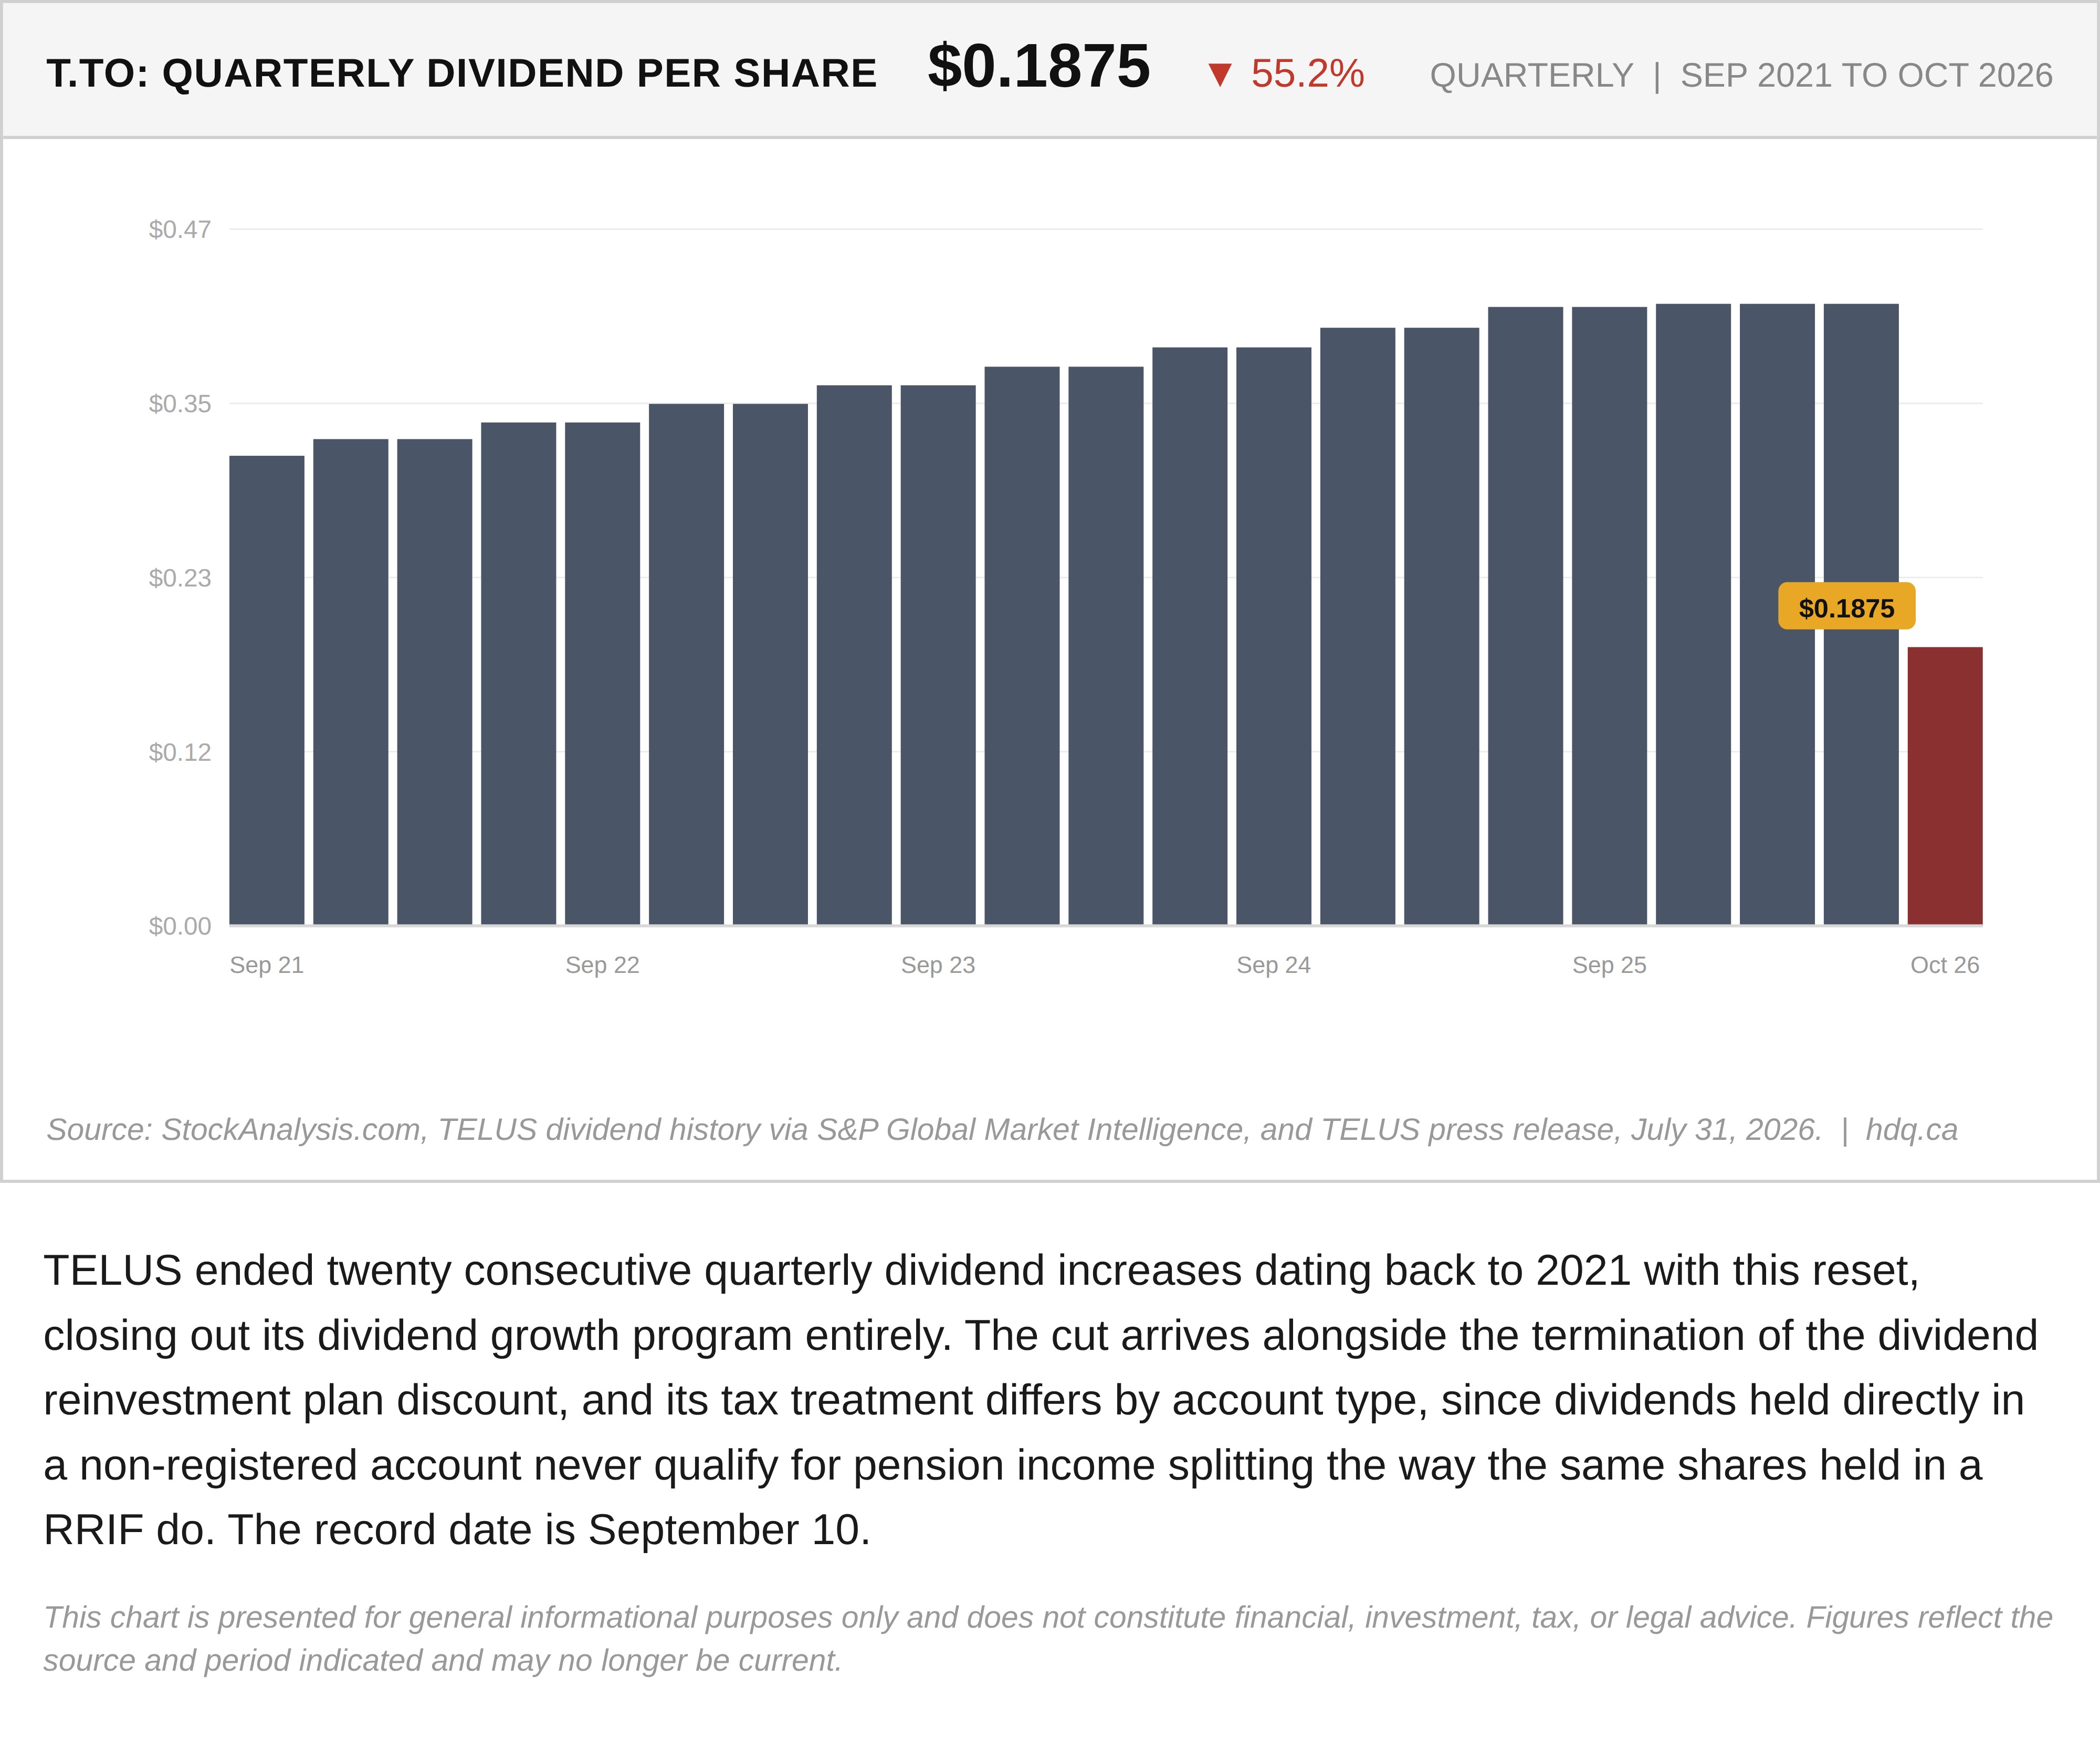
TELUS ended twenty consecutive quarterly dividend increases dating back to 2021 with this reset, closing out its dividend growth program entirely. The cut arrives alongside the termination of the dividend reinvestment plan discount, and its tax treatment differs by account type, since dividends held directly in a non-registered account never qualify for pension income splitting the way the same shares held in a RRIF do. The record date is September 10.
This chart is presented for general informational purposes only and does not constitute financial, investment, tax, or legal advice. Figures reflect the source and period indicated and may no longer be current.
Related charts
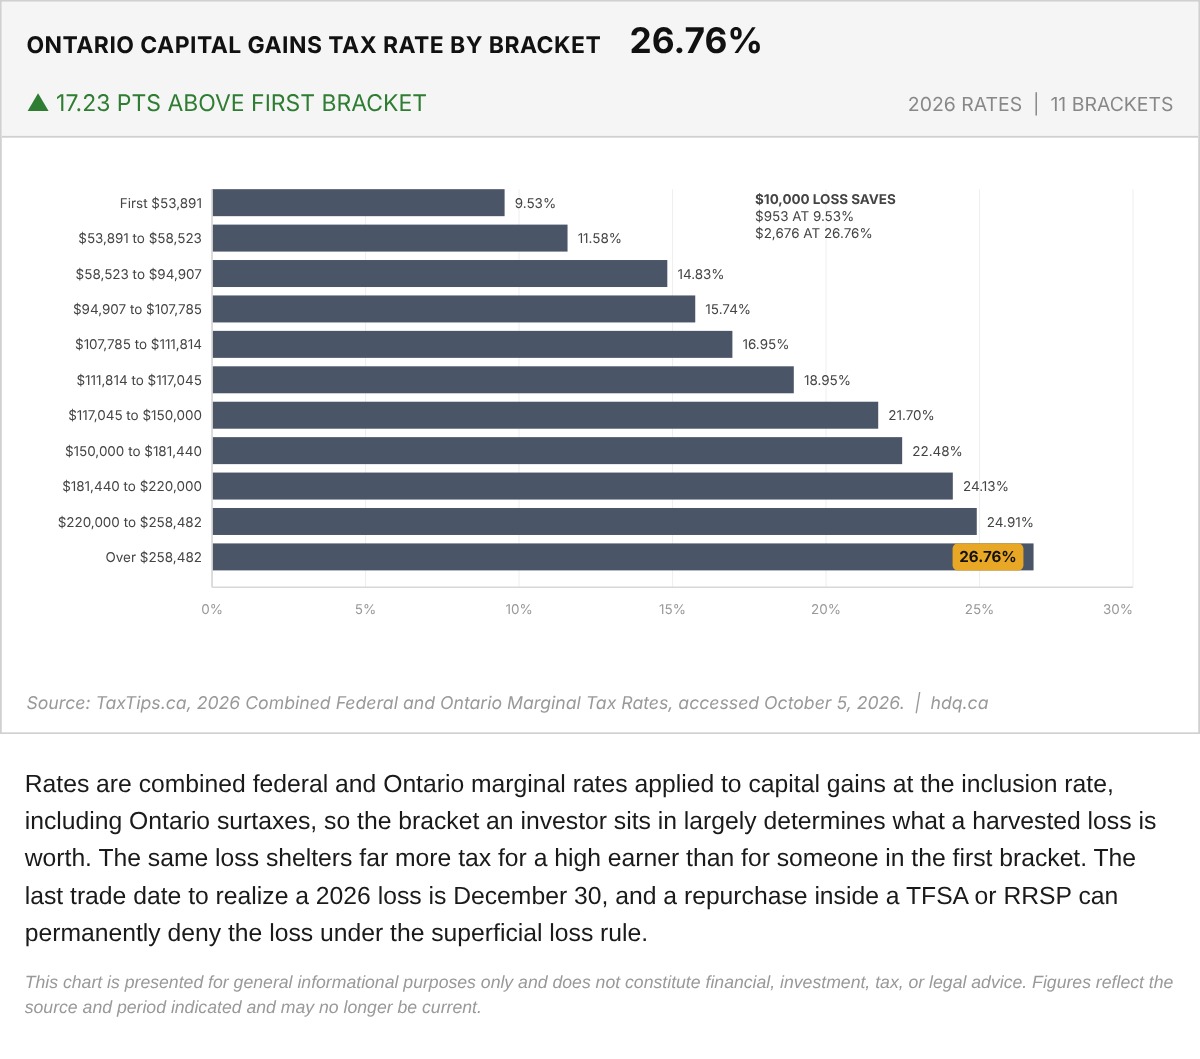
Rates are combined federal and Ontario marginal rates applied to capital gains at the inclusion rate, including Ontario surtaxes, so the…
Ontario Capital Gains Tax Rates by Income Bracket, 2026
October 5, 2026
View chart & download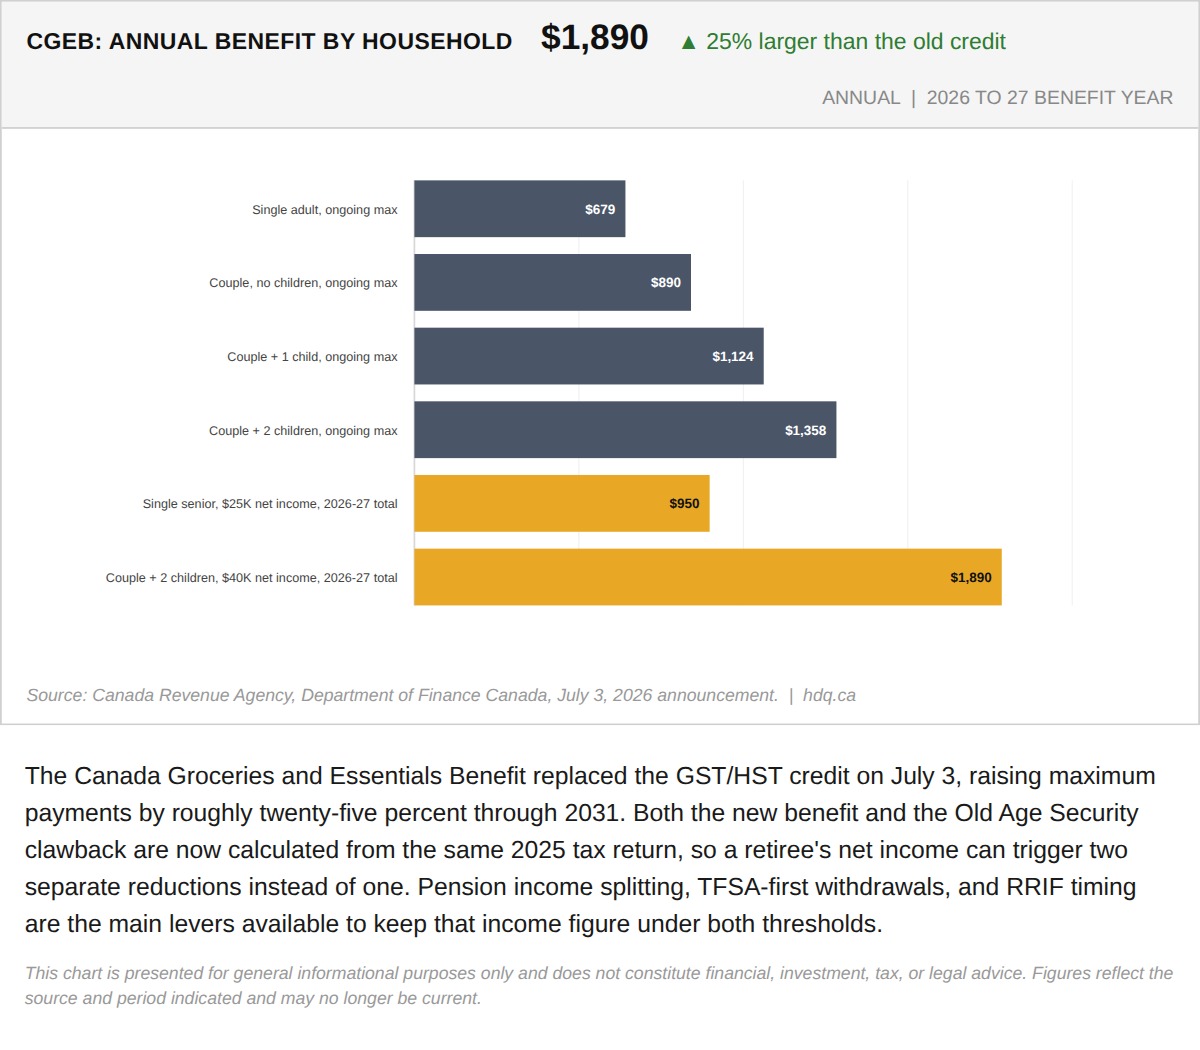
The Canada Groceries and Essentials Benefit replaced the GST/HST credit on July 3, raising maximum payments by roughly twenty-five percent through 2031.
July 8, 2026
View chart & download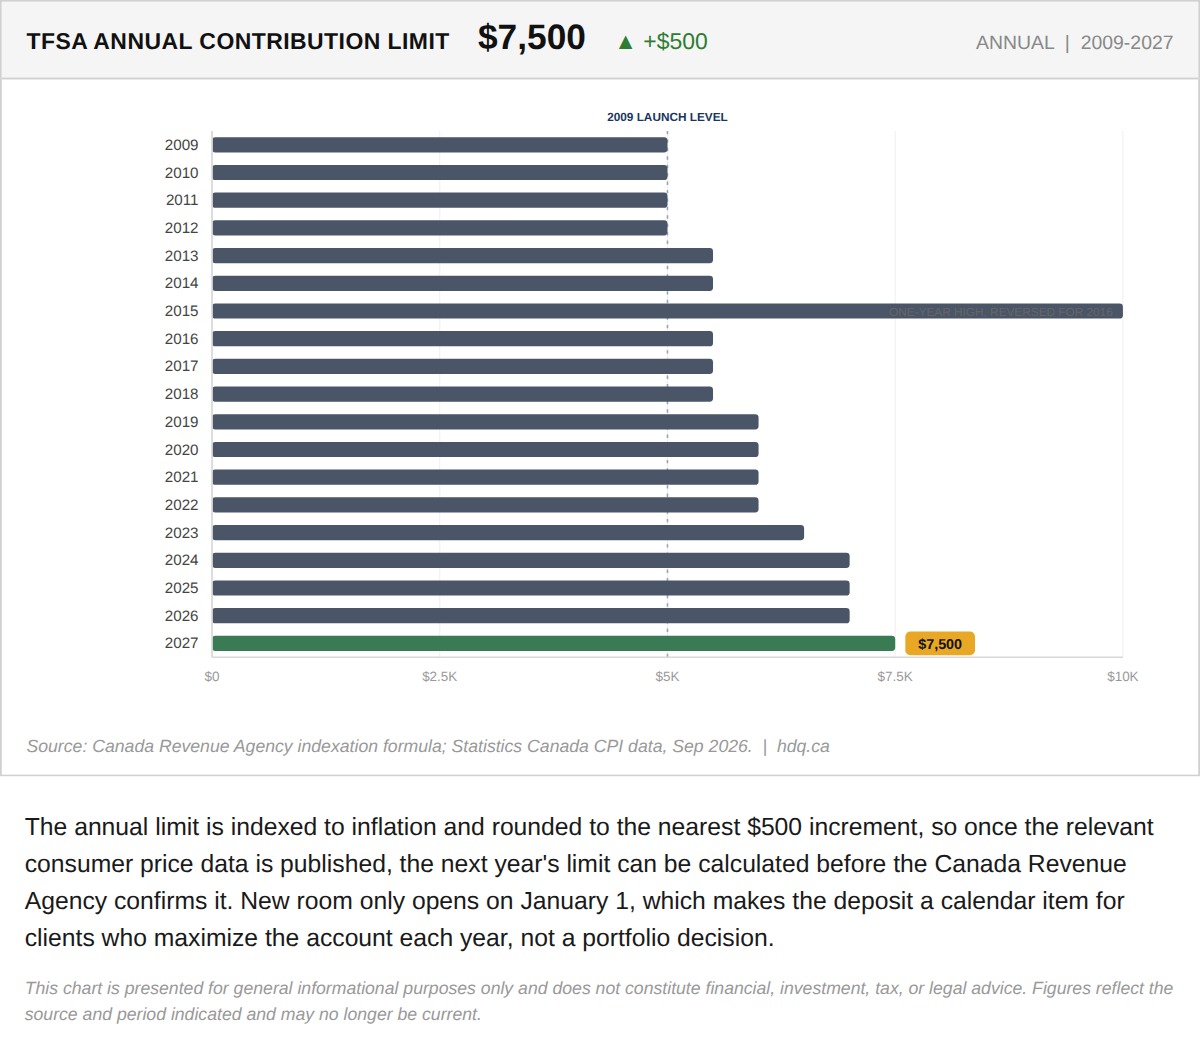
The annual limit is indexed to inflation and rounded to the nearest $500 increment, so once the relevant consumer price data is published,…
TFSA Annual Limit Set to Reach $7,500 in 2027
September 28, 2026
View chart & download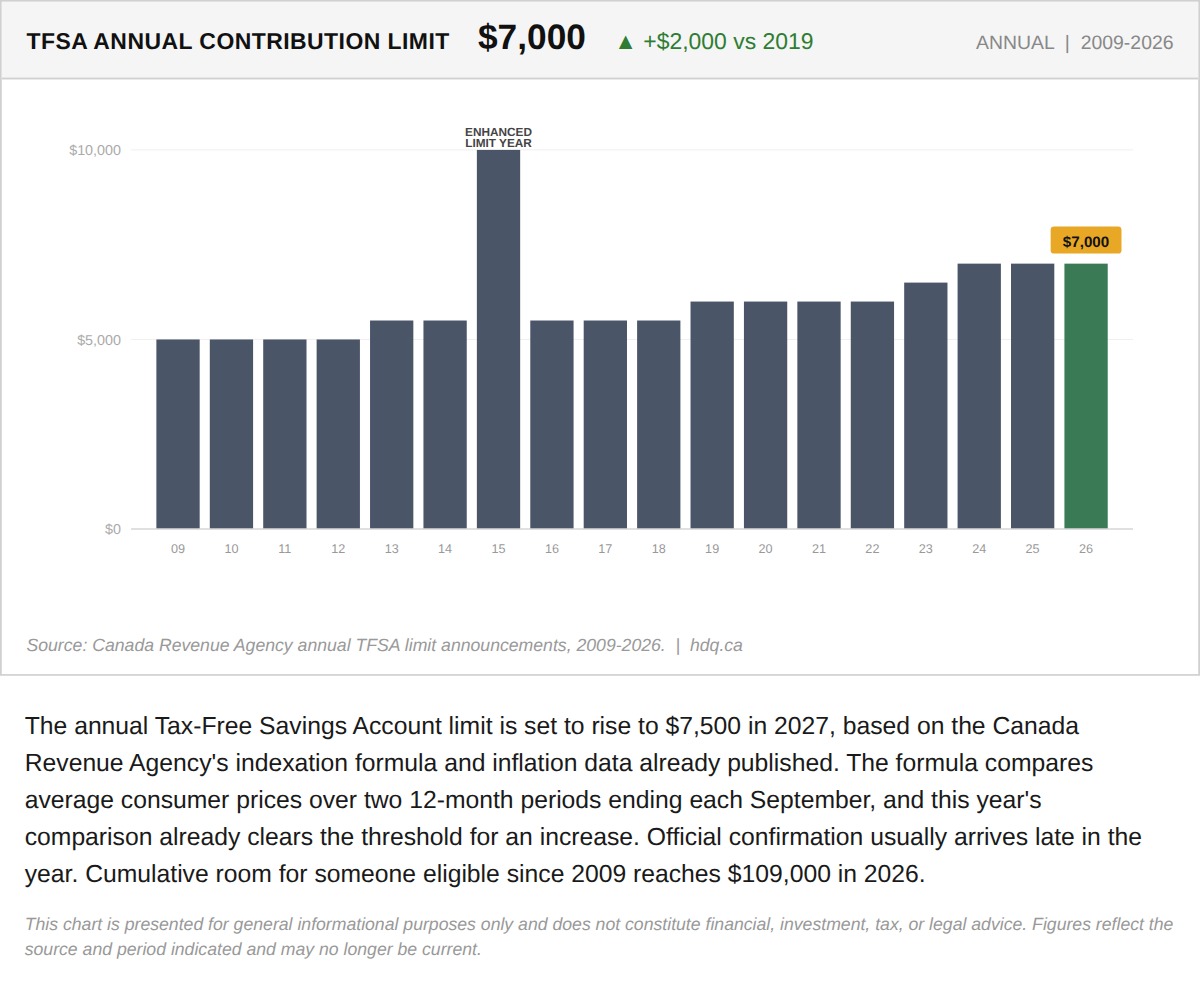
The annual Tax-Free Savings Account limit is set to rise to $7,500 in 2027, based on the Canada Revenue Agency's indexation formula and inflation data already published.
The 2027 TFSA Limit Is Already Locked In at $7,500
September 23, 2026
View chart & download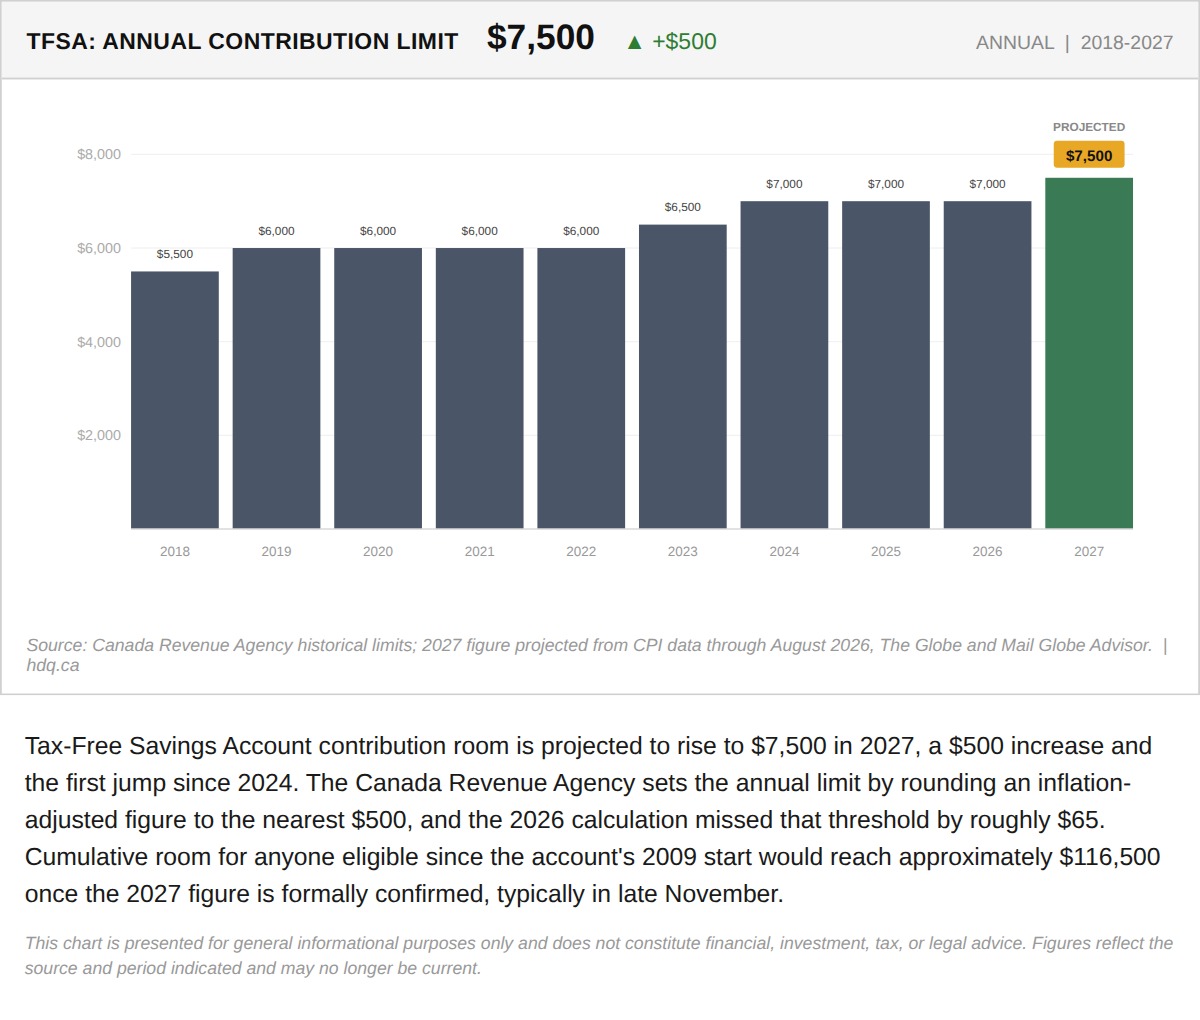
Tax-Free Savings Account contribution room is projected to rise to $7,500 in 2027, a $500 increase and the first jump since 2024.
TFSA Room Is Set to Rise to $7,500 in 2027, the First Jump Since 2024
September 18, 2026
View chart & download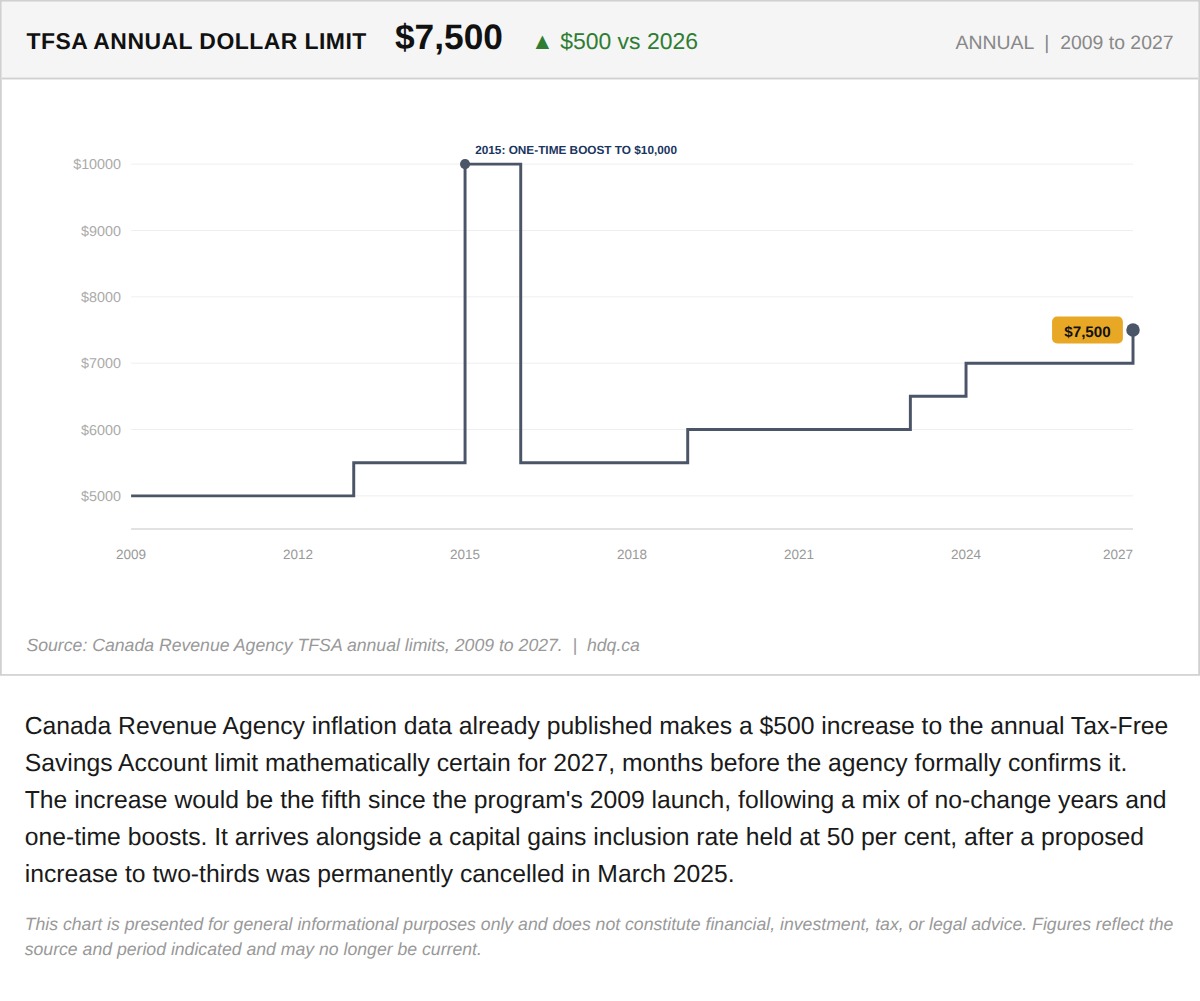
Canada Revenue Agency inflation data already published makes a $500 increase to the annual Tax-Free Savings Account limit mathematically…
The 2027 TFSA Limit Is Already Decided, and So Is the Capital Gains Question Behind It
September 11, 2026
View chart & download