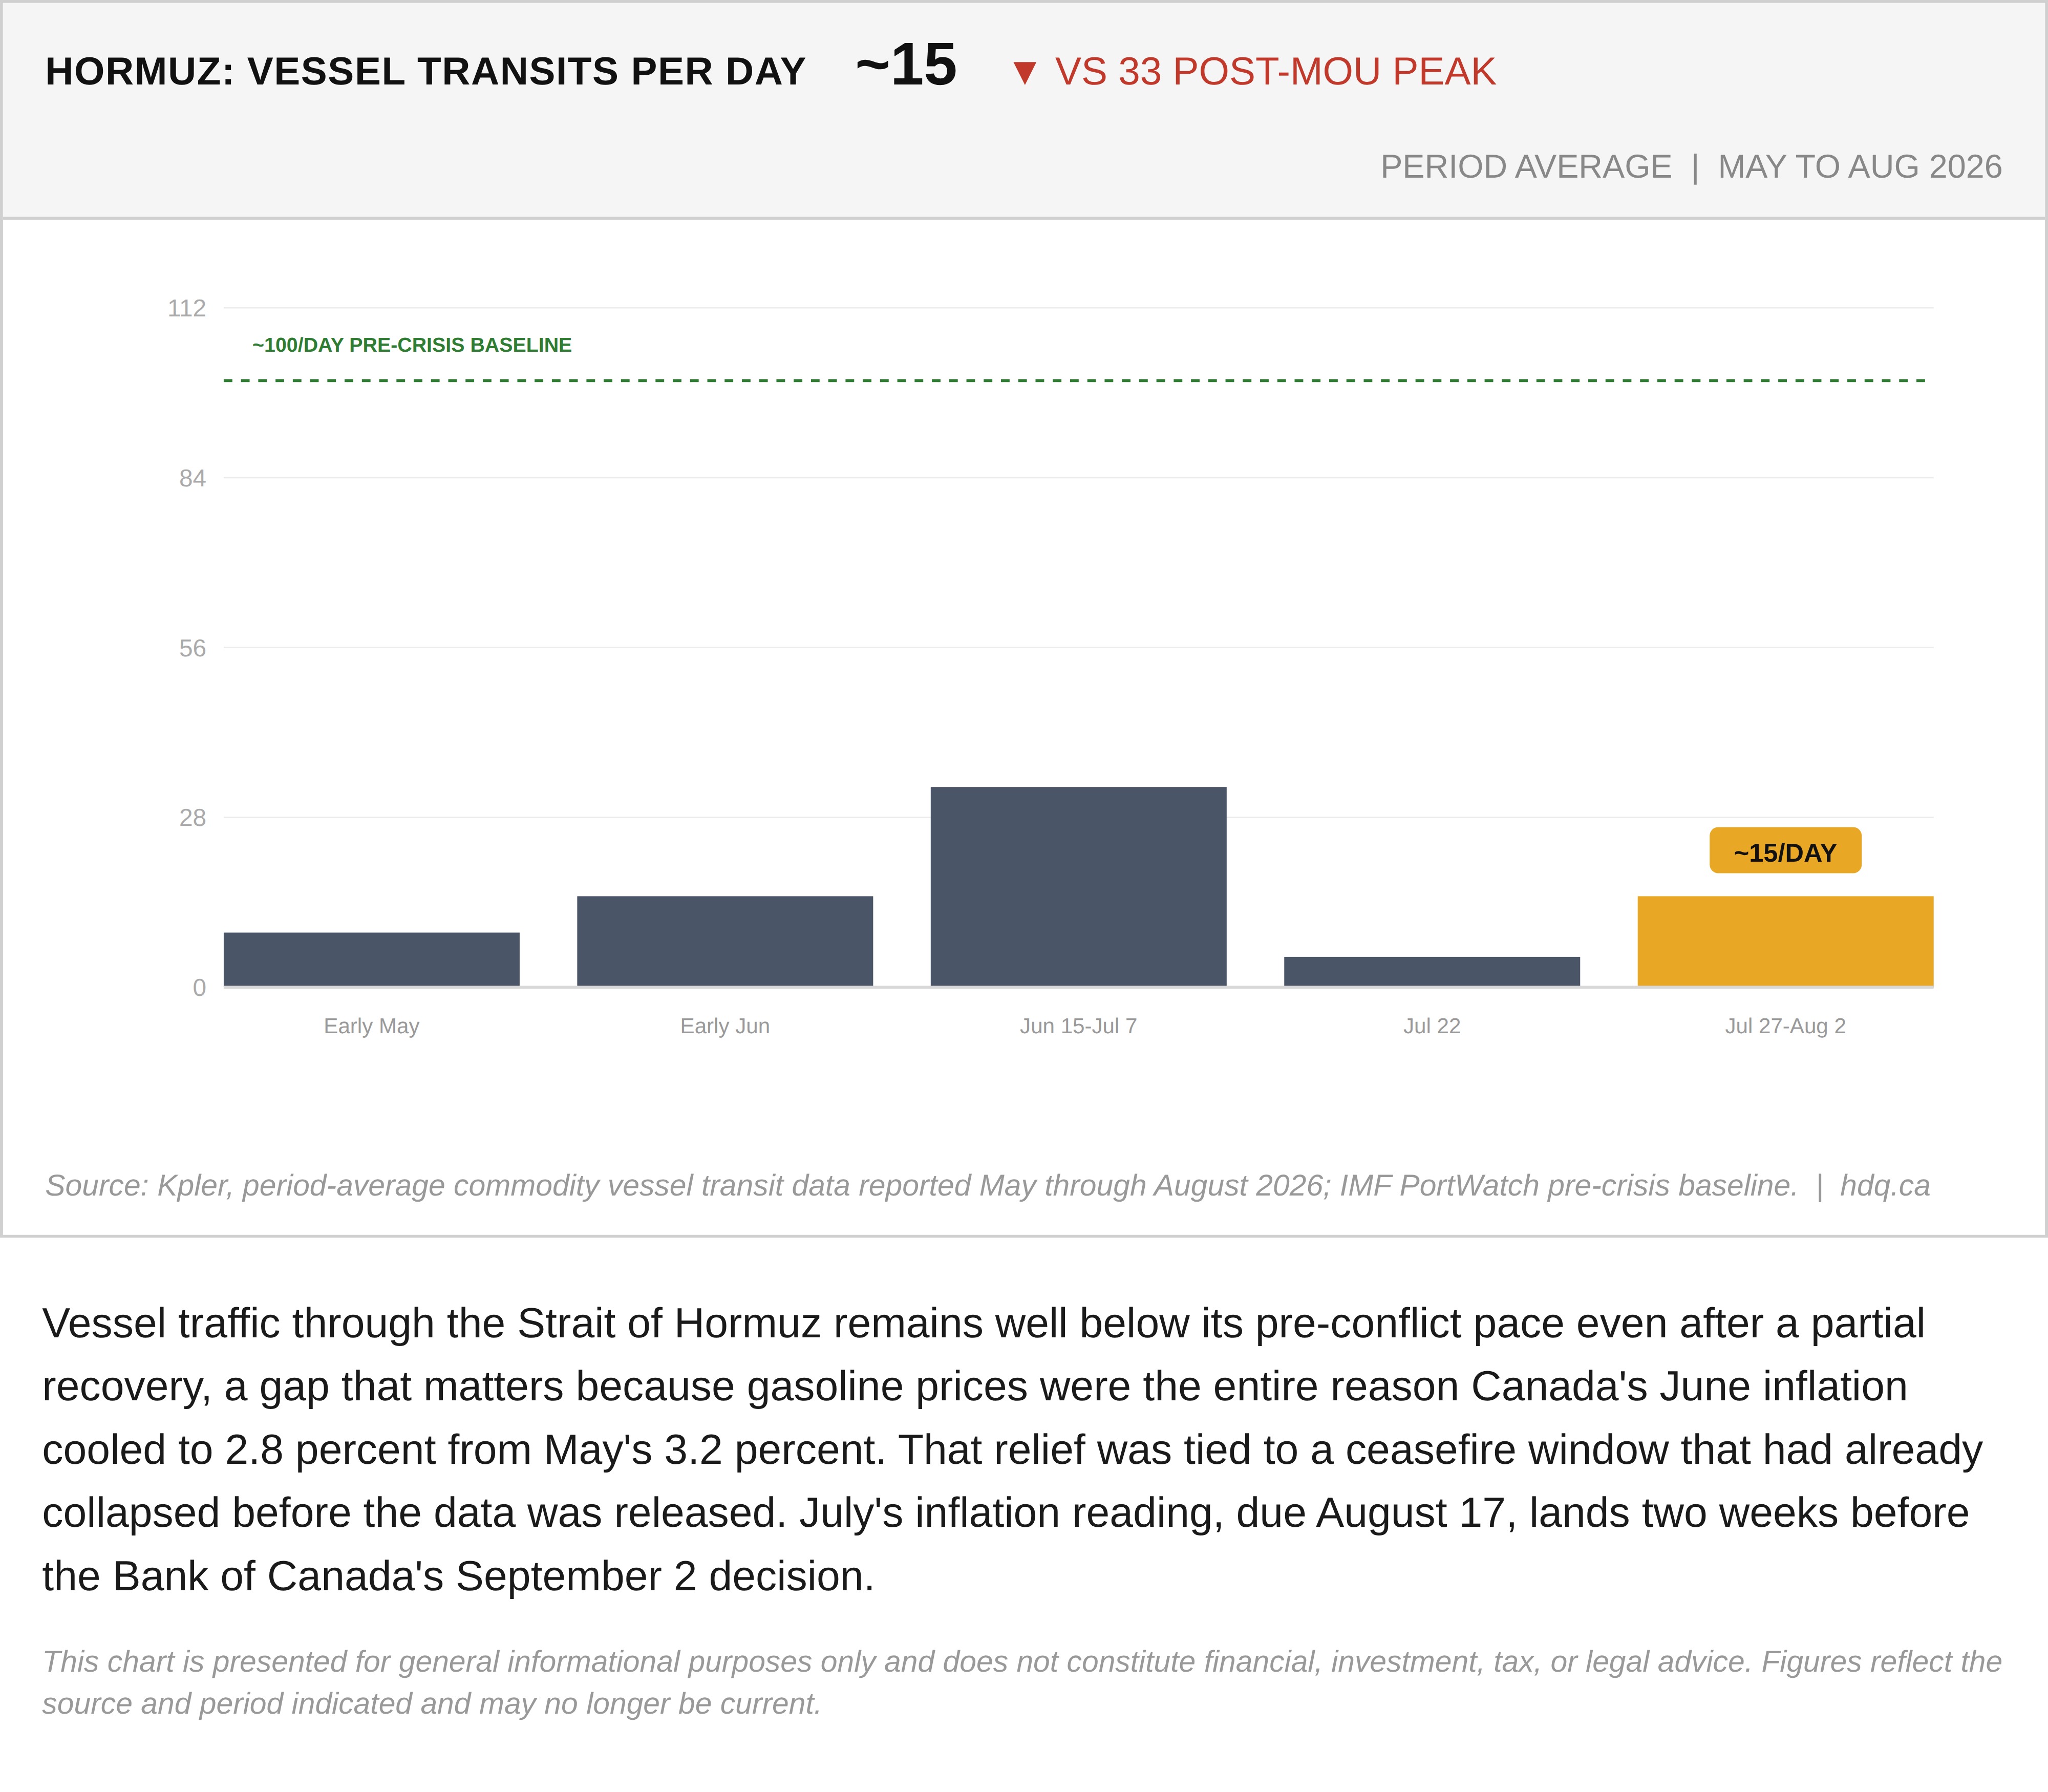
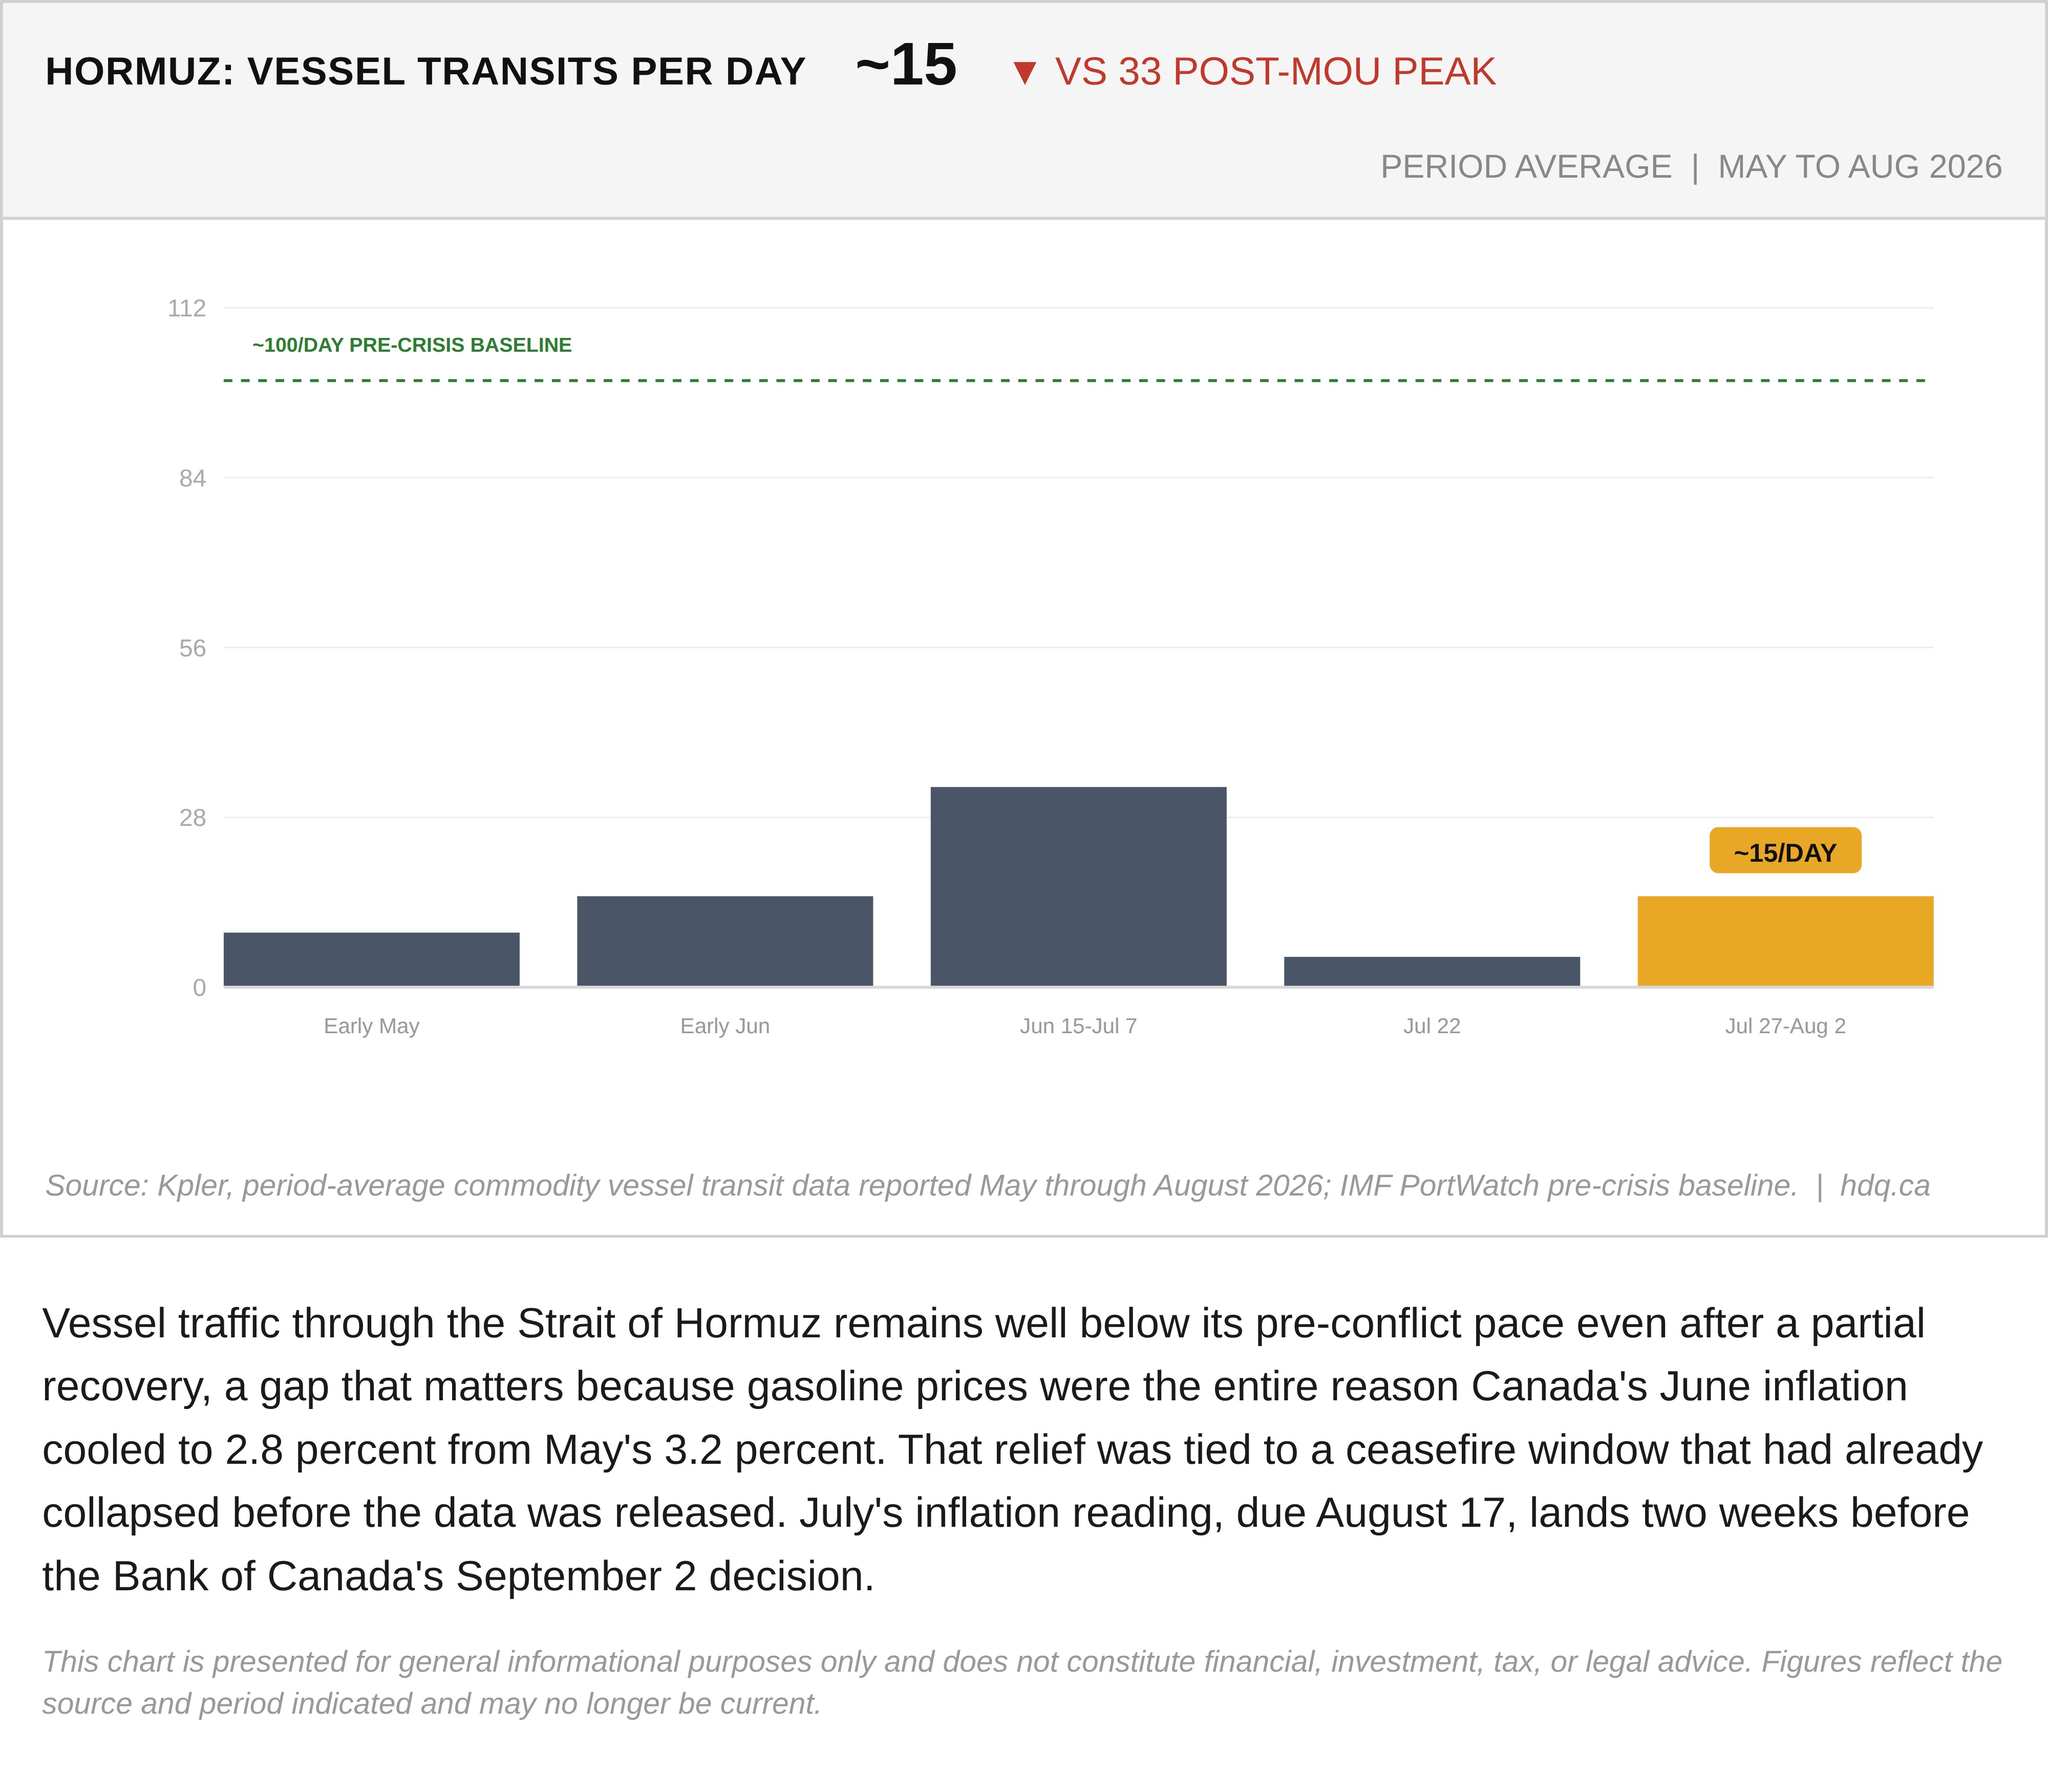
Vessel traffic through the Strait of Hormuz remains well below its pre-conflict pace even after a partial recovery, a gap that matters because gasoline prices were the entire reason Canada's June inflation cooled to 2.8 percent from May's 3.2 percent. That relief was tied to a ceasefire window that had already collapsed before the data was released. July's inflation reading, due August 17, lands two weeks before the Bank of Canada's September 2 decision.
This chart is presented for general informational purposes only and does not constitute financial, investment, tax, or legal advice. Figures reflect the source and period indicated and may no longer be current.
Related charts
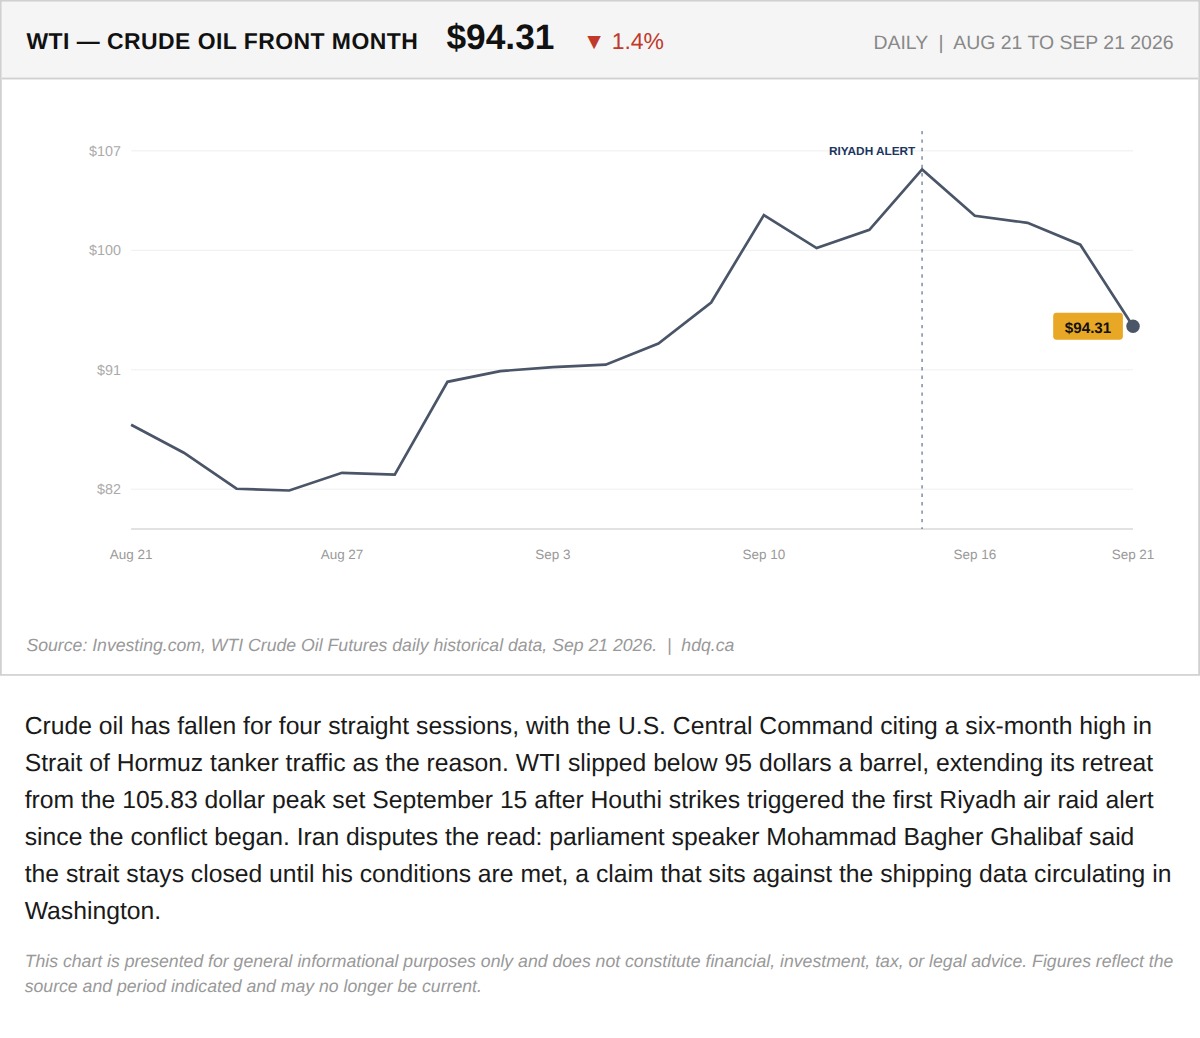
Crude oil has fallen for four straight sessions, with the U.S.
Oil Falls for a Fourth Session as Hormuz Shipping Data Is Disputed
September 21, 2026
View chart & download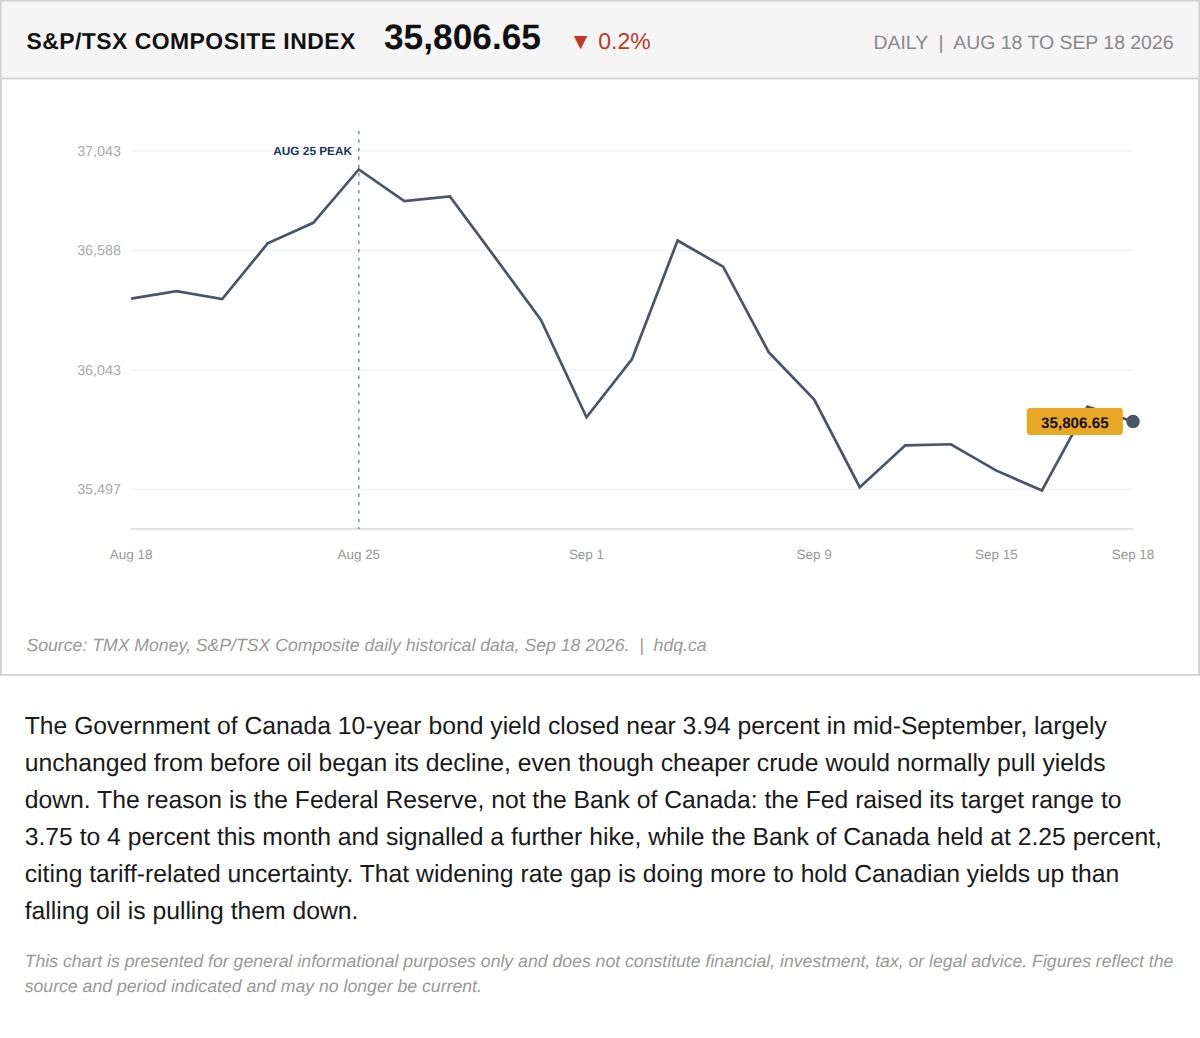
The Government of Canada 10-year bond yield closed near 3.94 percent in mid-September, largely unchanged from before oil began its decline,…
TSX Slides as Canadian Bond Yields Stay Elevated Despite Falling Oil
September 21, 2026
View chart & download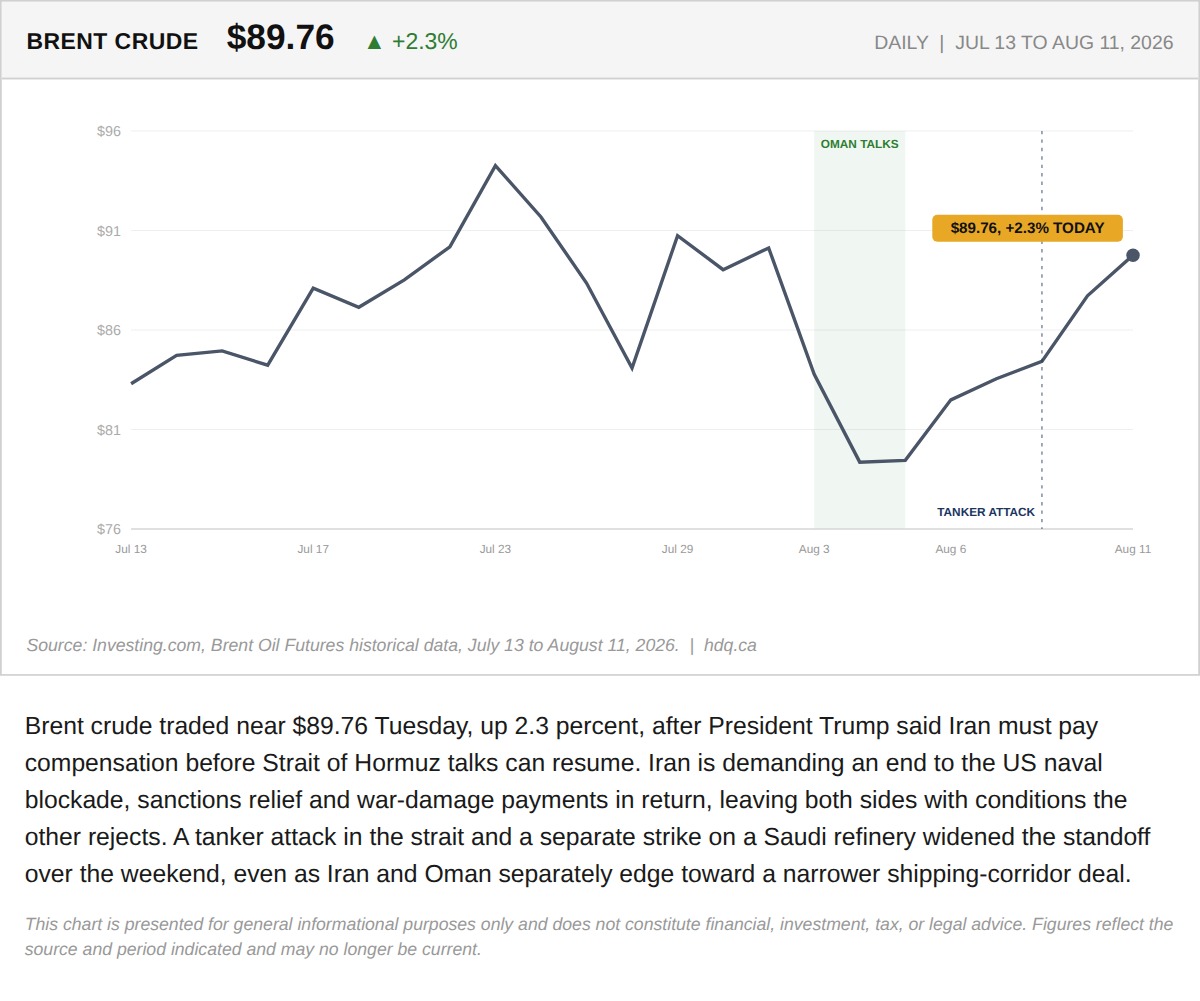
Brent crude traded near $89.76 Tuesday, up 2.3 percent, after President Trump said Iran must pay compensation before Strait of Hormuz talks can resume.
Trump's Compensation Demand Stalls Hormuz Talks Again
August 11, 2026
View chart & download
Brent was the only one of the three to finish above its starting level, while the index and gold both fell.
Brent, TSX and Gold Rebased to the August 31 Close
September 30, 2026
View chart & download
The Bank of Canada held its policy rate at 2.25% for a seventh straight time, yet Canadian yields rose as United States yields surged.
Government of Canada Benchmark Yields, September 2026
September 30, 2026
View chart & download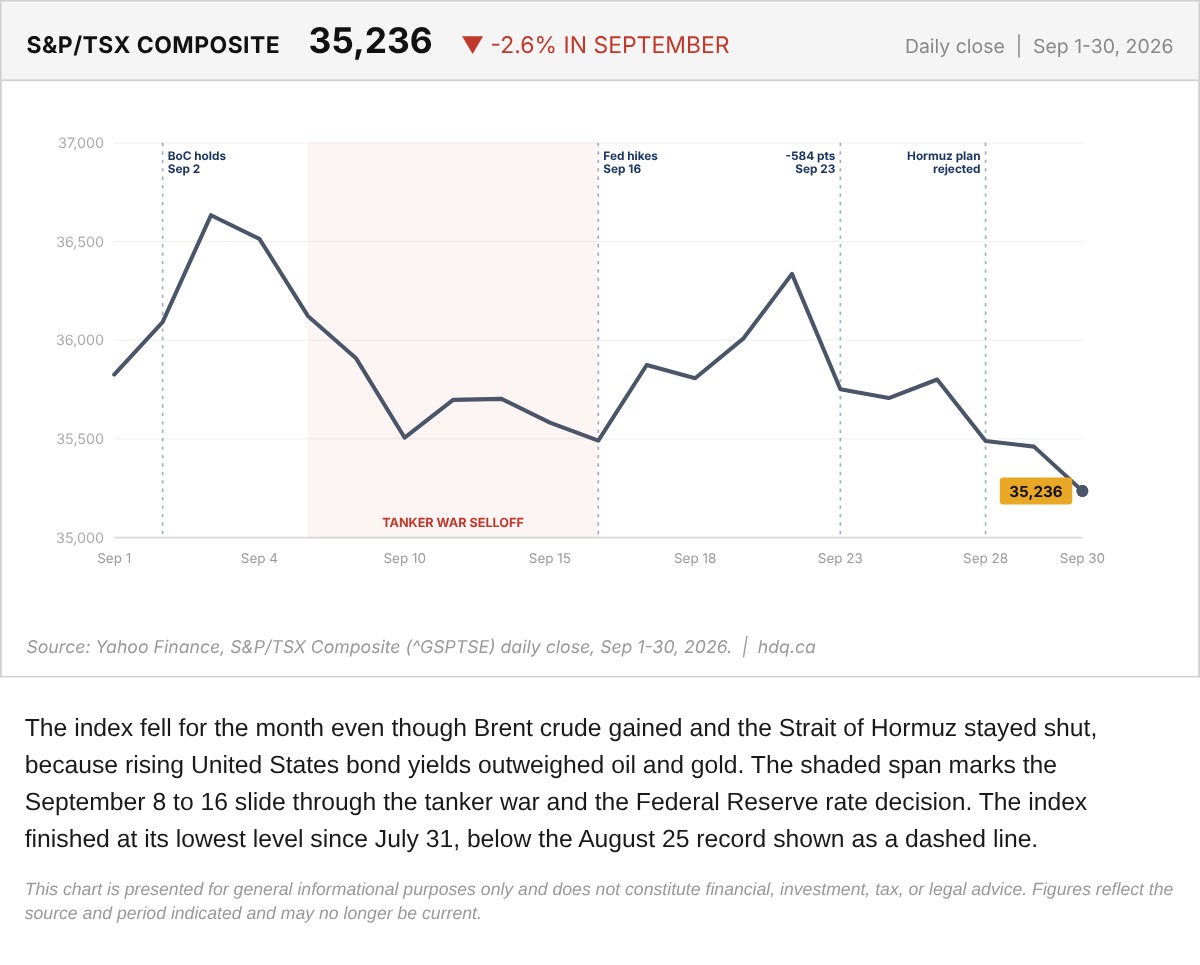
The index fell for the month even though Brent crude gained and the Strait of Hormuz stayed shut, because rising United States bond yields outweighed oil and gold.
S&P/TSX Composite Daily Close Through September 2026
September 30, 2026
View chart & download