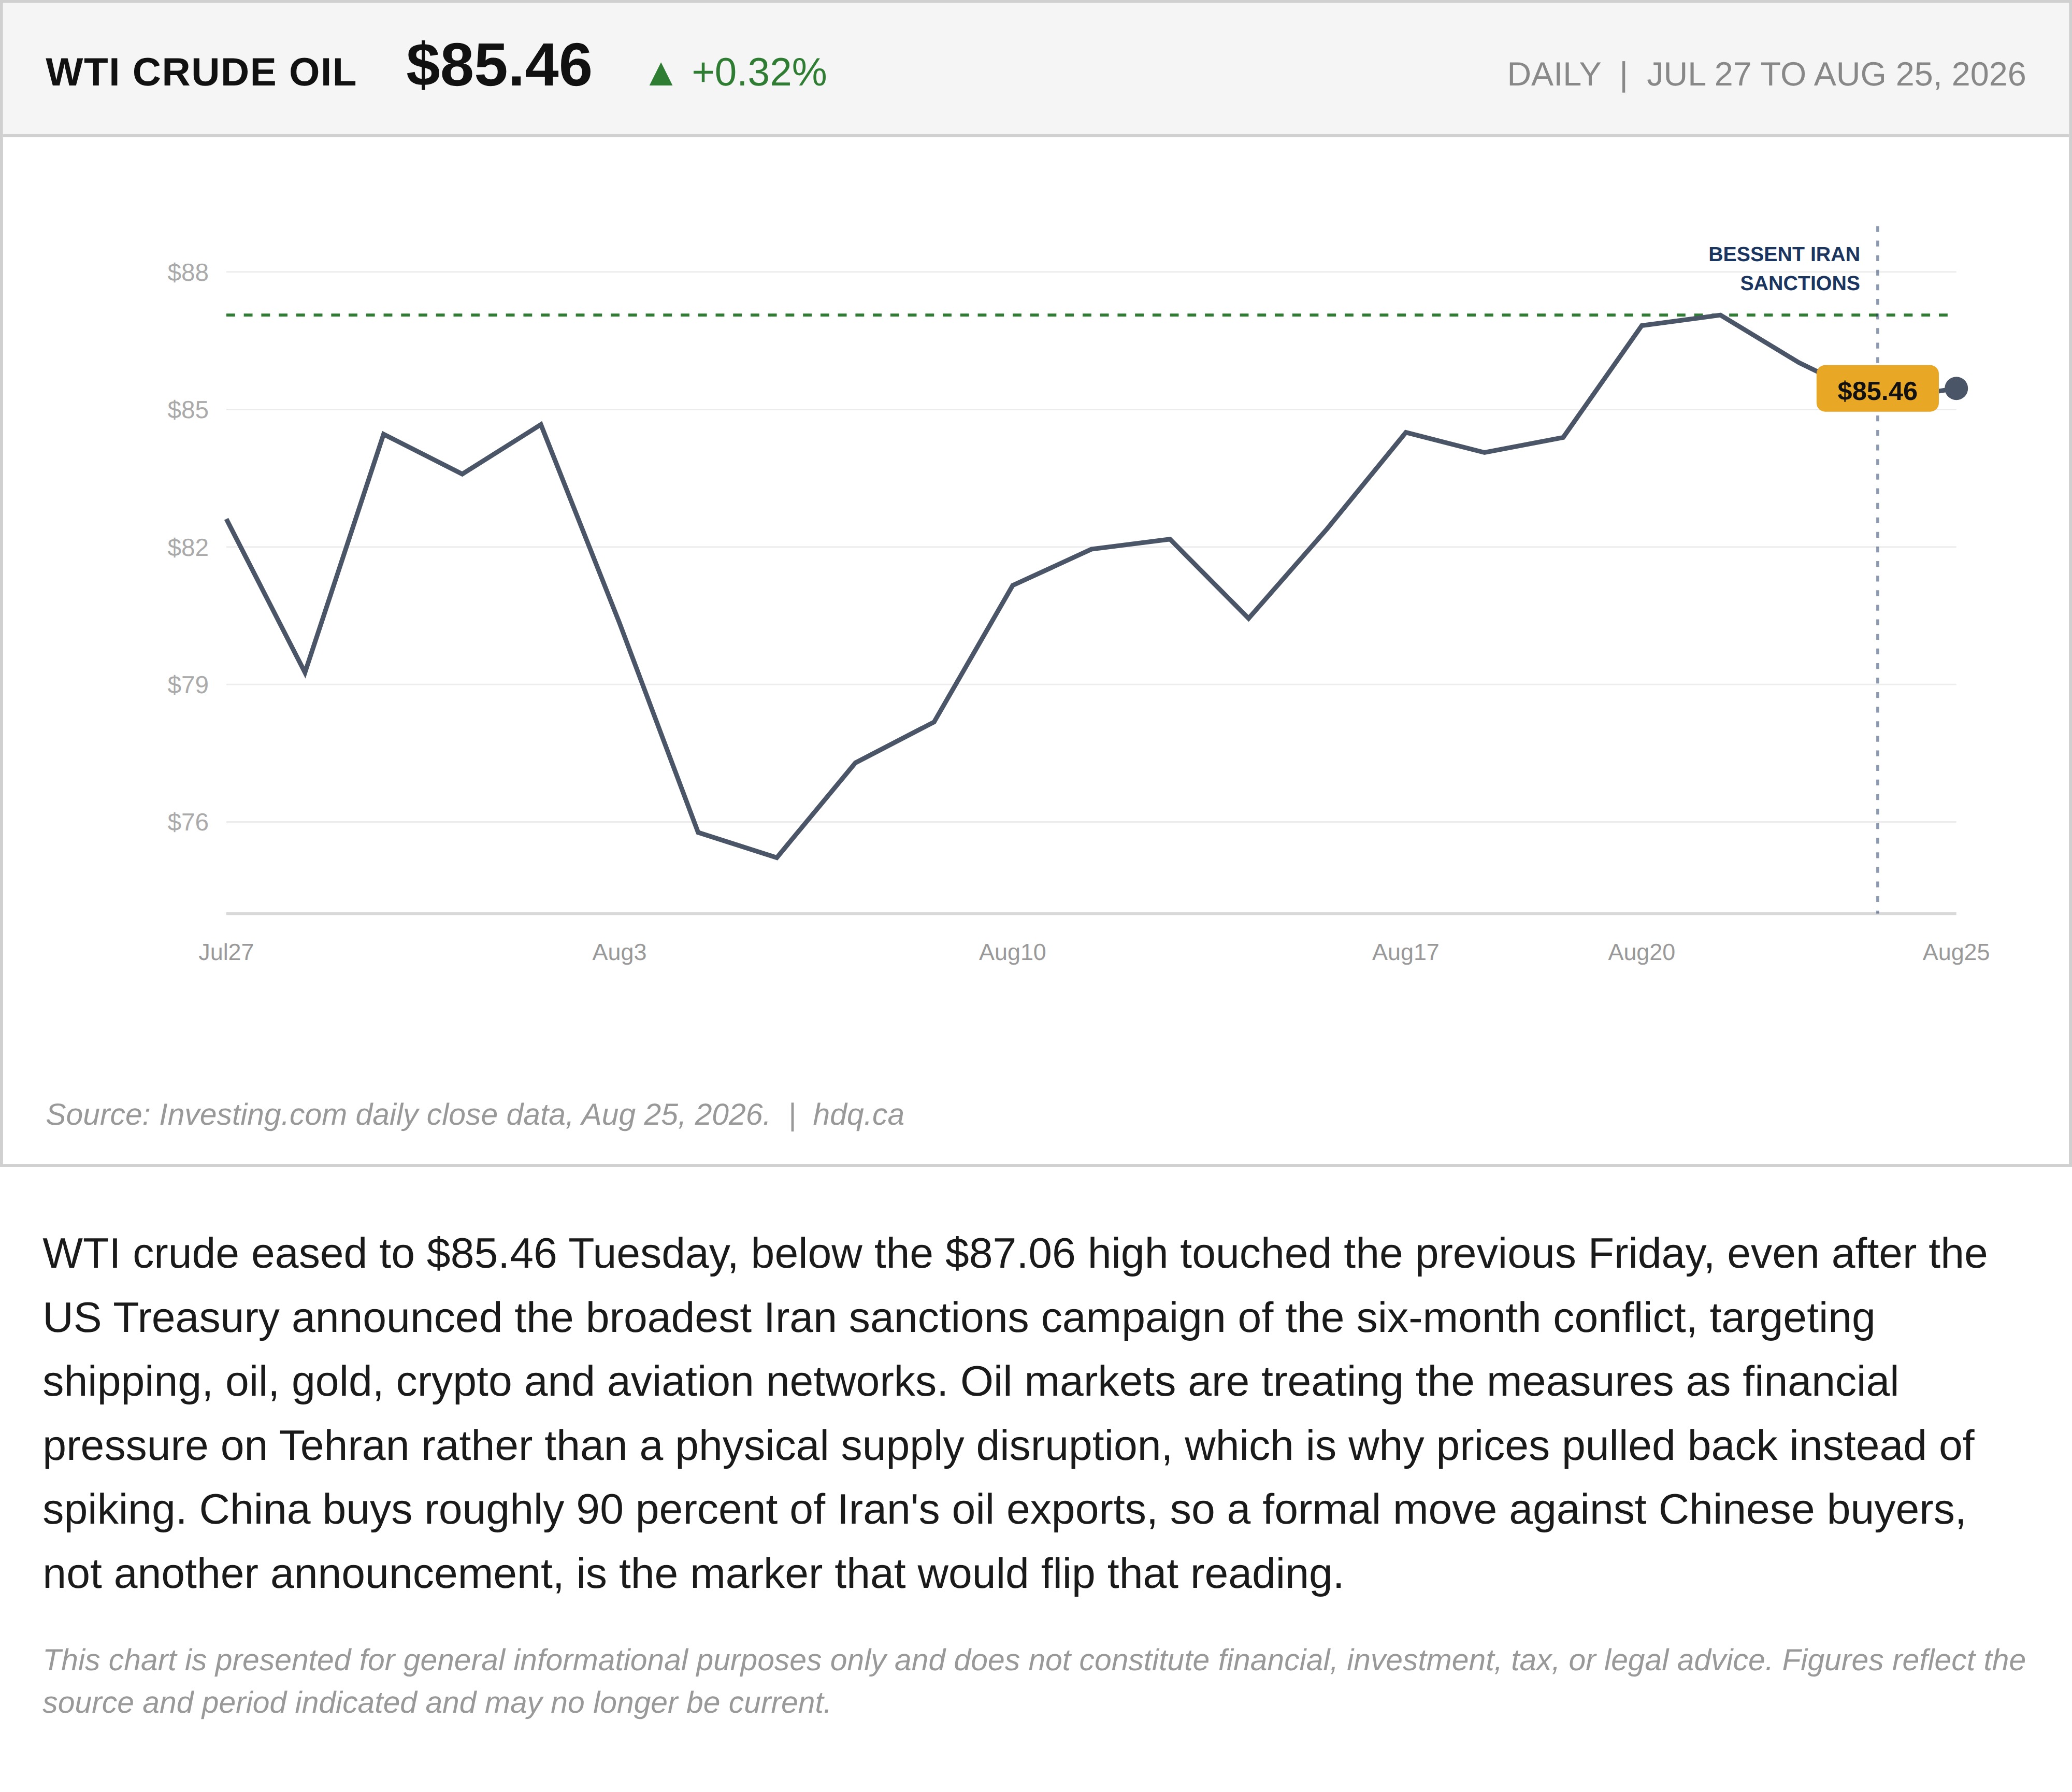
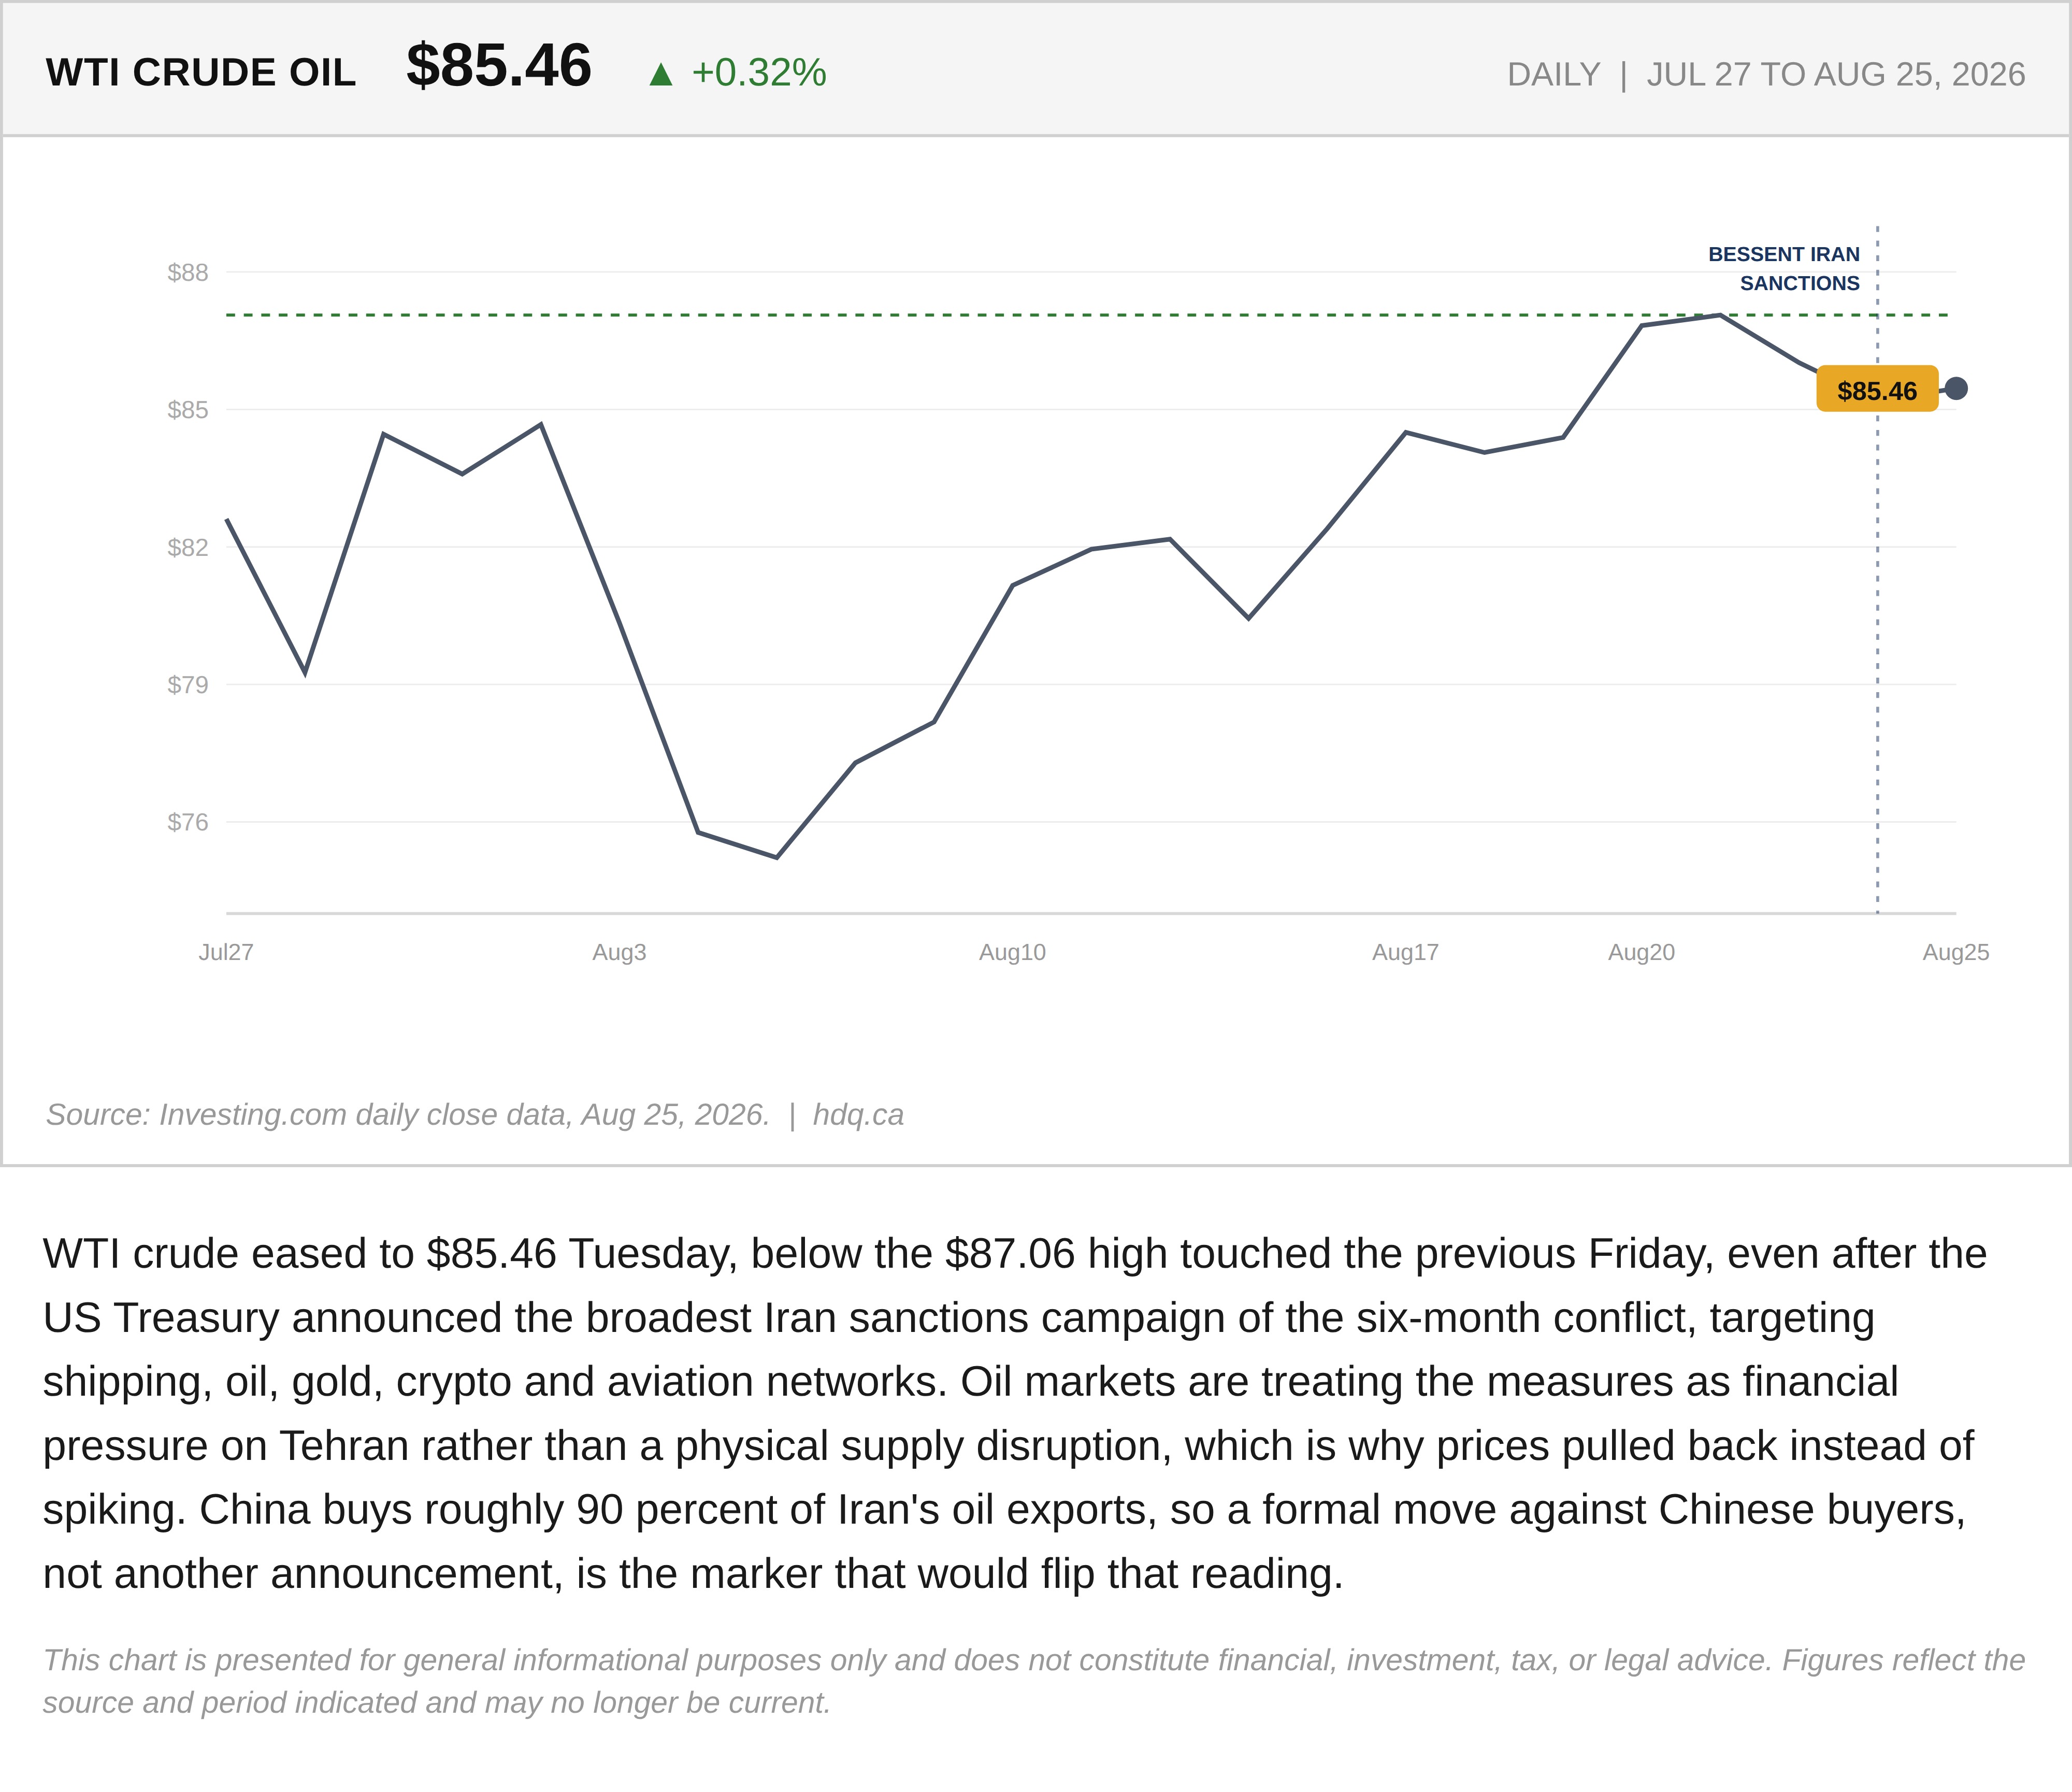
WTI crude eased to $85.46 Tuesday, below the $87.06 high touched the previous Friday, even after the US Treasury announced the broadest Iran sanctions campaign of the six-month conflict, targeting shipping, oil, gold, crypto and aviation networks. Oil markets are treating the measures as financial pressure on Tehran rather than a physical supply disruption, which is why prices pulled back instead of spiking. China buys roughly 90 percent of Iran's oil exports, so a formal move against Chinese buyers, not another announcement, is the marker that would flip that reading.
This chart is presented for general informational purposes only and does not constitute financial, investment, tax, or legal advice. Figures reflect the source and period indicated and may no longer be current.
Related charts
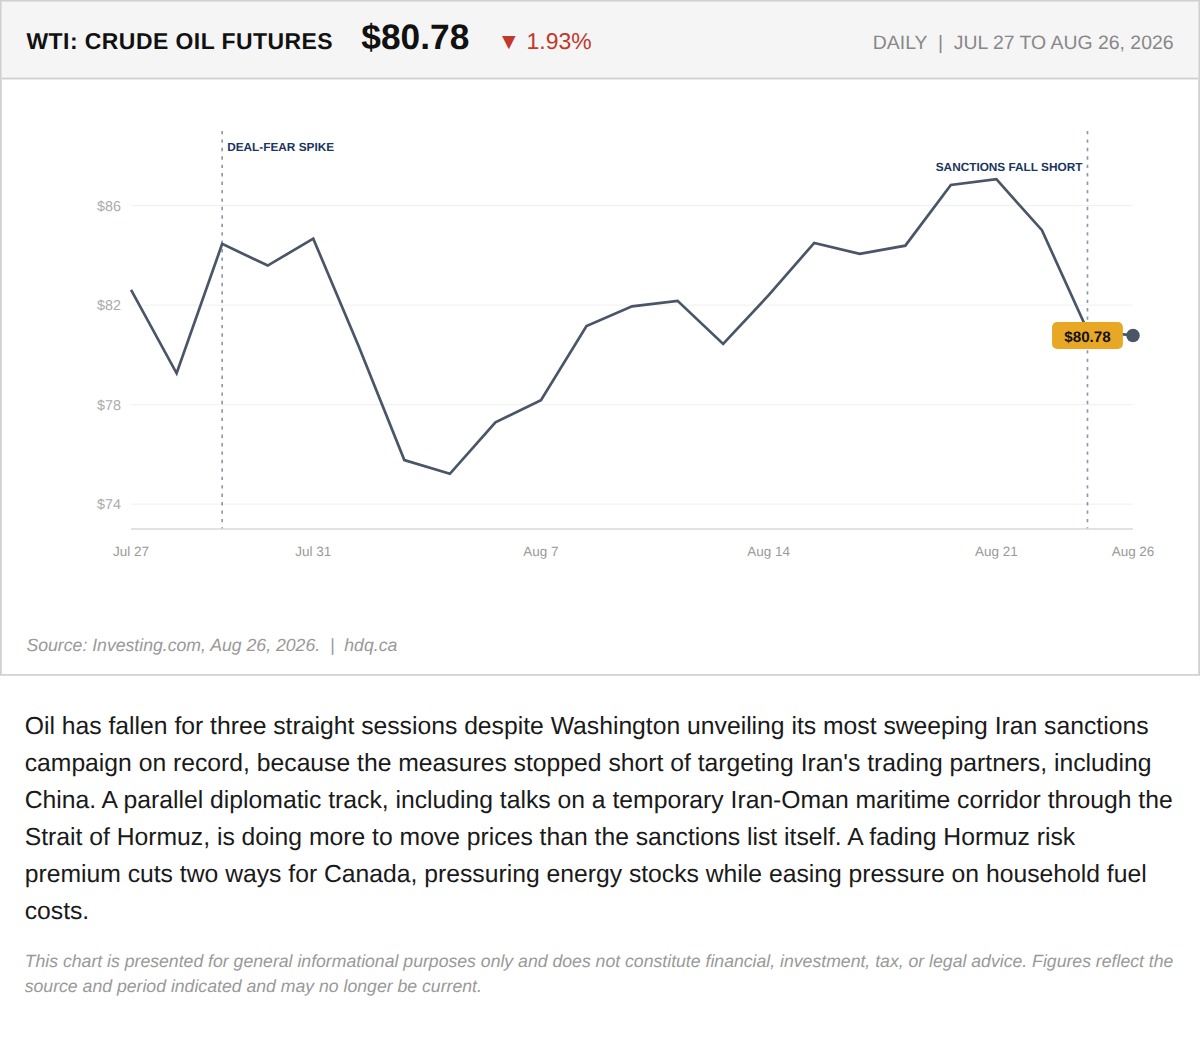
Oil has fallen for three straight sessions despite Washington unveiling its most sweeping Iran sanctions campaign on record, because the…
August 26, 2026
View chart & download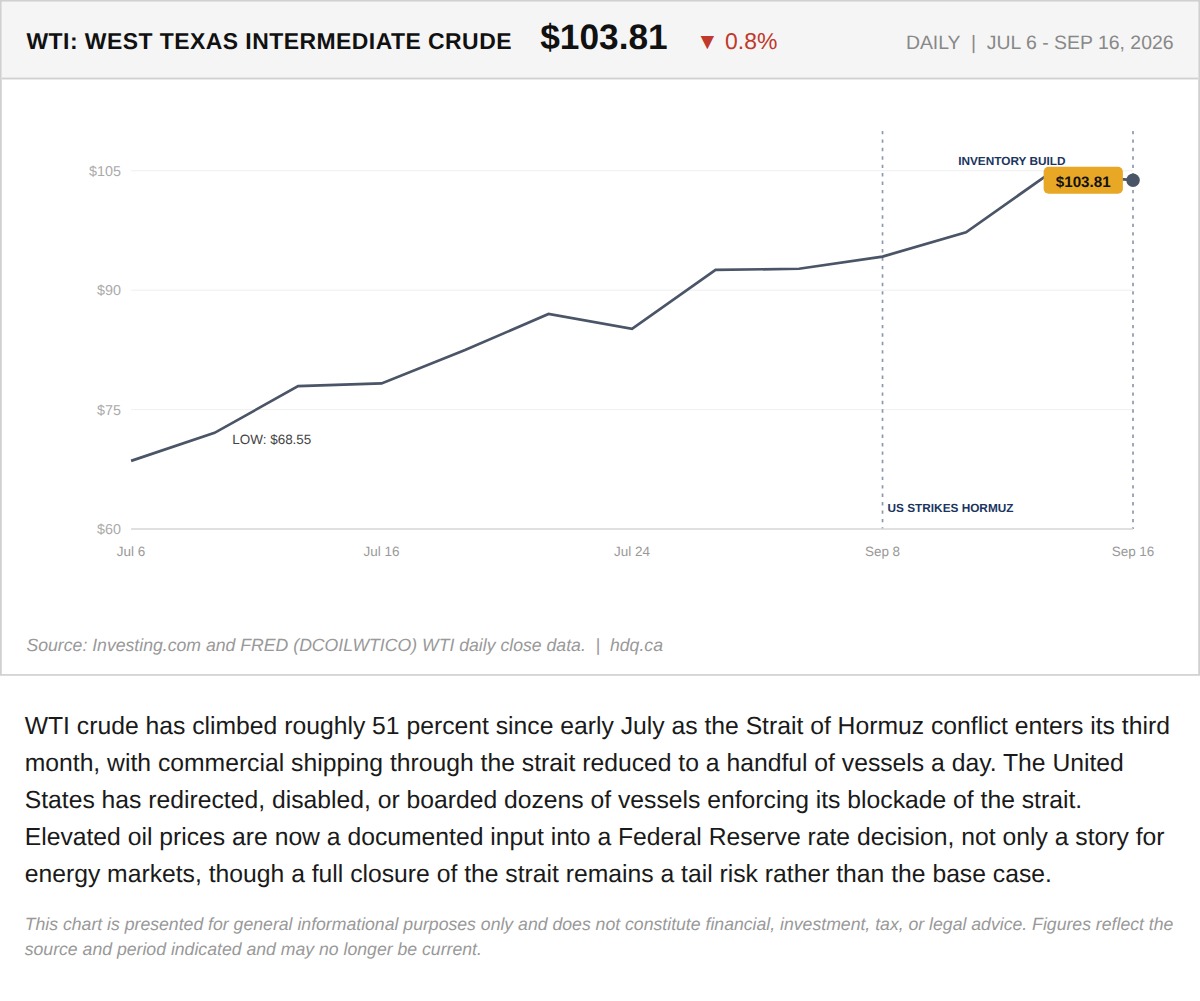
WTI crude has climbed roughly 51 percent since early July as the Strait of Hormuz conflict enters its third month, with commercial shipping…
Why a War in the Strait of Hormuz Is Steering a Federal Reserve Decision
September 16, 2026
View chart & download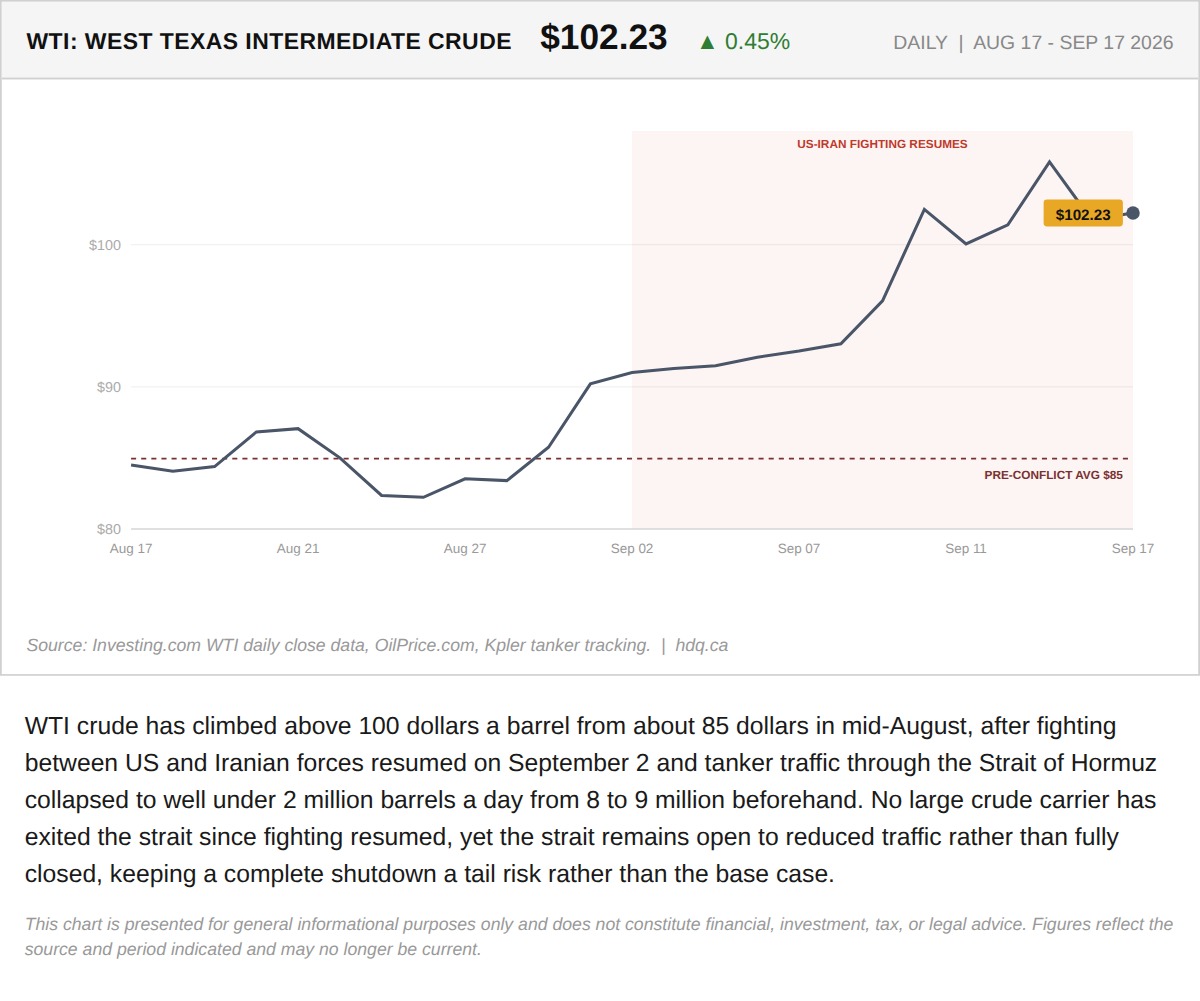
WTI crude has climbed above 100 dollars a barrel from about 85 dollars in mid-August, after fighting between US and Iranian forces resumed…
Why Oil Crossed 100 Dollars Without a Full Strait of Hormuz Closure
September 17, 2026
View chart & download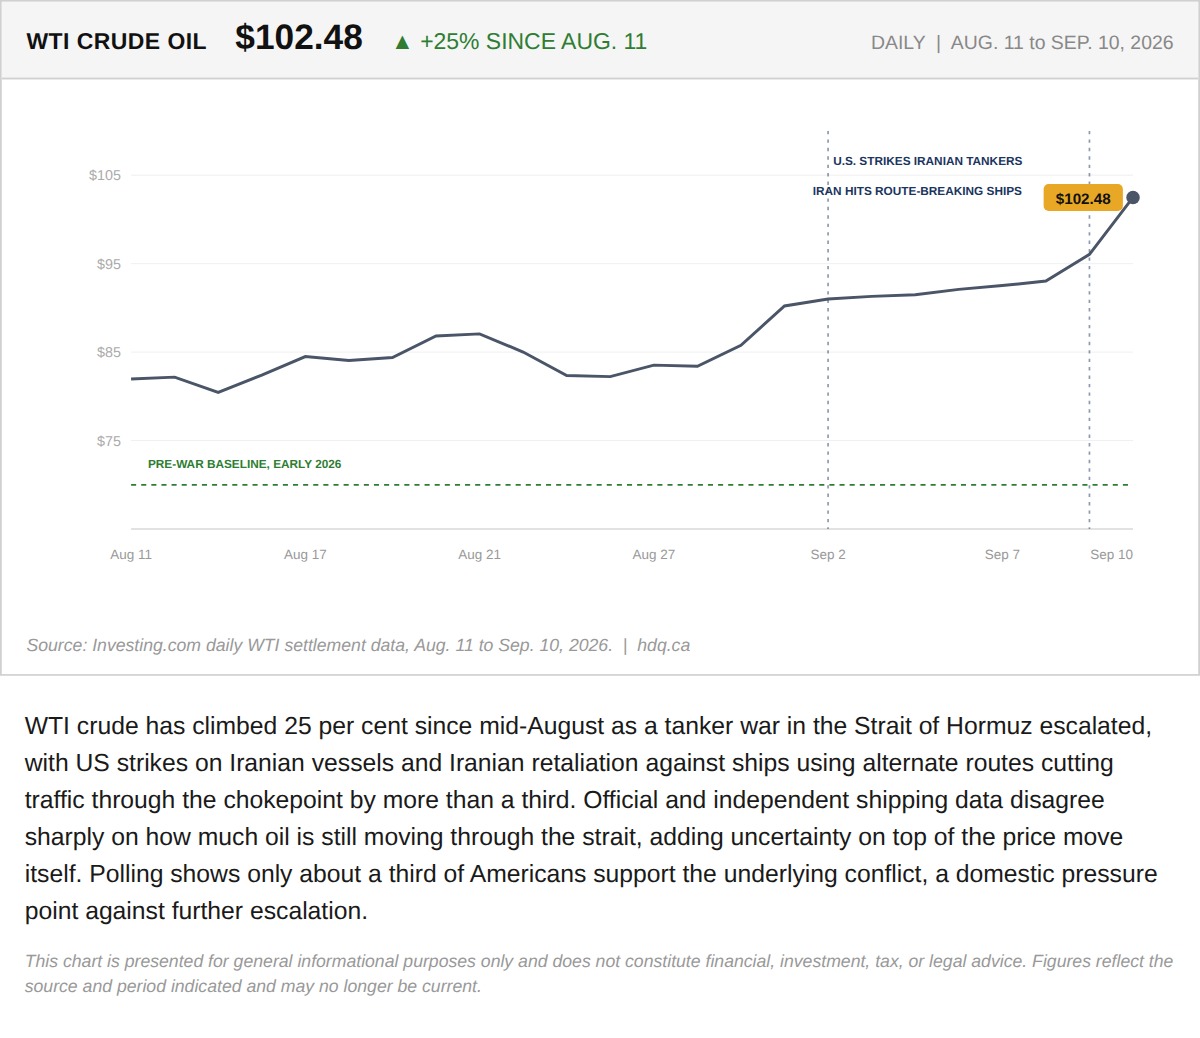
WTI crude has climbed 25 per cent since mid-August as a tanker war in the Strait of Hormuz escalated, with US strikes on Iranian vessels…
The Tanker War in the Strait of Hormuz Just Repriced Every Canadian Energy Position
September 11, 2026
View chart & download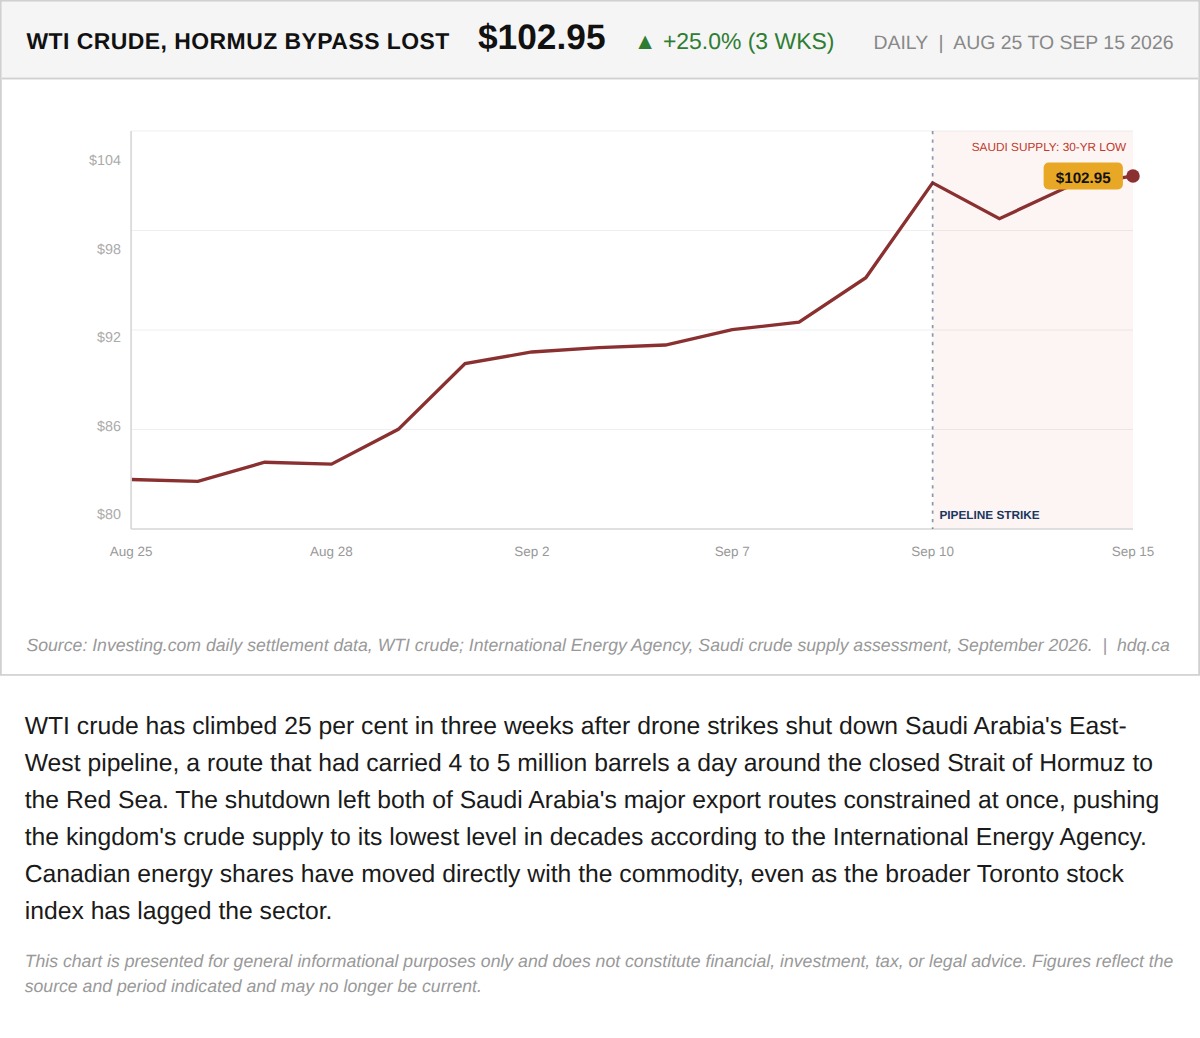
WTI crude has climbed 25 per cent in three weeks after drone strikes shut down Saudi Arabia's East-West pipeline, a route that had carried…
Iran Closed the Strait of Hormuz. This Week, Militias Closed the Detour Around It.
September 15, 2026
View chart & download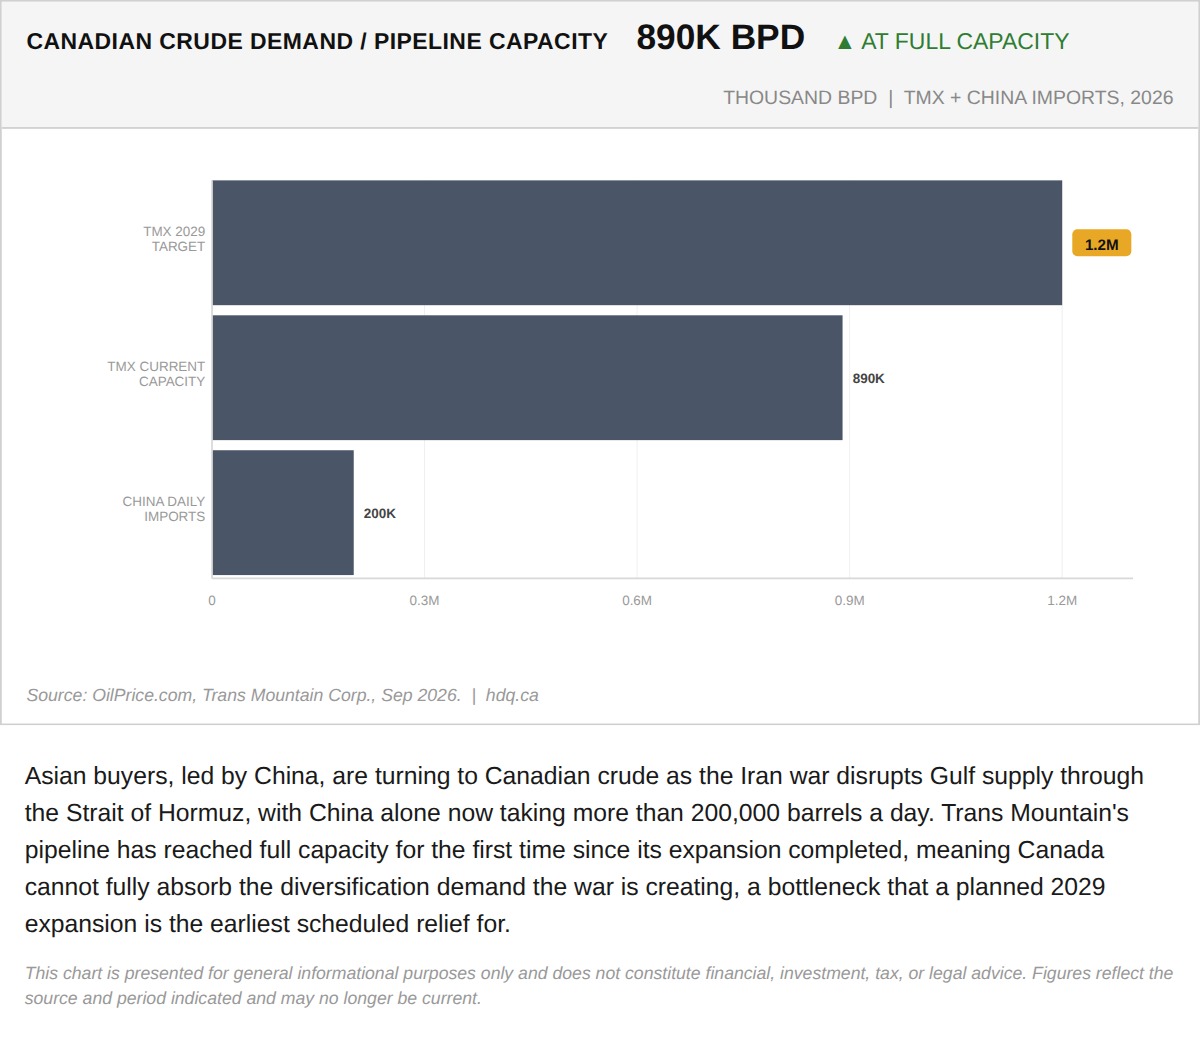
Asian buyers, led by China, are turning to Canadian crude as the Iran war disrupts Gulf supply through the Strait of Hormuz, with China…
The Iran War Is Rerouting Asian Oil Demand to Canada, But the Pipe Is Already Full
September 3, 2026
View chart & download