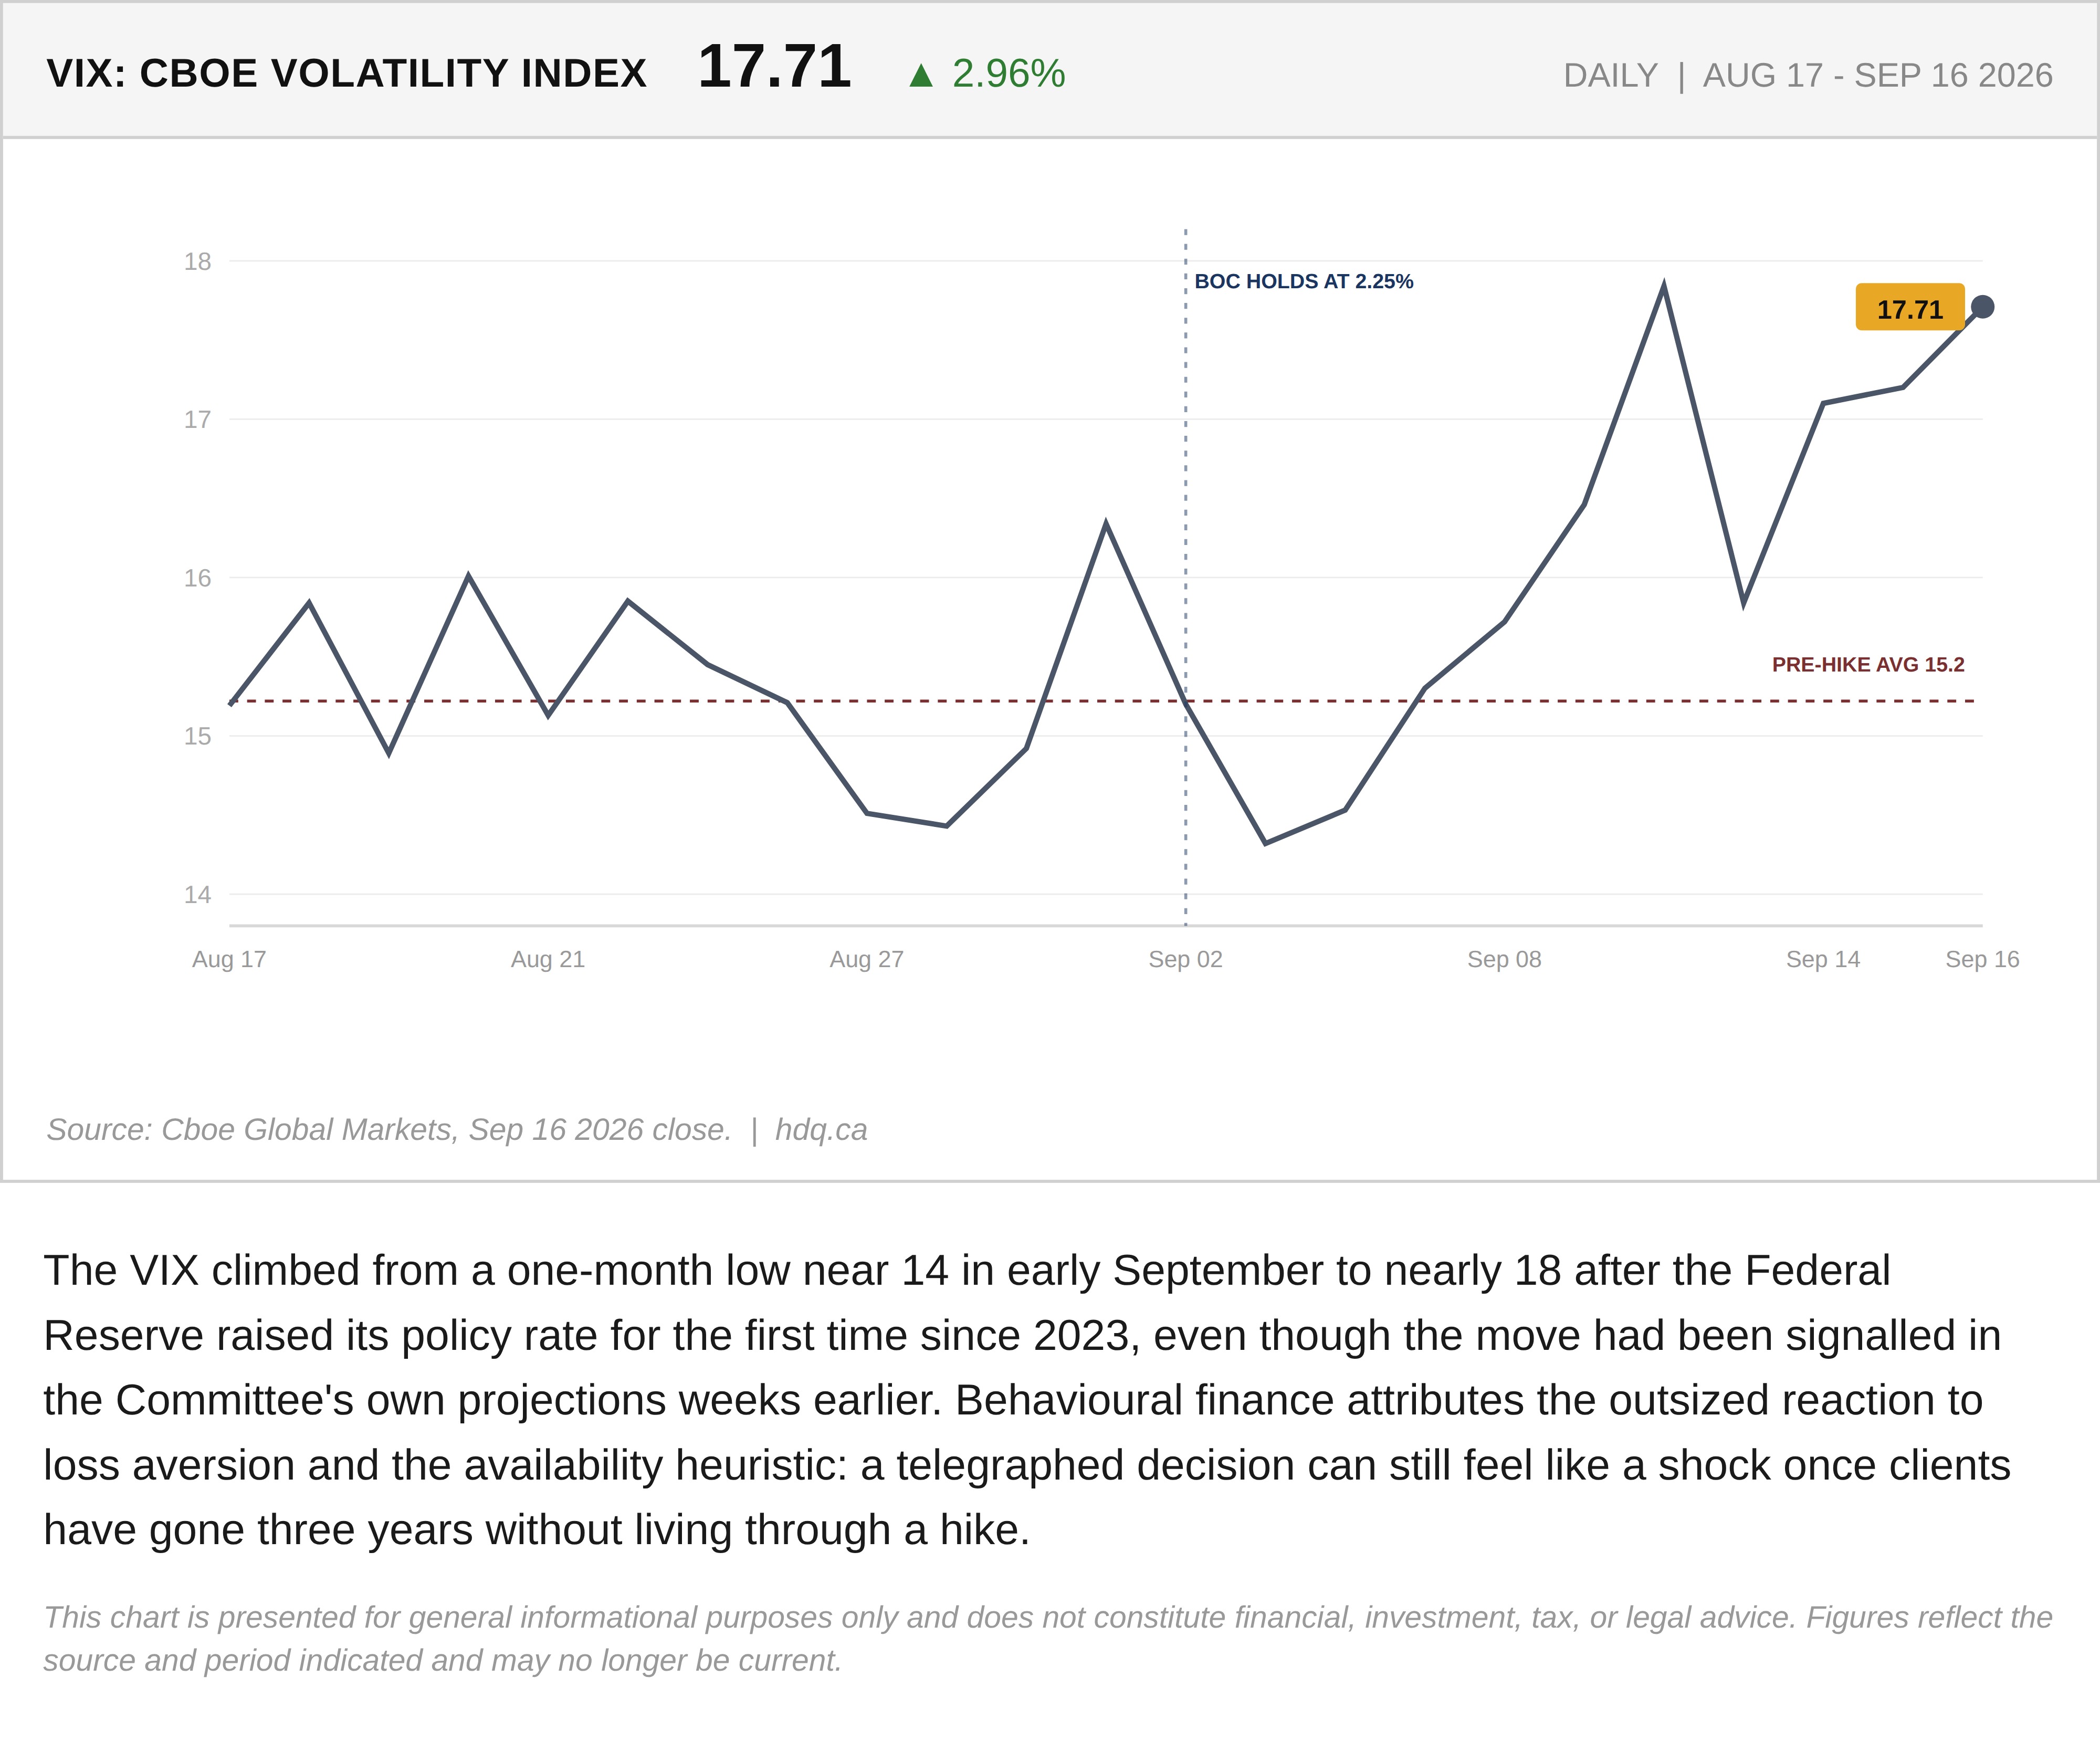
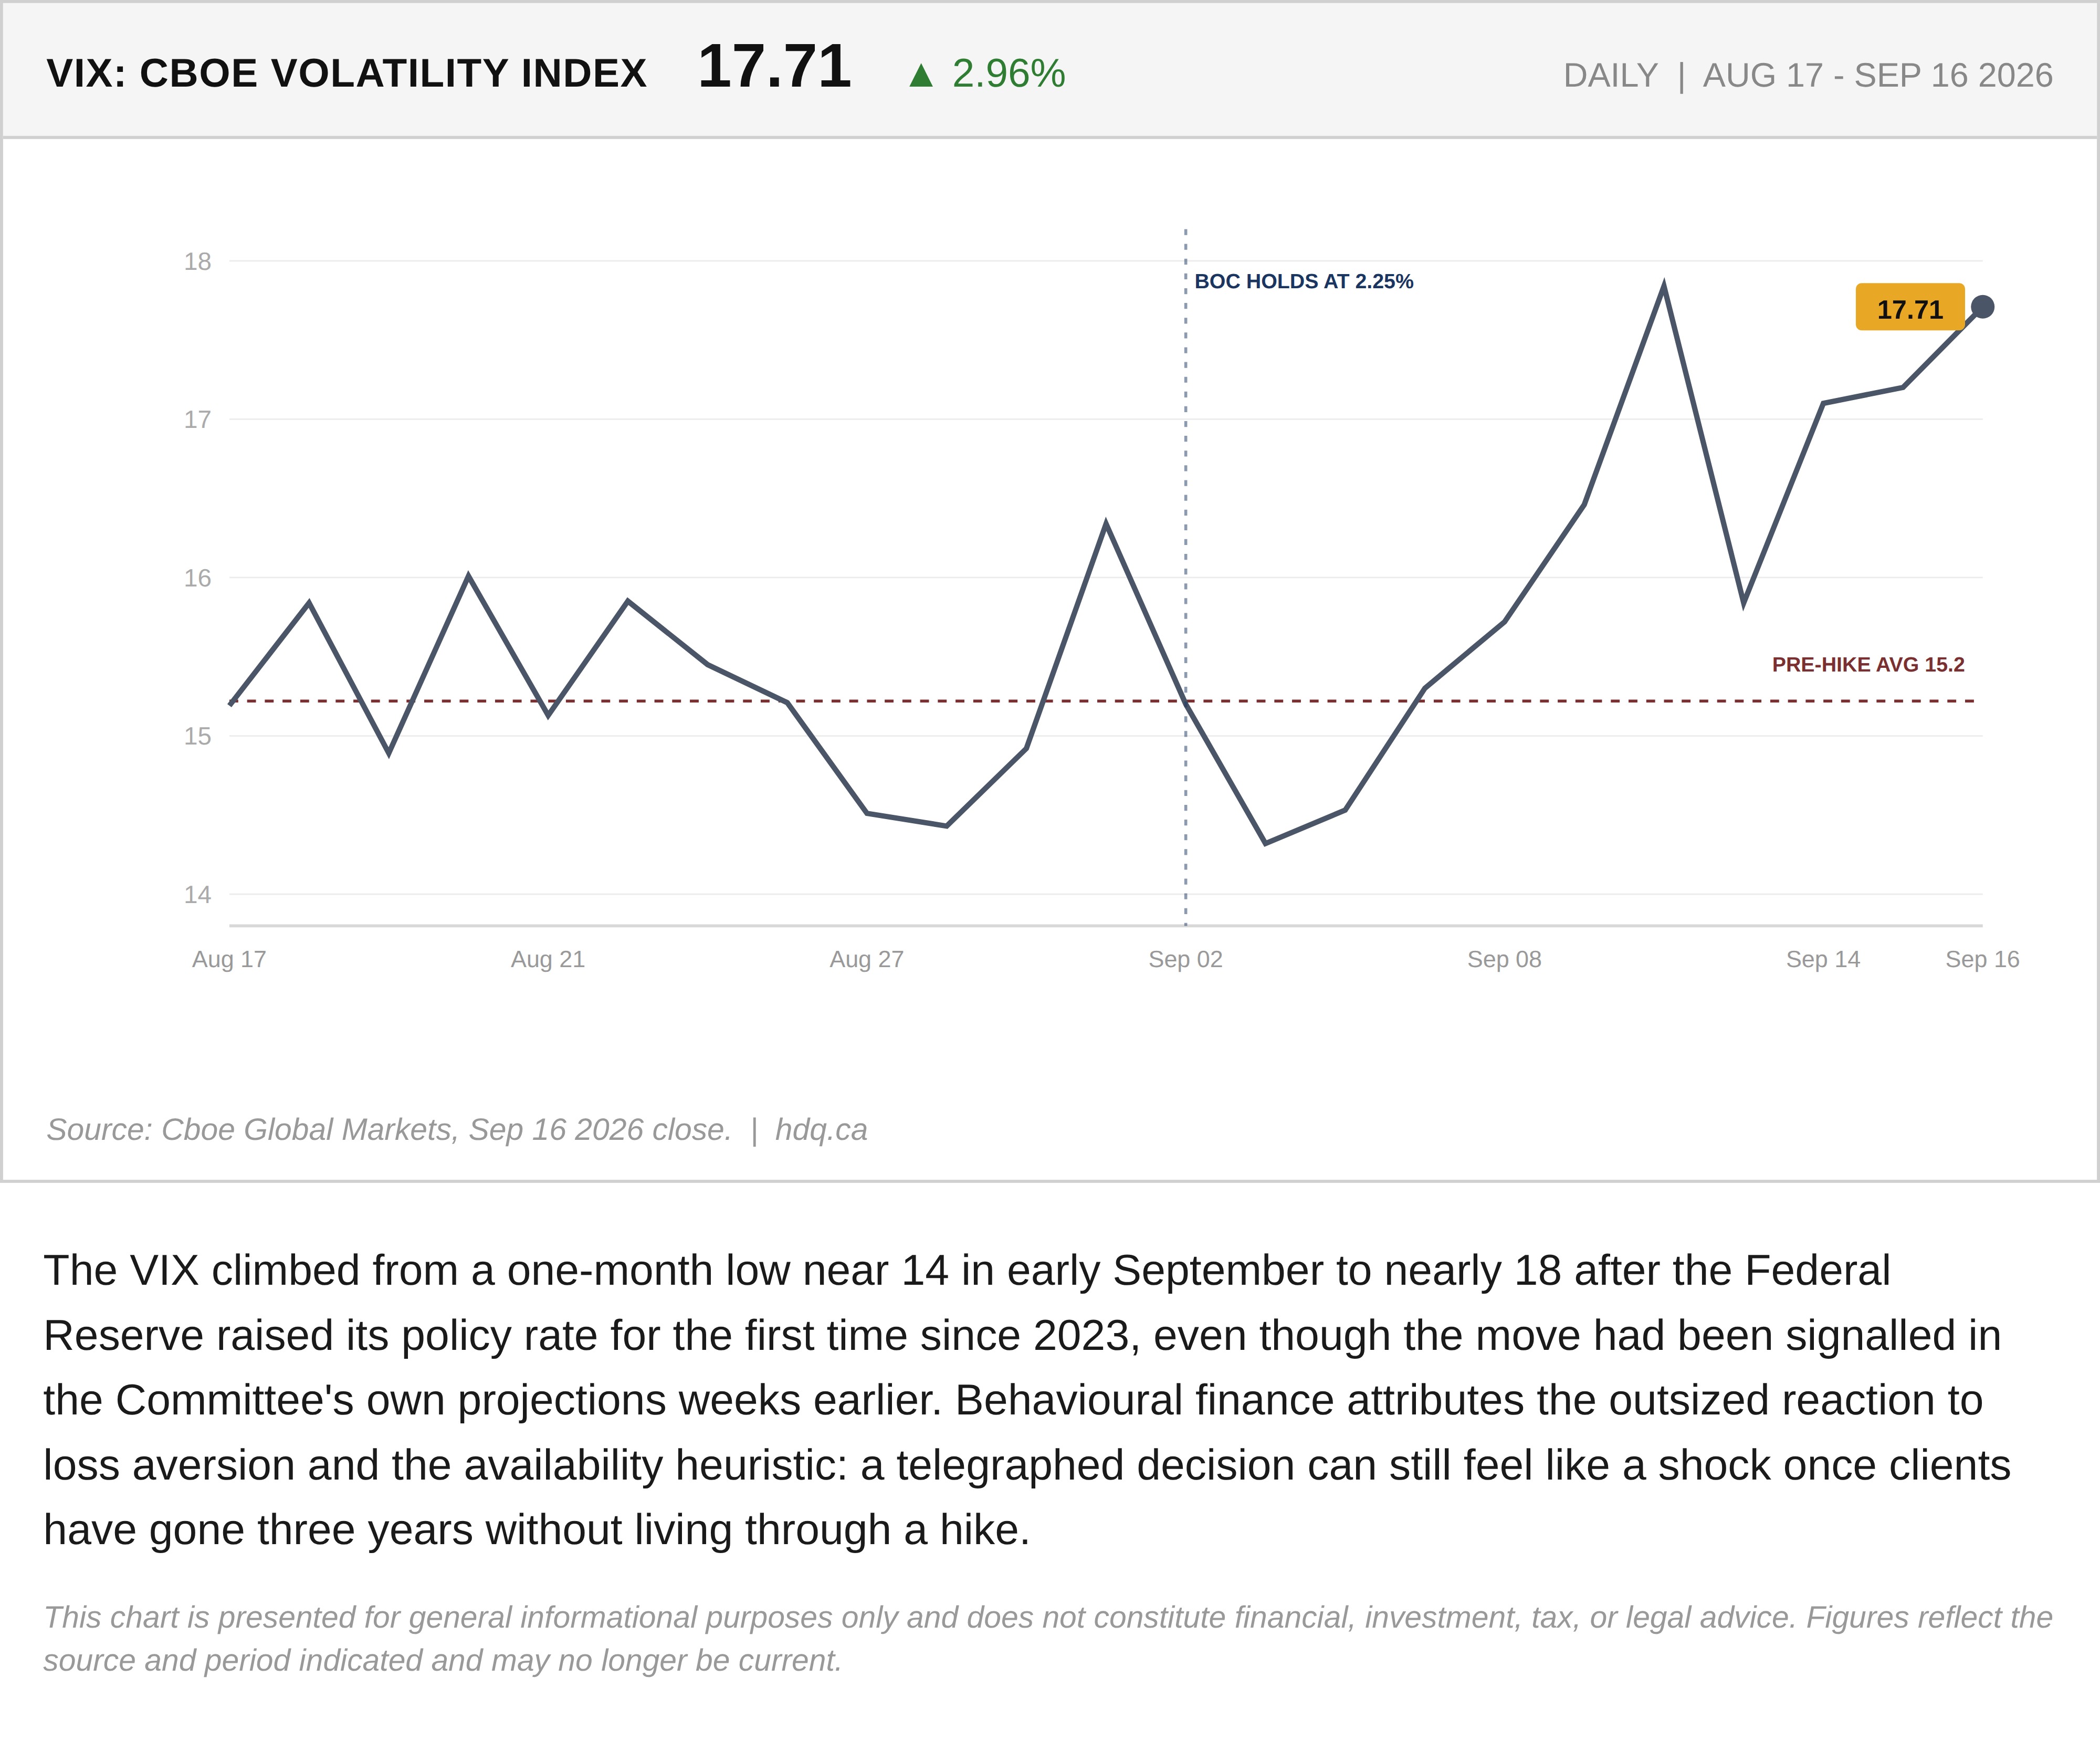
The VIX climbed from a one-month low near 14 in early September to nearly 18 after the Federal Reserve raised its policy rate for the first time since 2023, even though the move had been signalled in the Committee's own projections weeks earlier. Behavioural finance attributes the outsized reaction to loss aversion and the availability heuristic: a telegraphed decision can still feel like a shock once clients have gone three years without living through a hike.
This chart is presented for general informational purposes only and does not constitute financial, investment, tax, or legal advice. Figures reflect the source and period indicated and may no longer be current.
Related charts
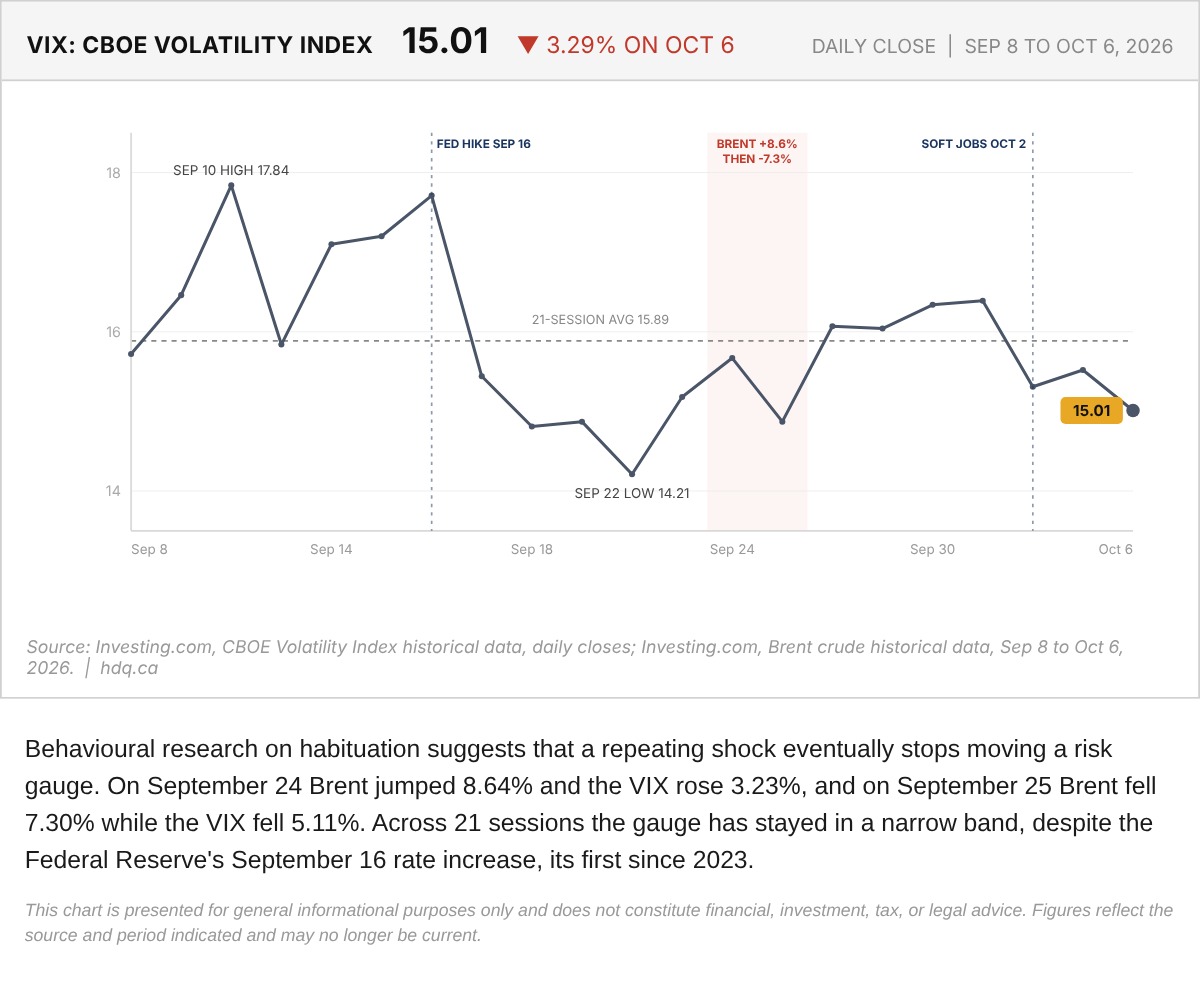
Behavioural research on habituation suggests that a repeating shock eventually stops moving a risk gauge.
VIX Daily Close and Habituation to Oil Shocks, September 8 to October 6
October 7, 2026
View chart & download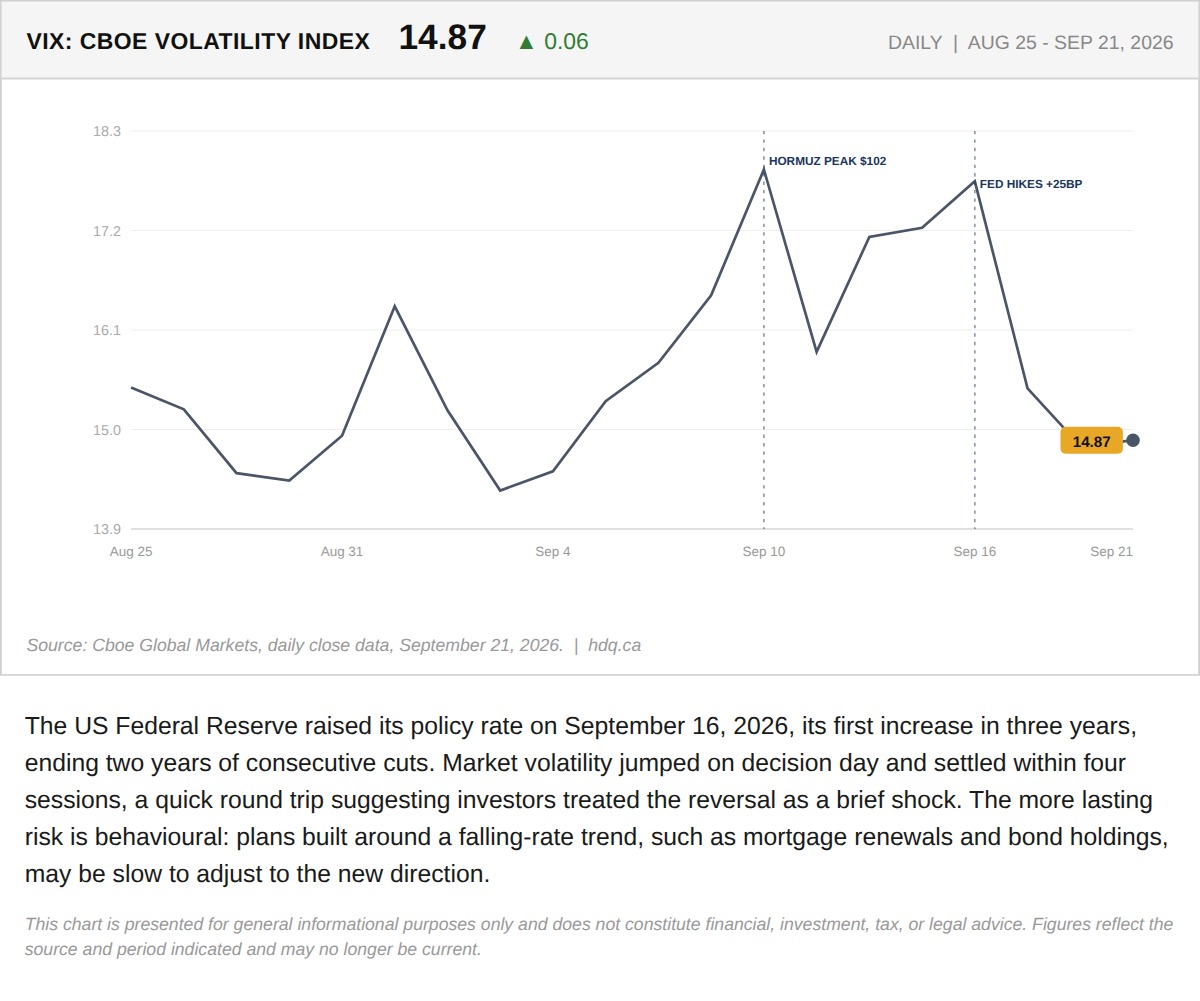
The US Federal Reserve raised its policy rate on September 16, 2026, its first increase in three years, ending two years of consecutive cuts.
The Anchoring Bias Behind the Fed Rate Shock
September 22, 2026
View chart & download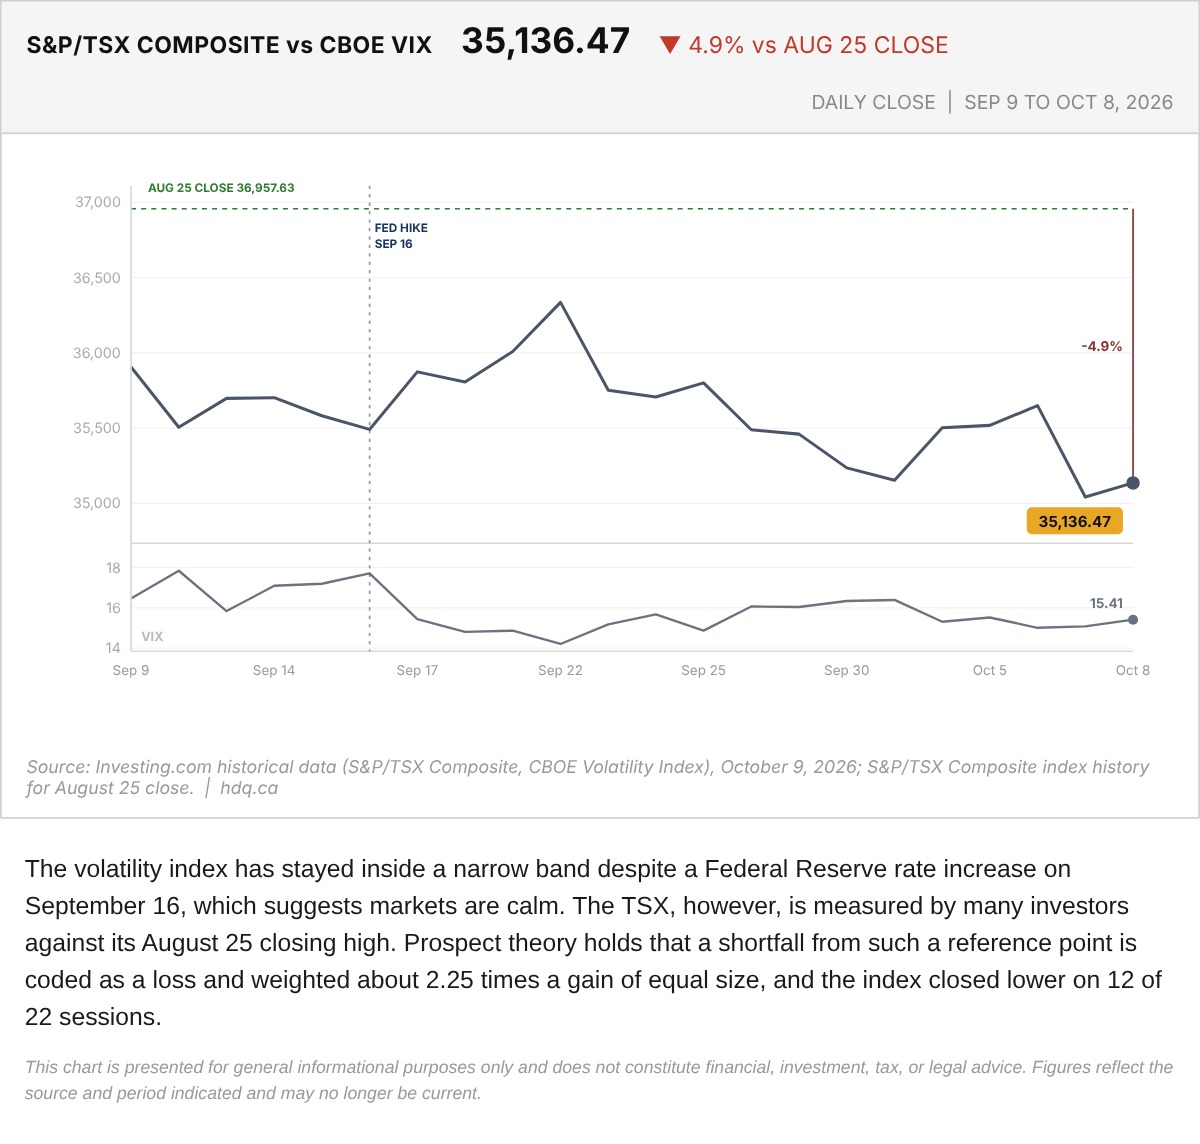
The volatility index has stayed inside a narrow band despite a Federal Reserve rate increase on September 16, which suggests markets are calm.
S&P/TSX Composite Against the Cboe VIX, September 9 to October 8
October 9, 2026
View chart & download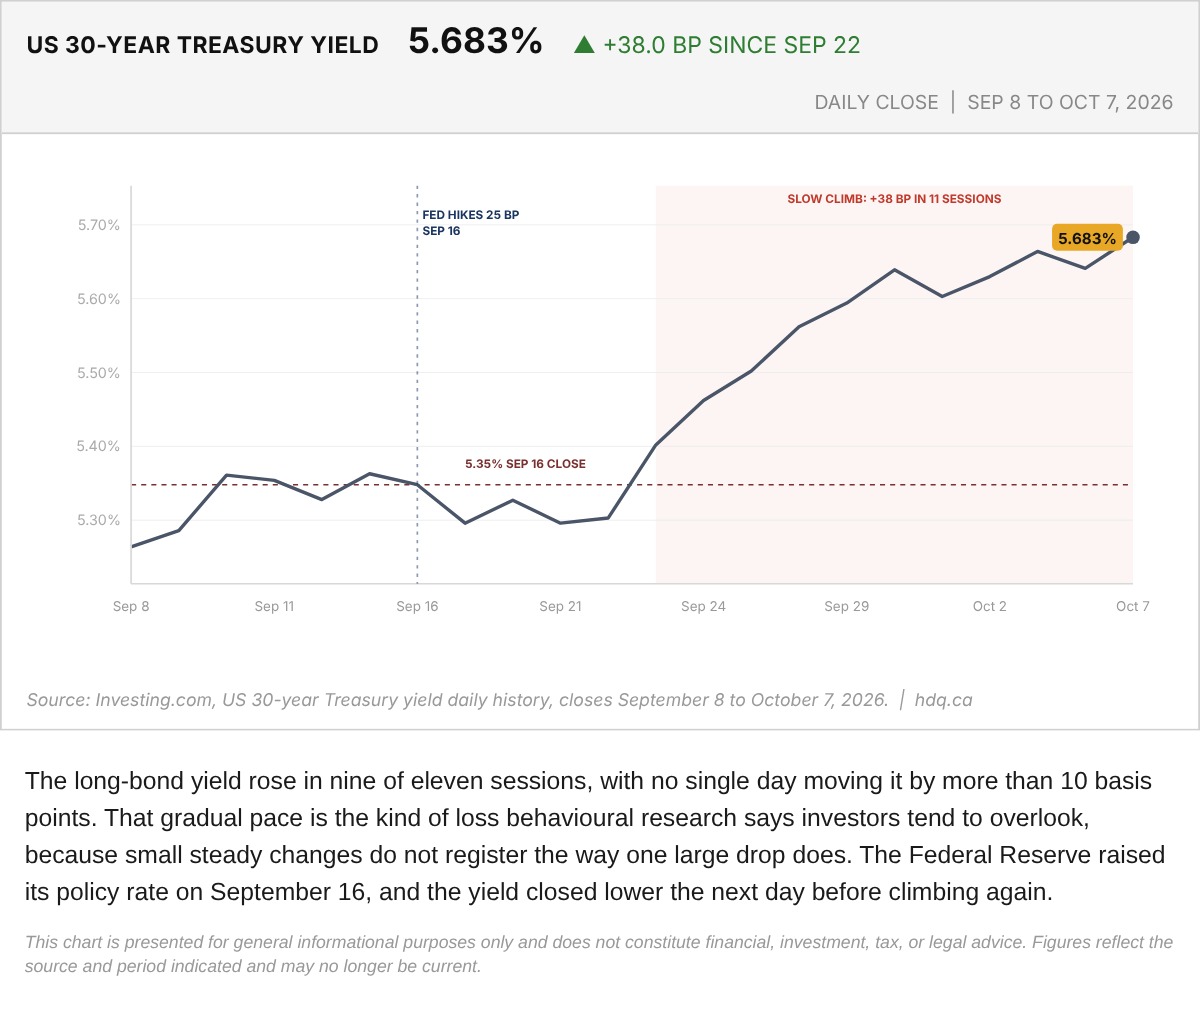
The long-bond yield rose in nine of eleven sessions, with no single day moving it by more than 10 basis points.
US 30-Year Treasury Yield Daily Close, September 8 to October 7
October 8, 2026
View chart & download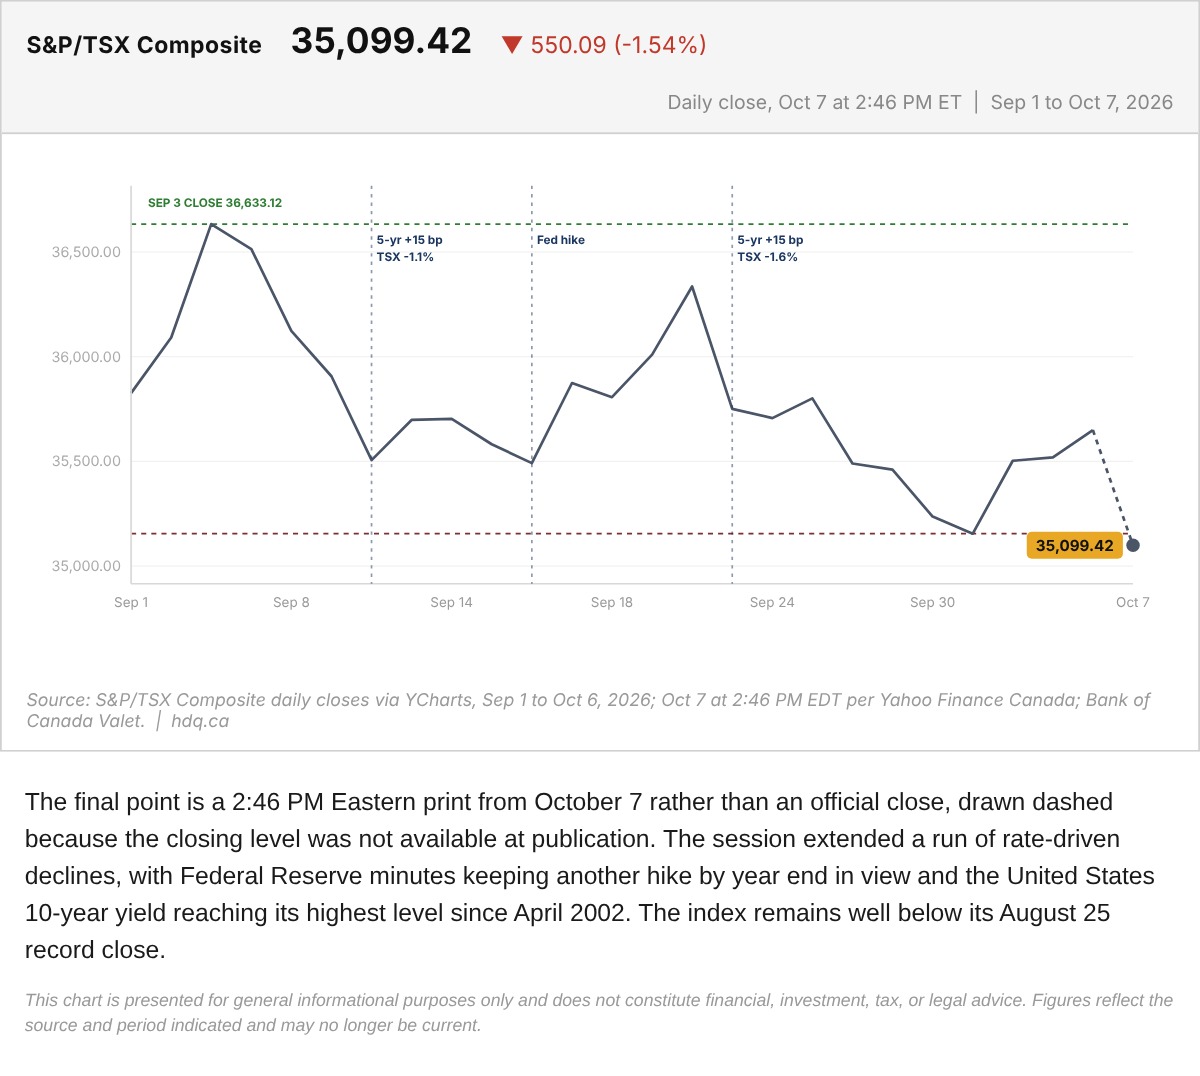
The final point is a 2:46 PM Eastern print from October 7 rather than an official close, drawn dashed because the closing level was not available at publication.
S&P/TSX Composite With the October 7 Midday Print
October 7, 2026
View chart & download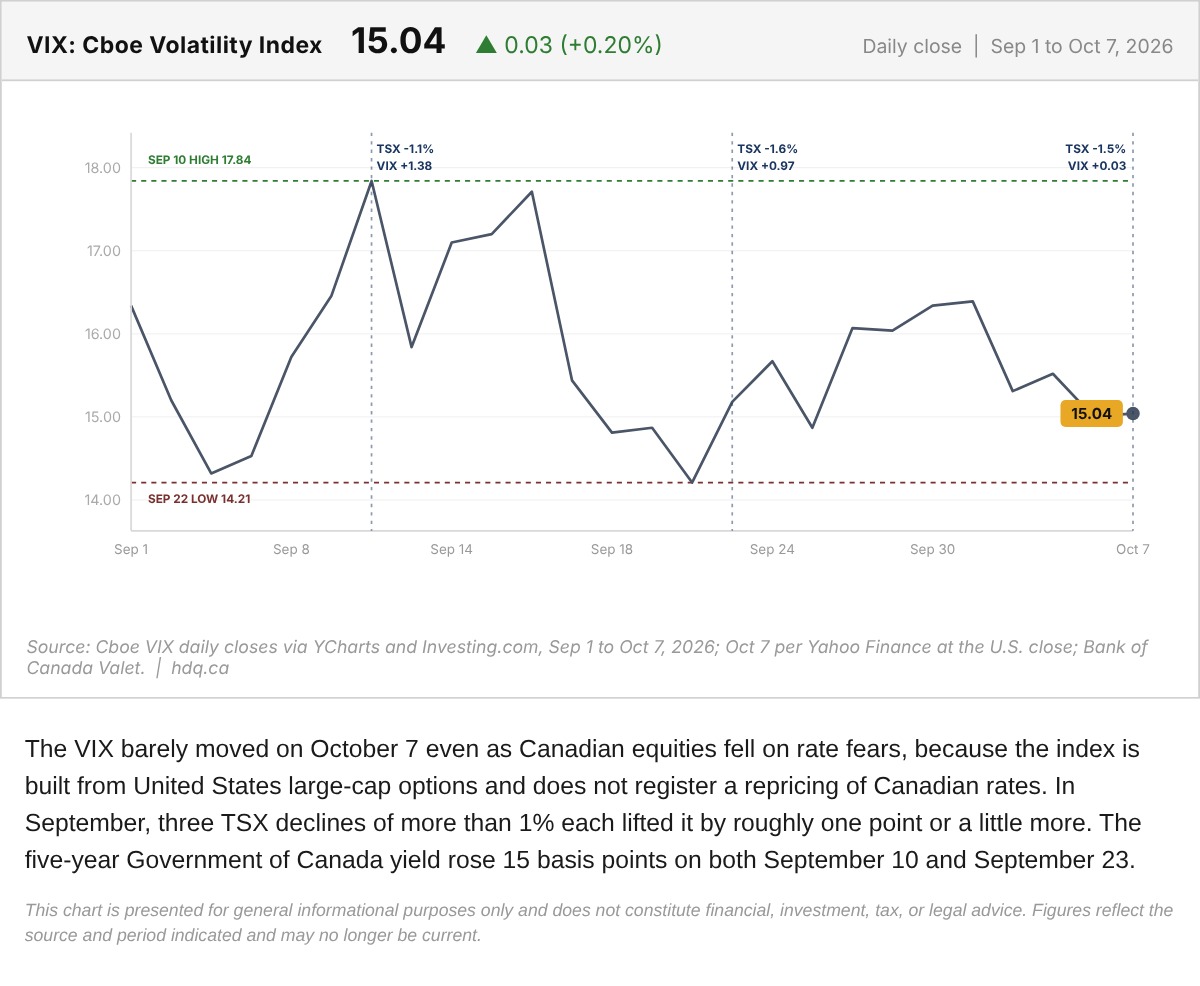
The VIX barely moved on October 7 even as Canadian equities fell on rate fears, because the index is built from United States large-cap…
VIX Daily Close on the Day Rate Fear Hit the TSX
October 7, 2026
View chart & download