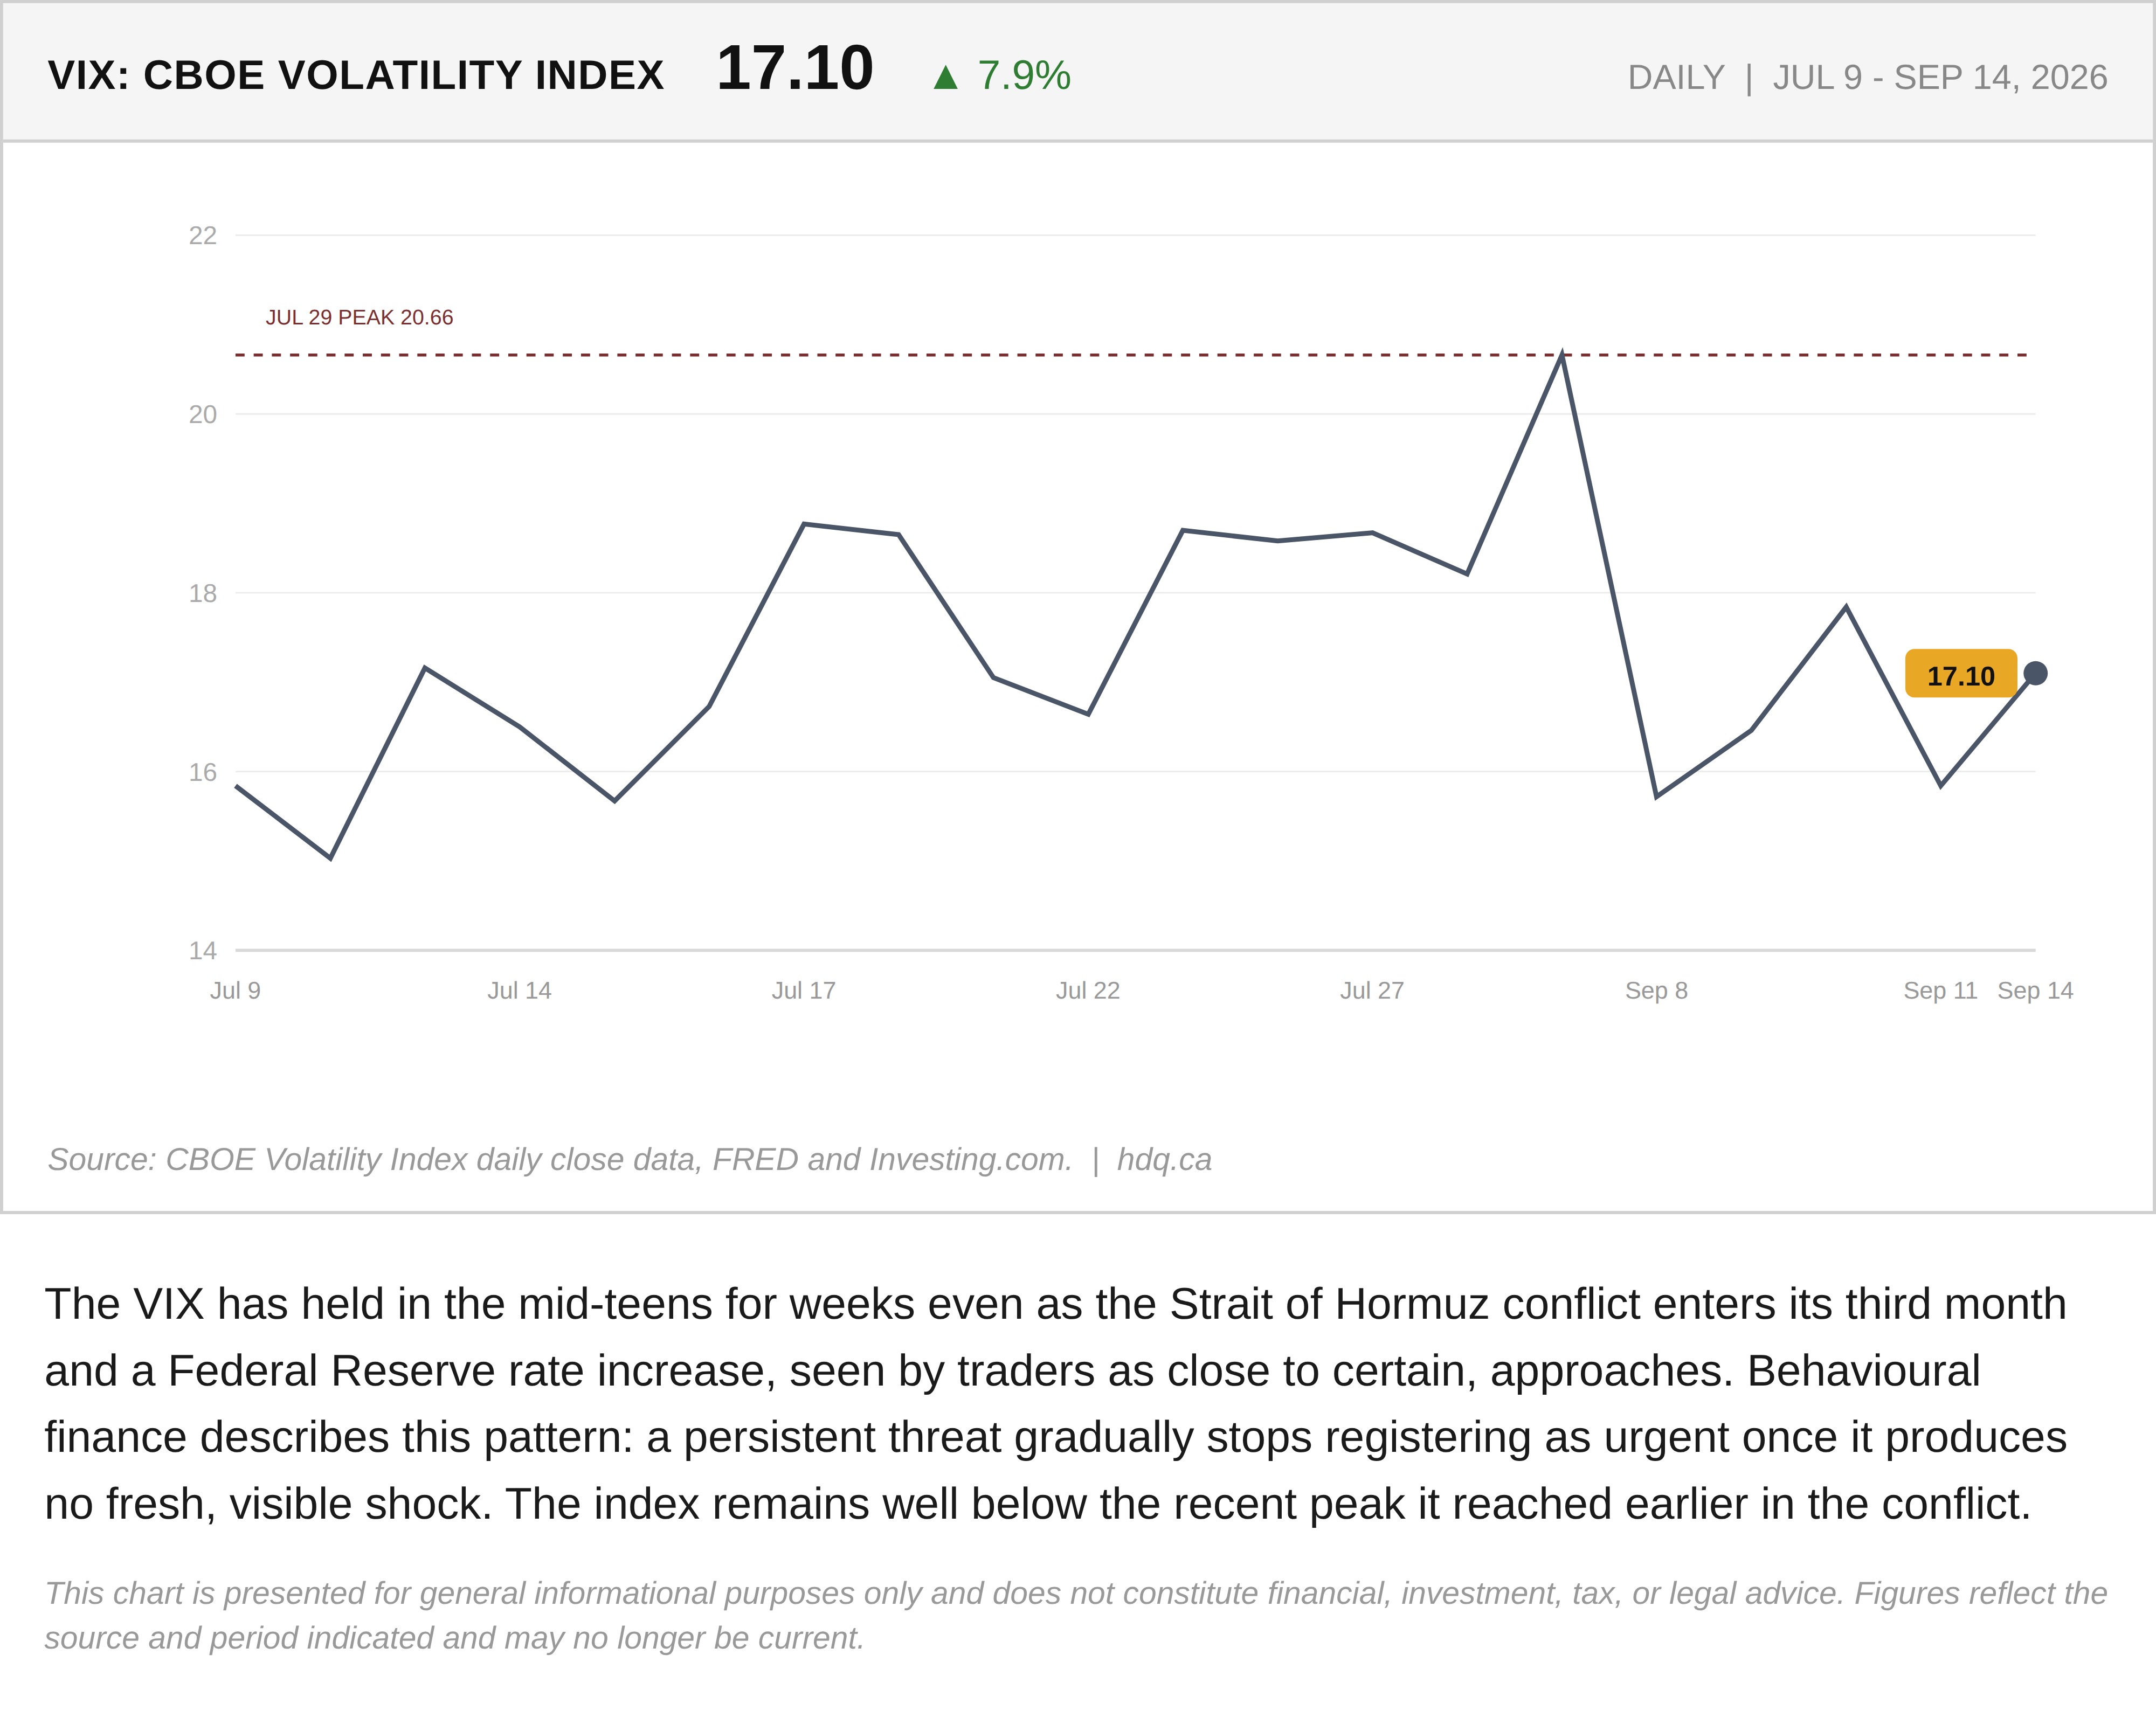
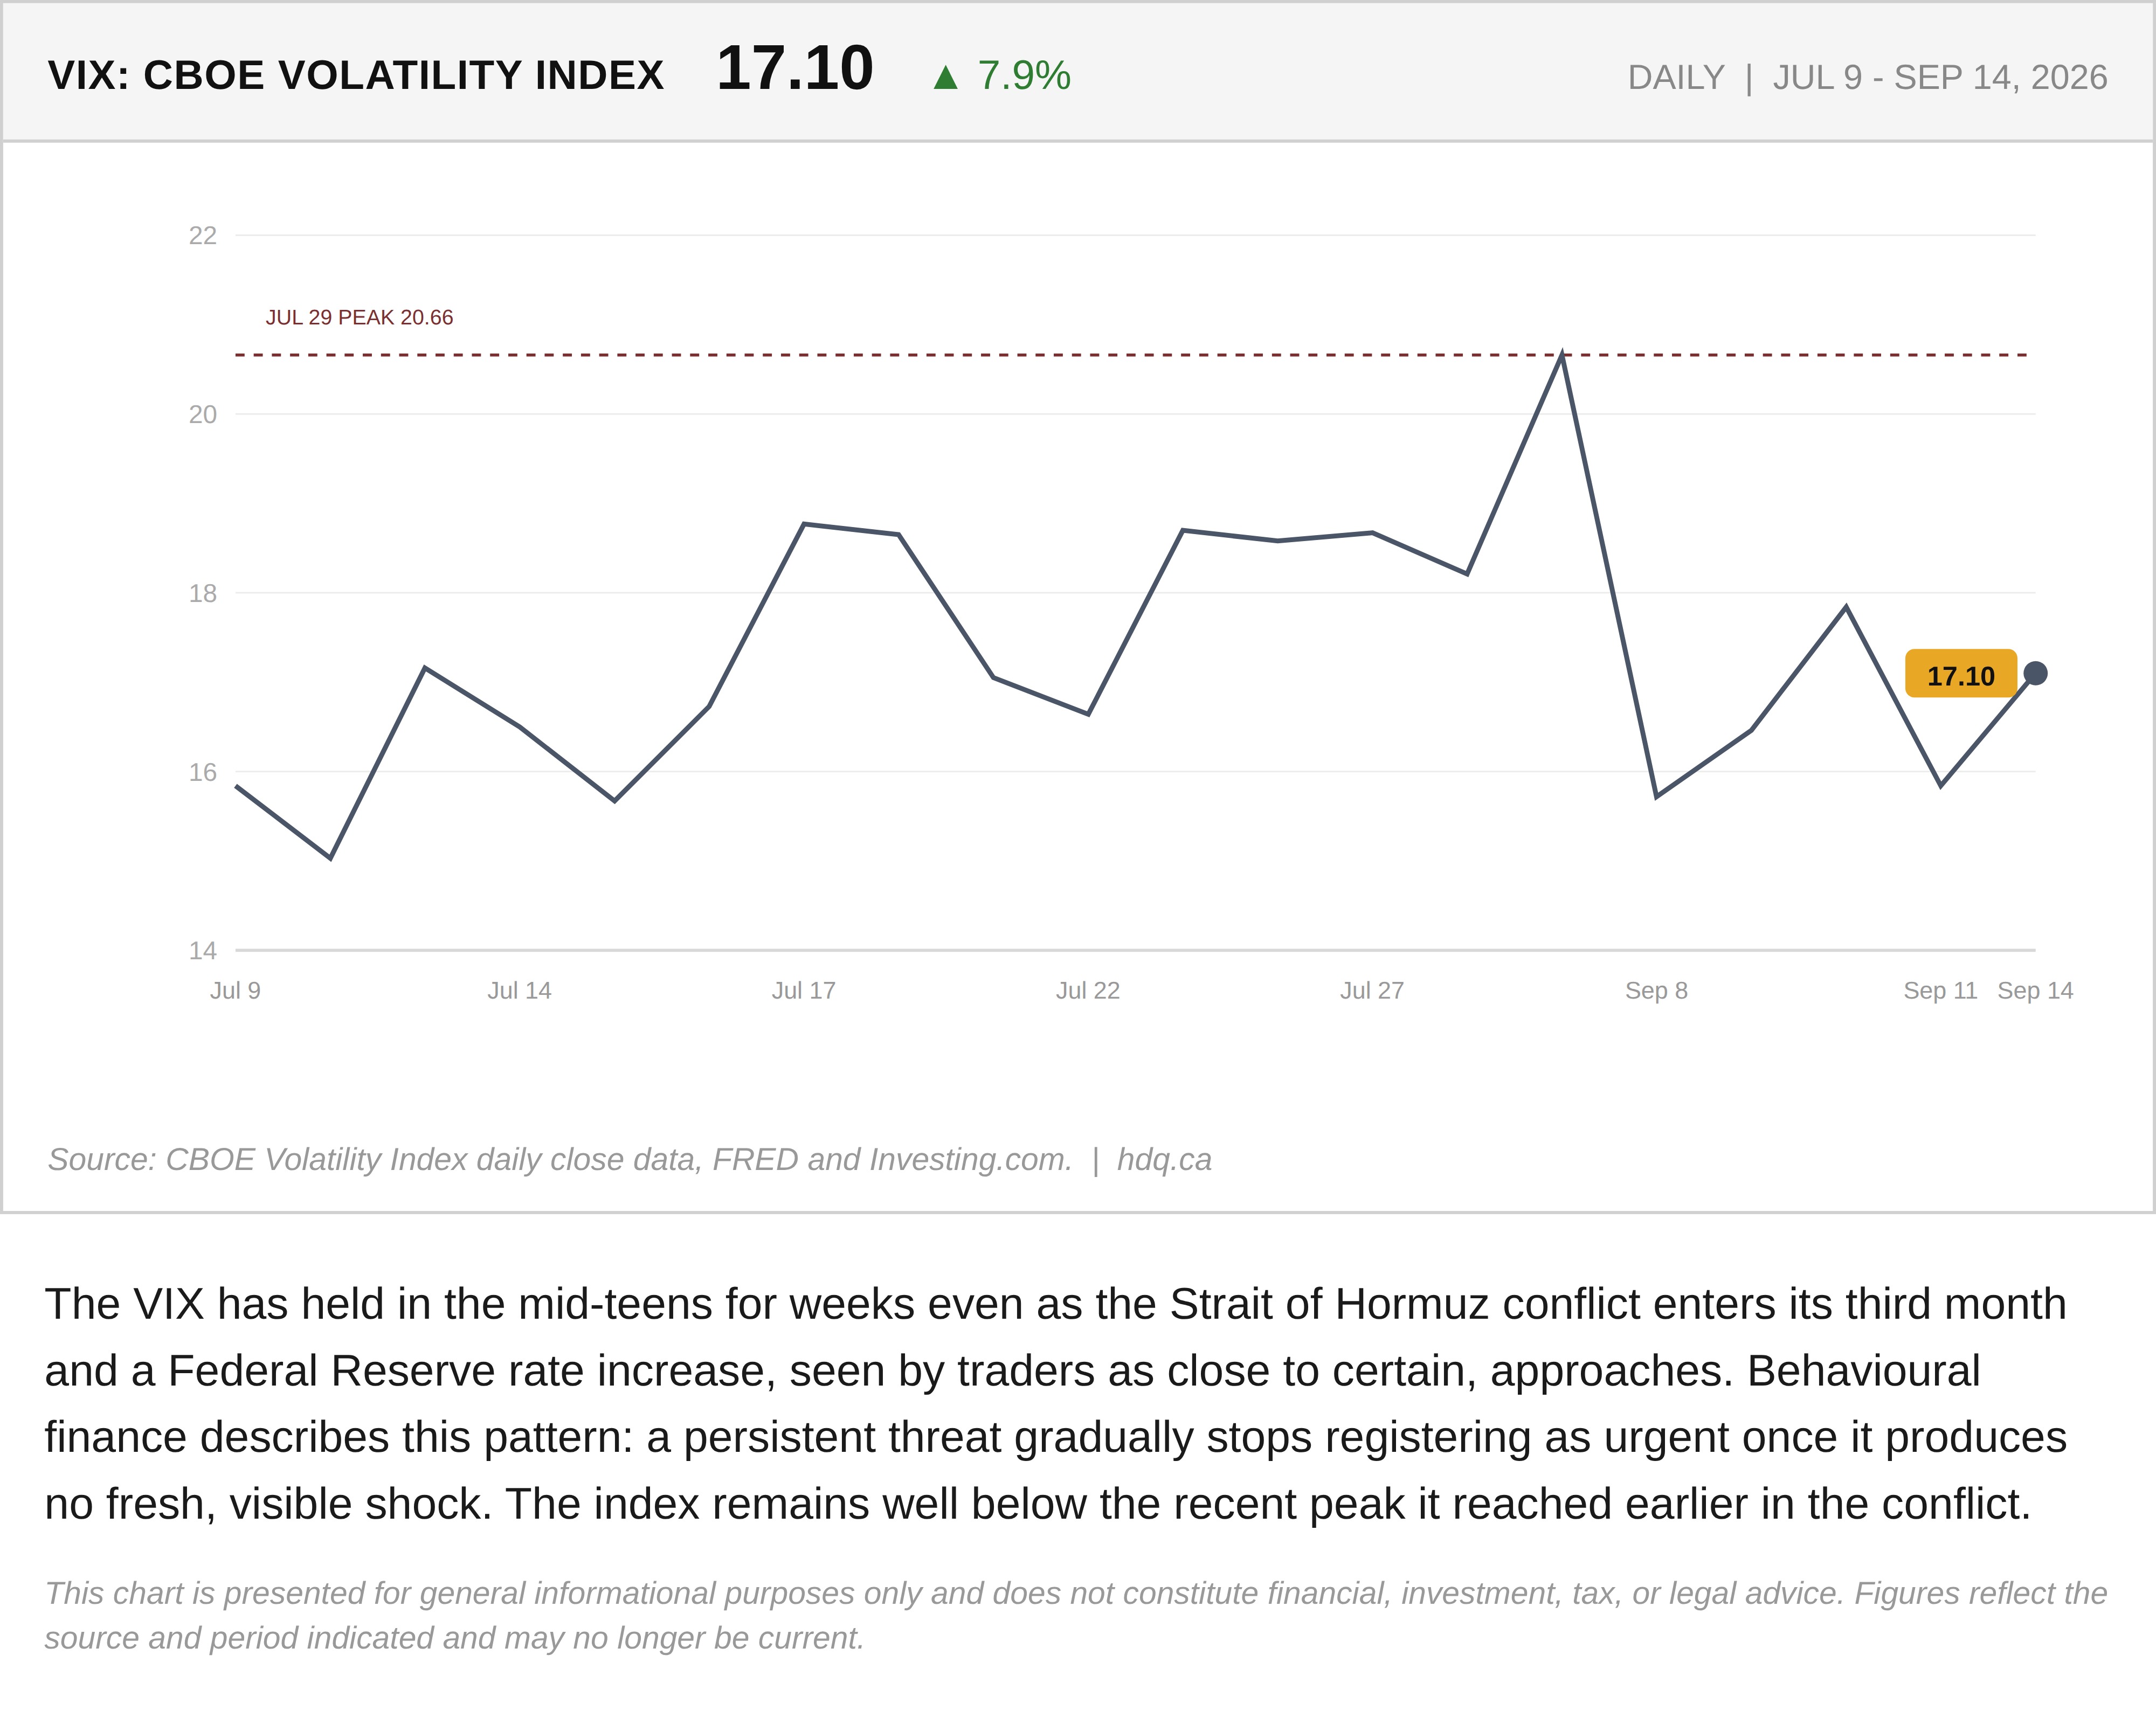
The VIX has held in the mid-teens for weeks even as the Strait of Hormuz conflict enters its third month and a Federal Reserve rate increase, seen by traders as close to certain, approaches. Behavioural finance describes this pattern: a persistent threat gradually stops registering as urgent once it produces no fresh, visible shock. The index remains well below the recent peak it reached earlier in the conflict.
This chart is presented for general informational purposes only and does not constitute financial, investment, tax, or legal advice. Figures reflect the source and period indicated and may no longer be current.
Related charts
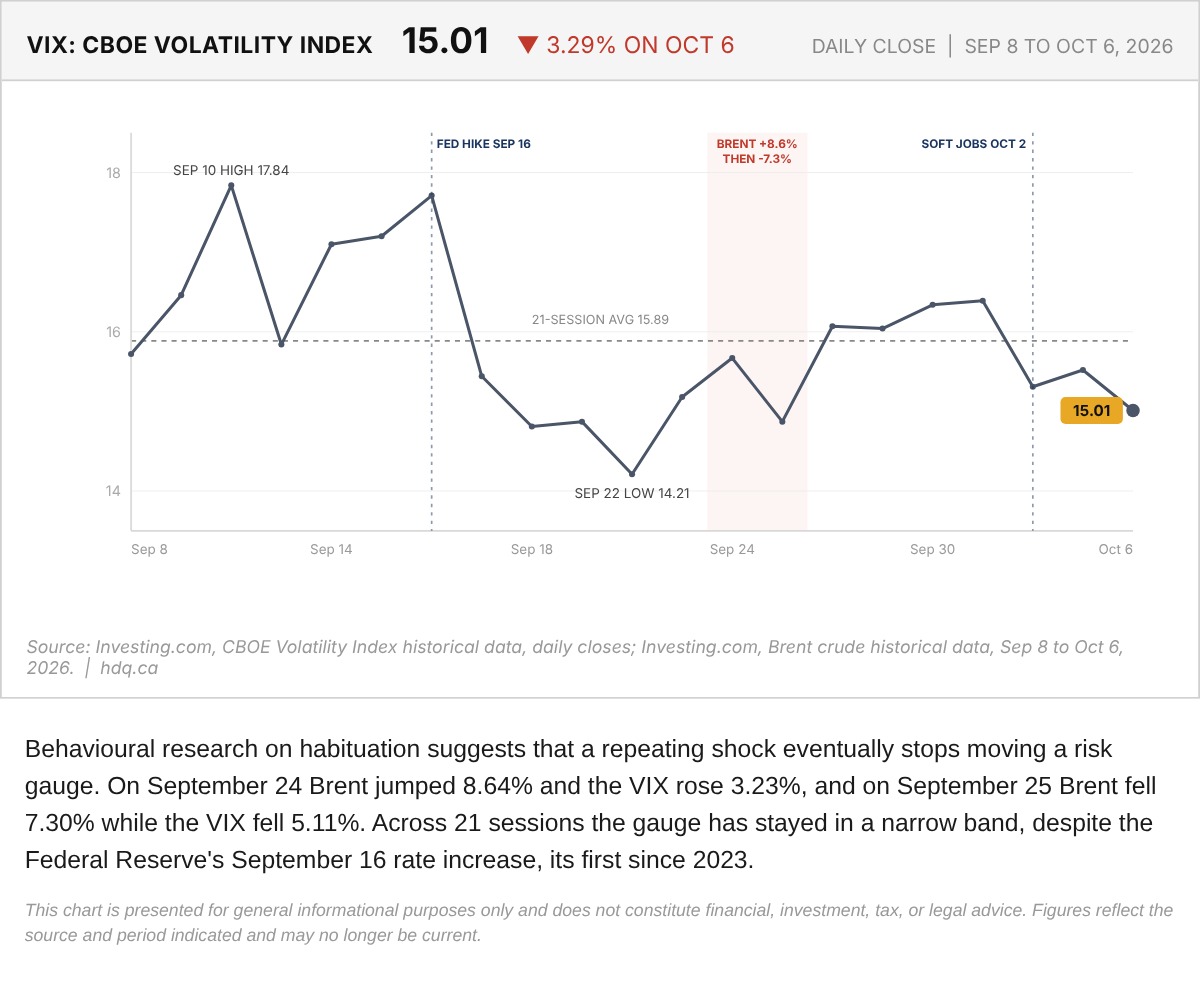
Behavioural research on habituation suggests that a repeating shock eventually stops moving a risk gauge.
VIX Daily Close and Habituation to Oil Shocks, September 8 to October 6
October 7, 2026
View chart & download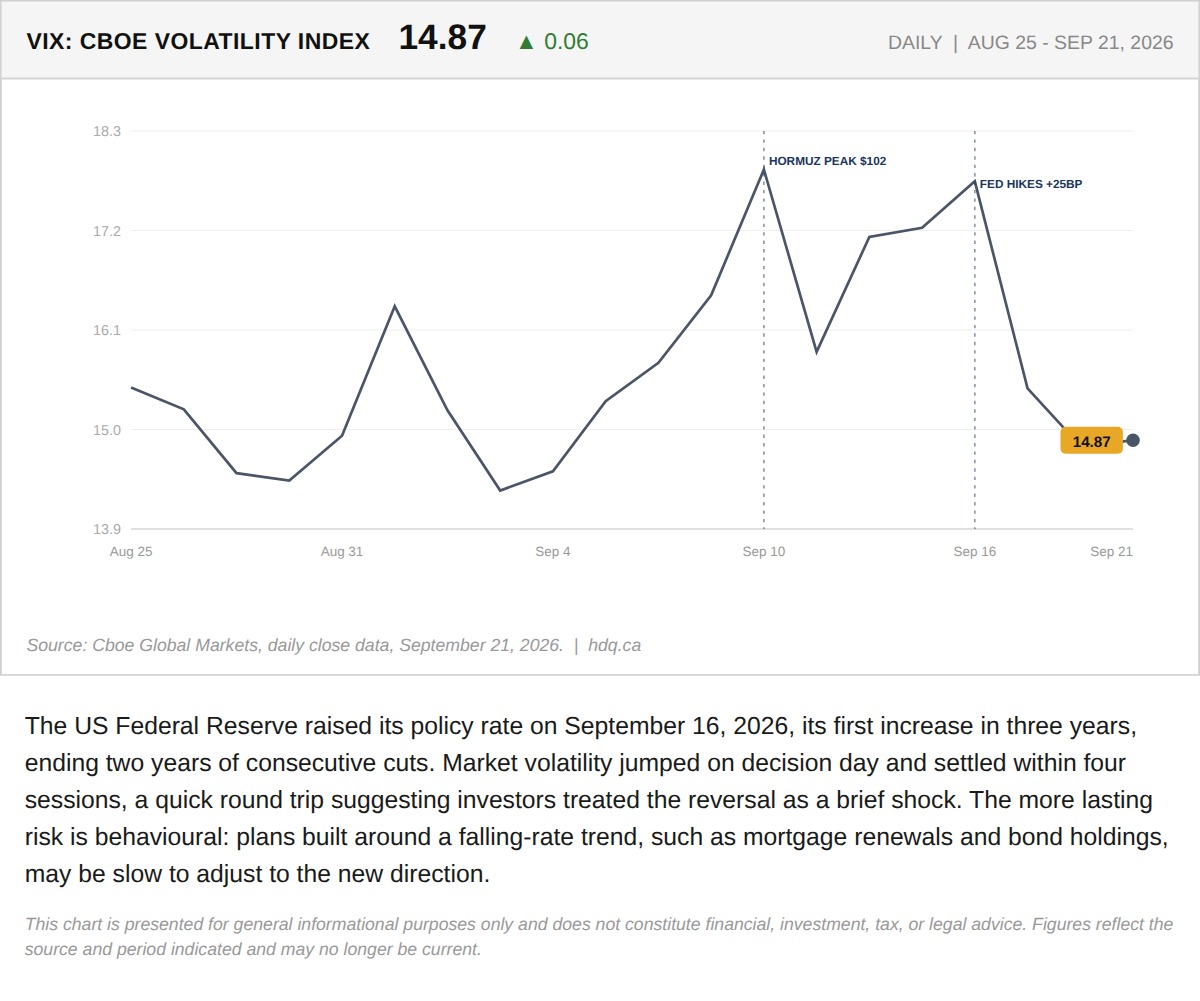
The US Federal Reserve raised its policy rate on September 16, 2026, its first increase in three years, ending two years of consecutive cuts.
The Anchoring Bias Behind the Fed Rate Shock
September 22, 2026
View chart & download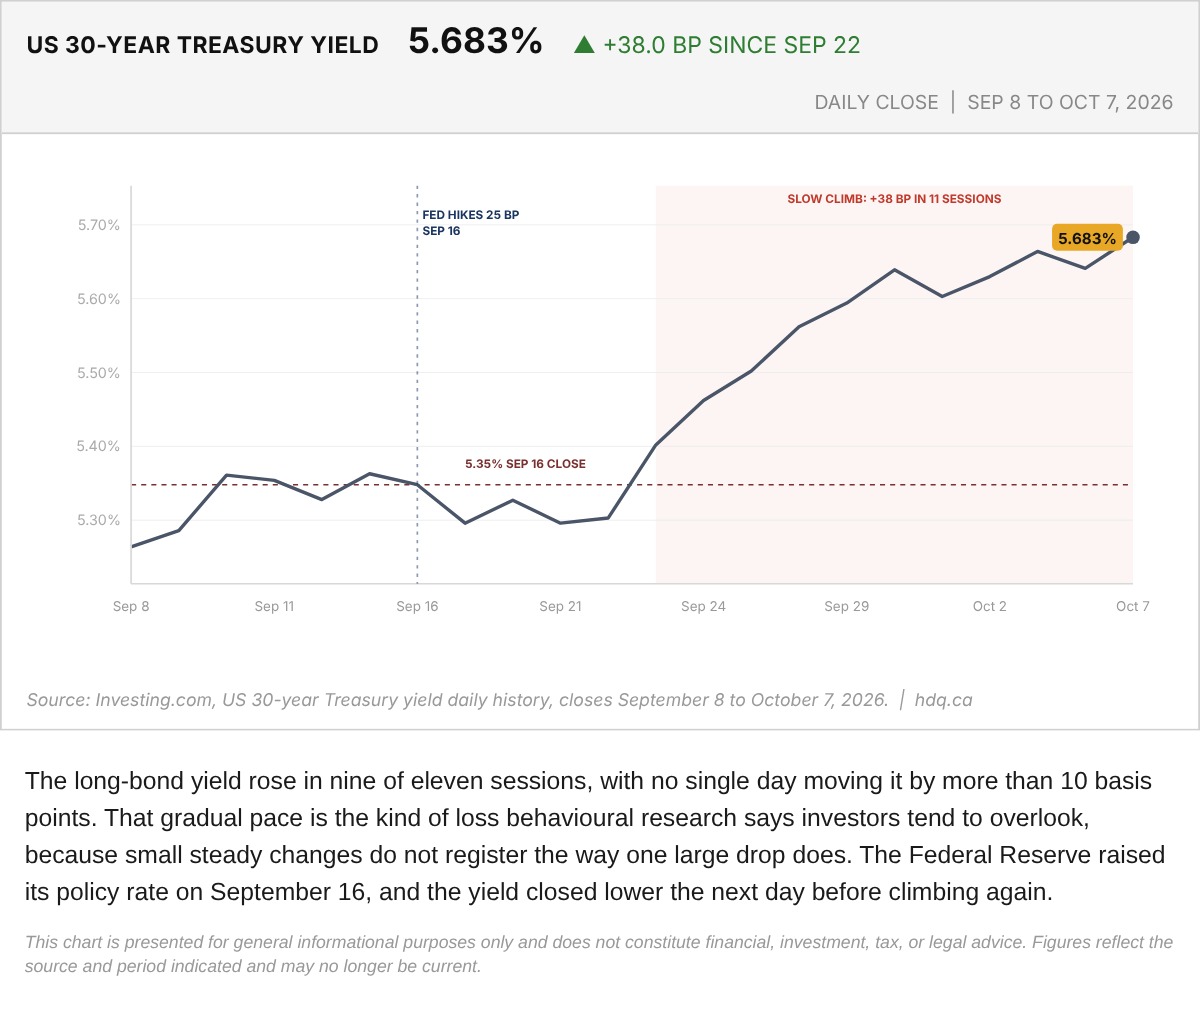
The long-bond yield rose in nine of eleven sessions, with no single day moving it by more than 10 basis points.
US 30-Year Treasury Yield Daily Close, September 8 to October 7
October 8, 2026
View chart & download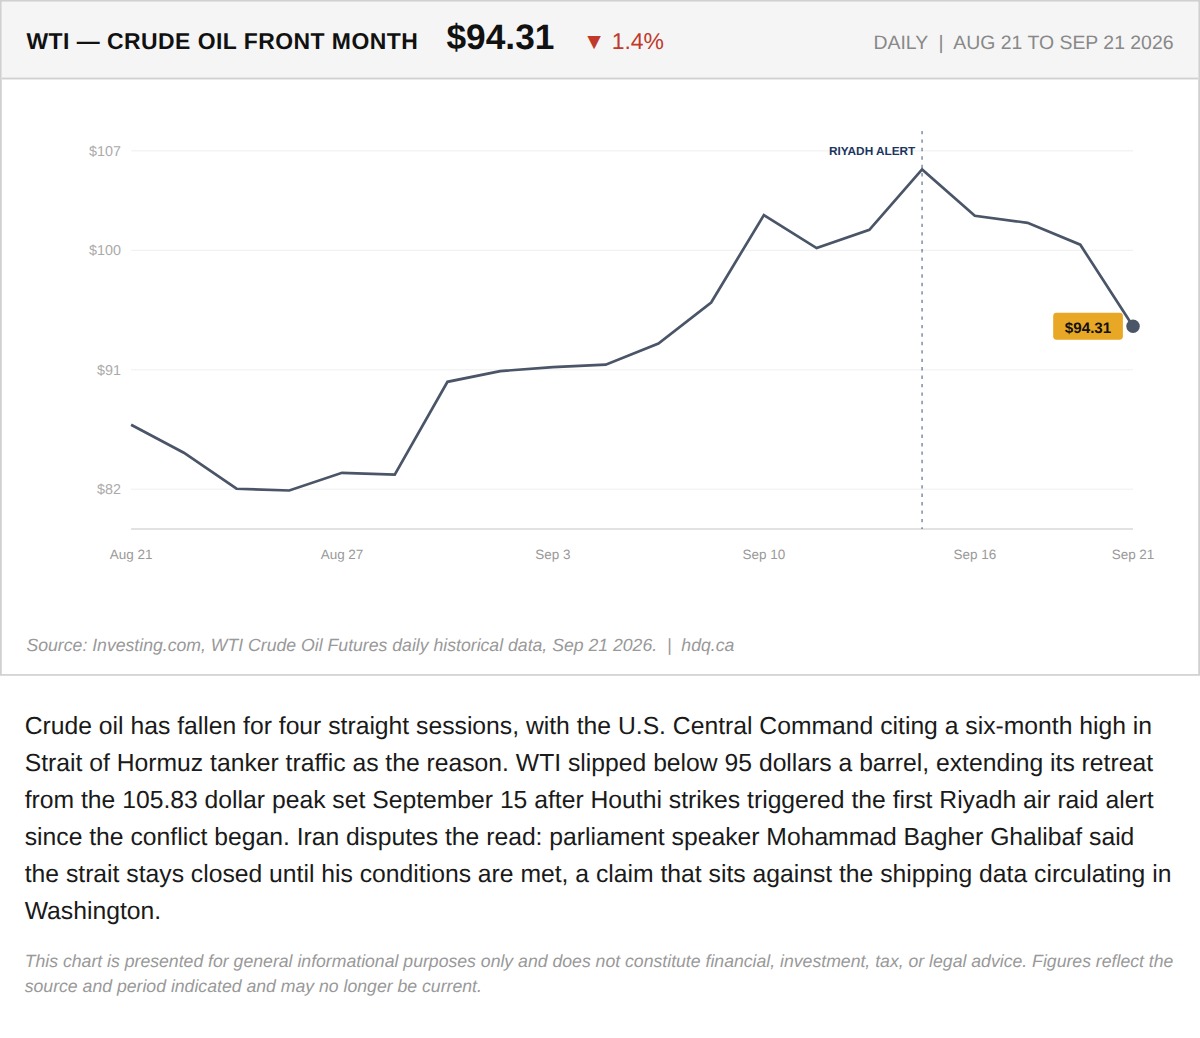
Crude oil has fallen for four straight sessions, with the U.S.
Oil Falls for a Fourth Session as Hormuz Shipping Data Is Disputed
September 21, 2026
View chart & download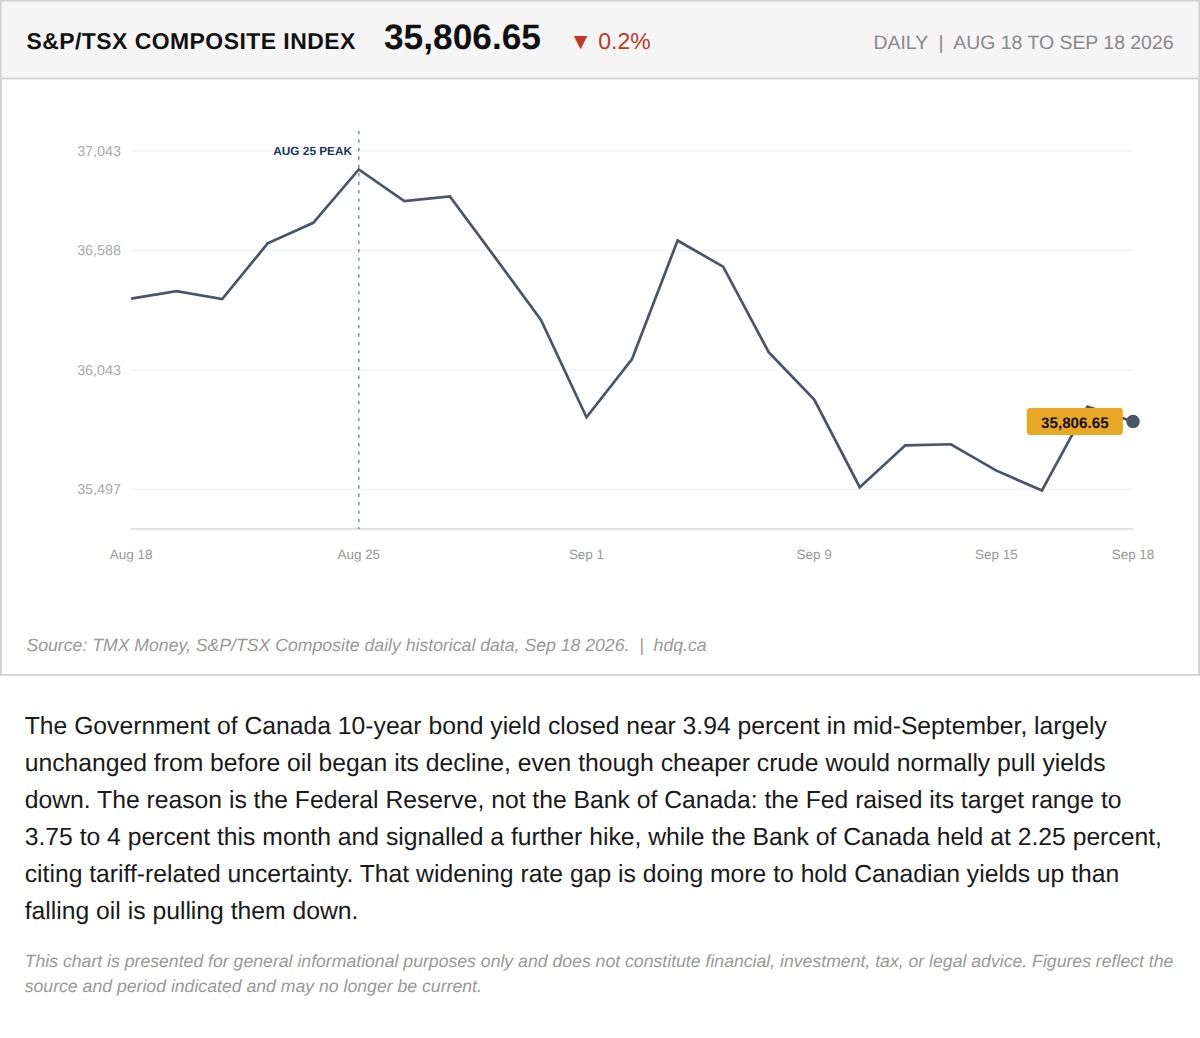
The Government of Canada 10-year bond yield closed near 3.94 percent in mid-September, largely unchanged from before oil began its decline,…
TSX Slides as Canadian Bond Yields Stay Elevated Despite Falling Oil
September 21, 2026
View chart & download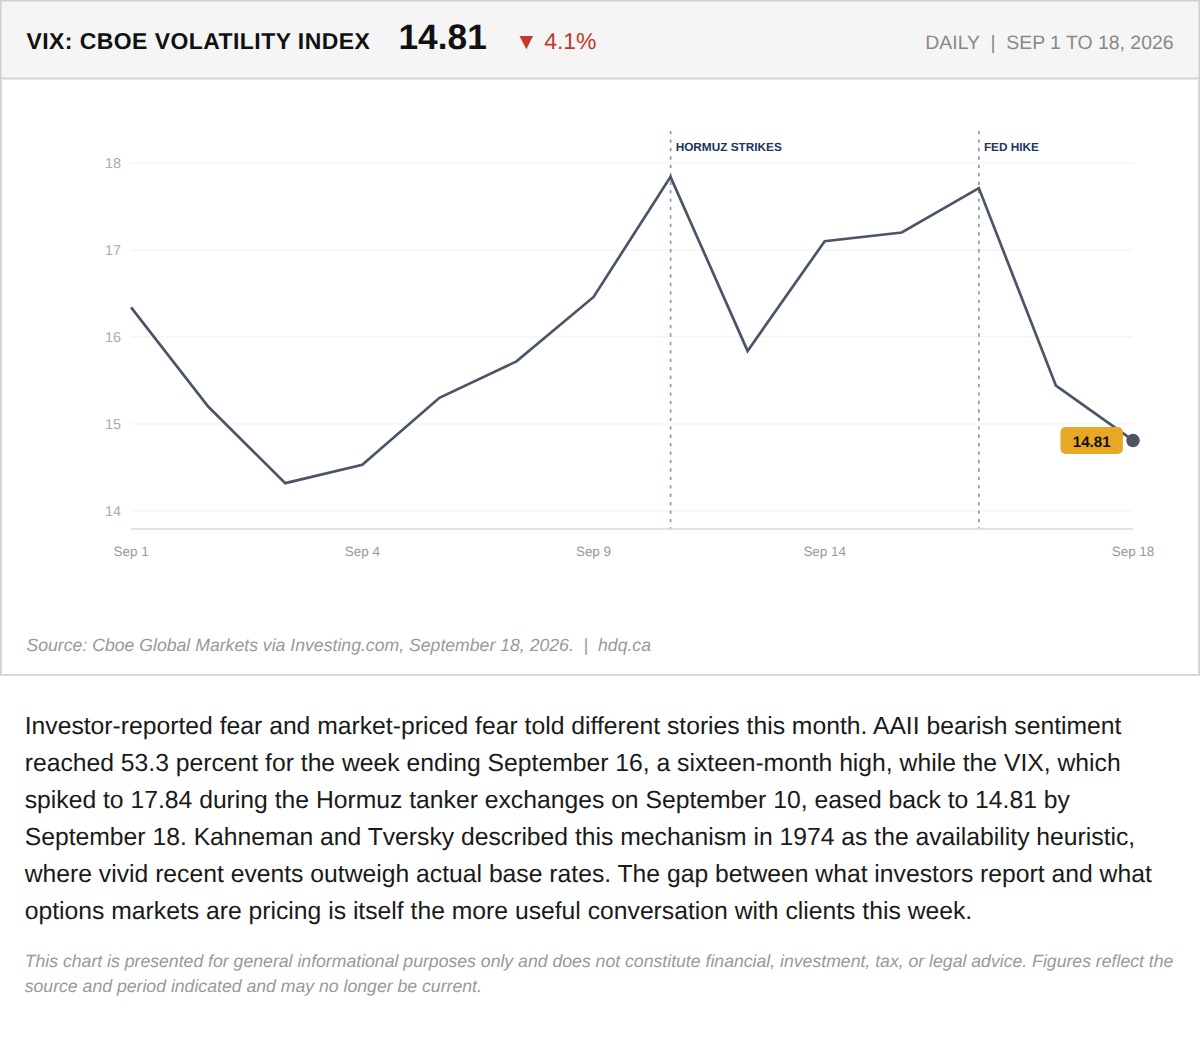
Investor-reported fear and market-priced fear told different stories this month.
The Fear Investors Report and the Fear the Market Is Pricing Have Split
September 21, 2026
View chart & download