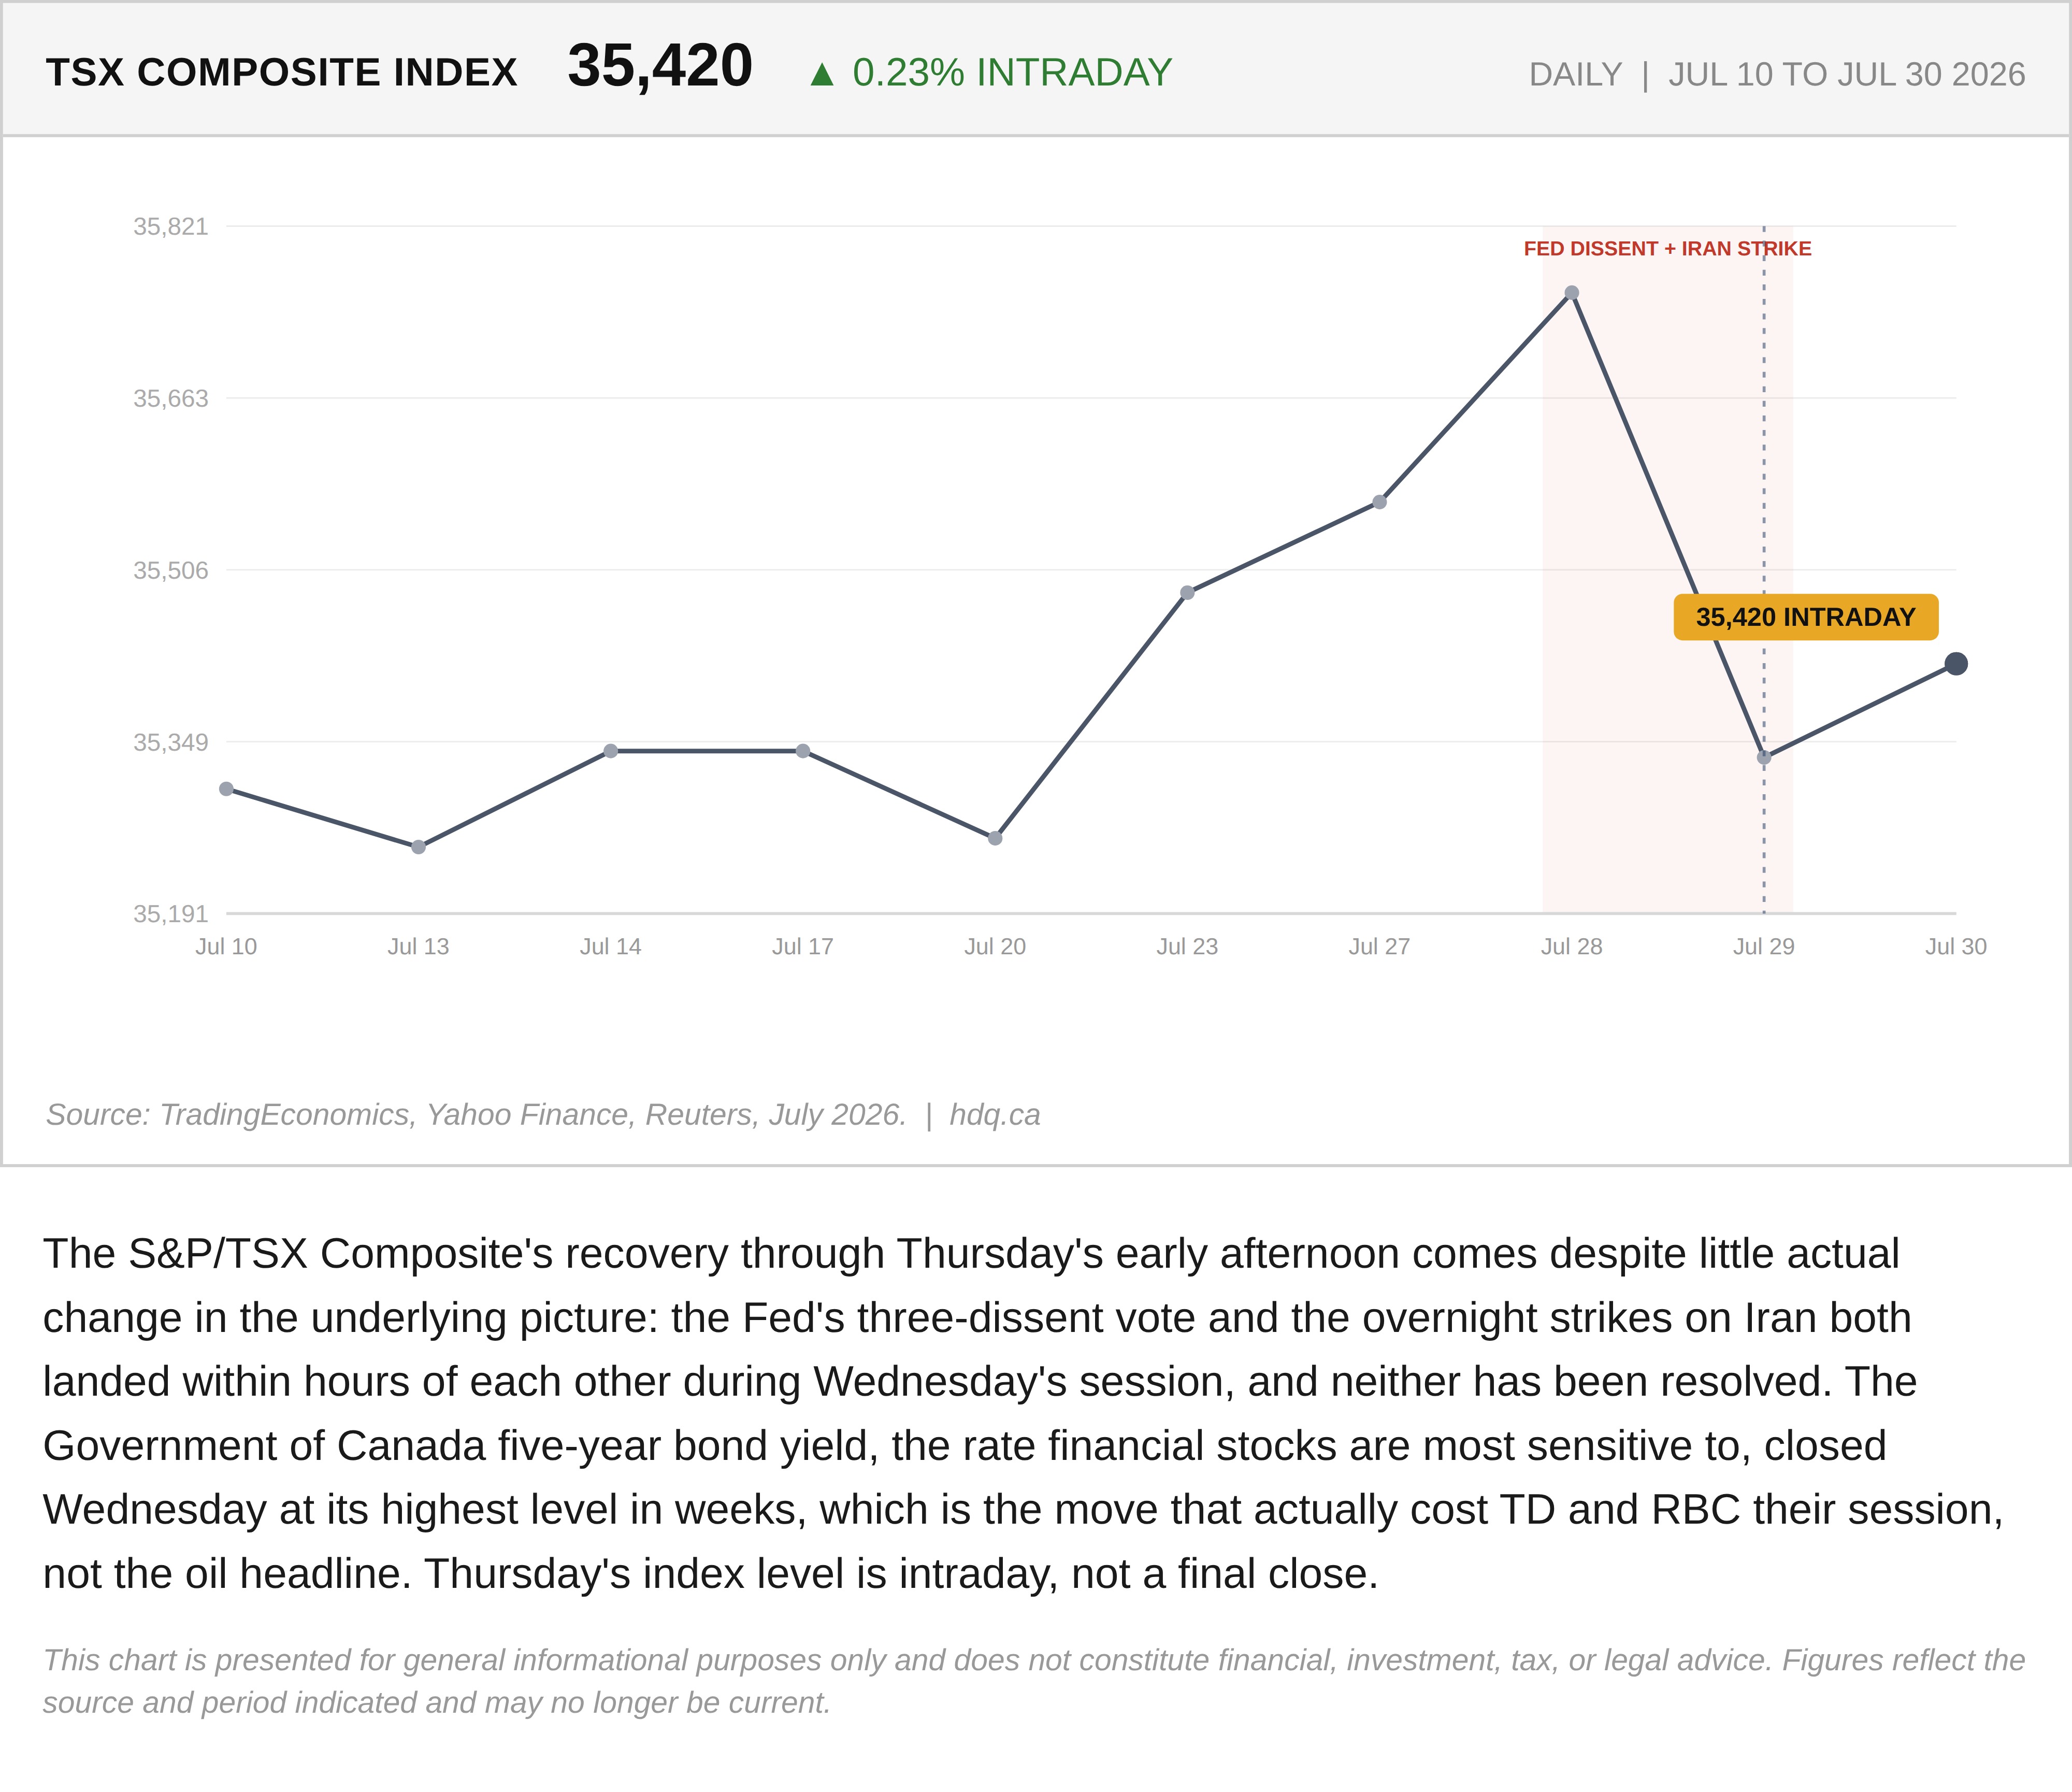
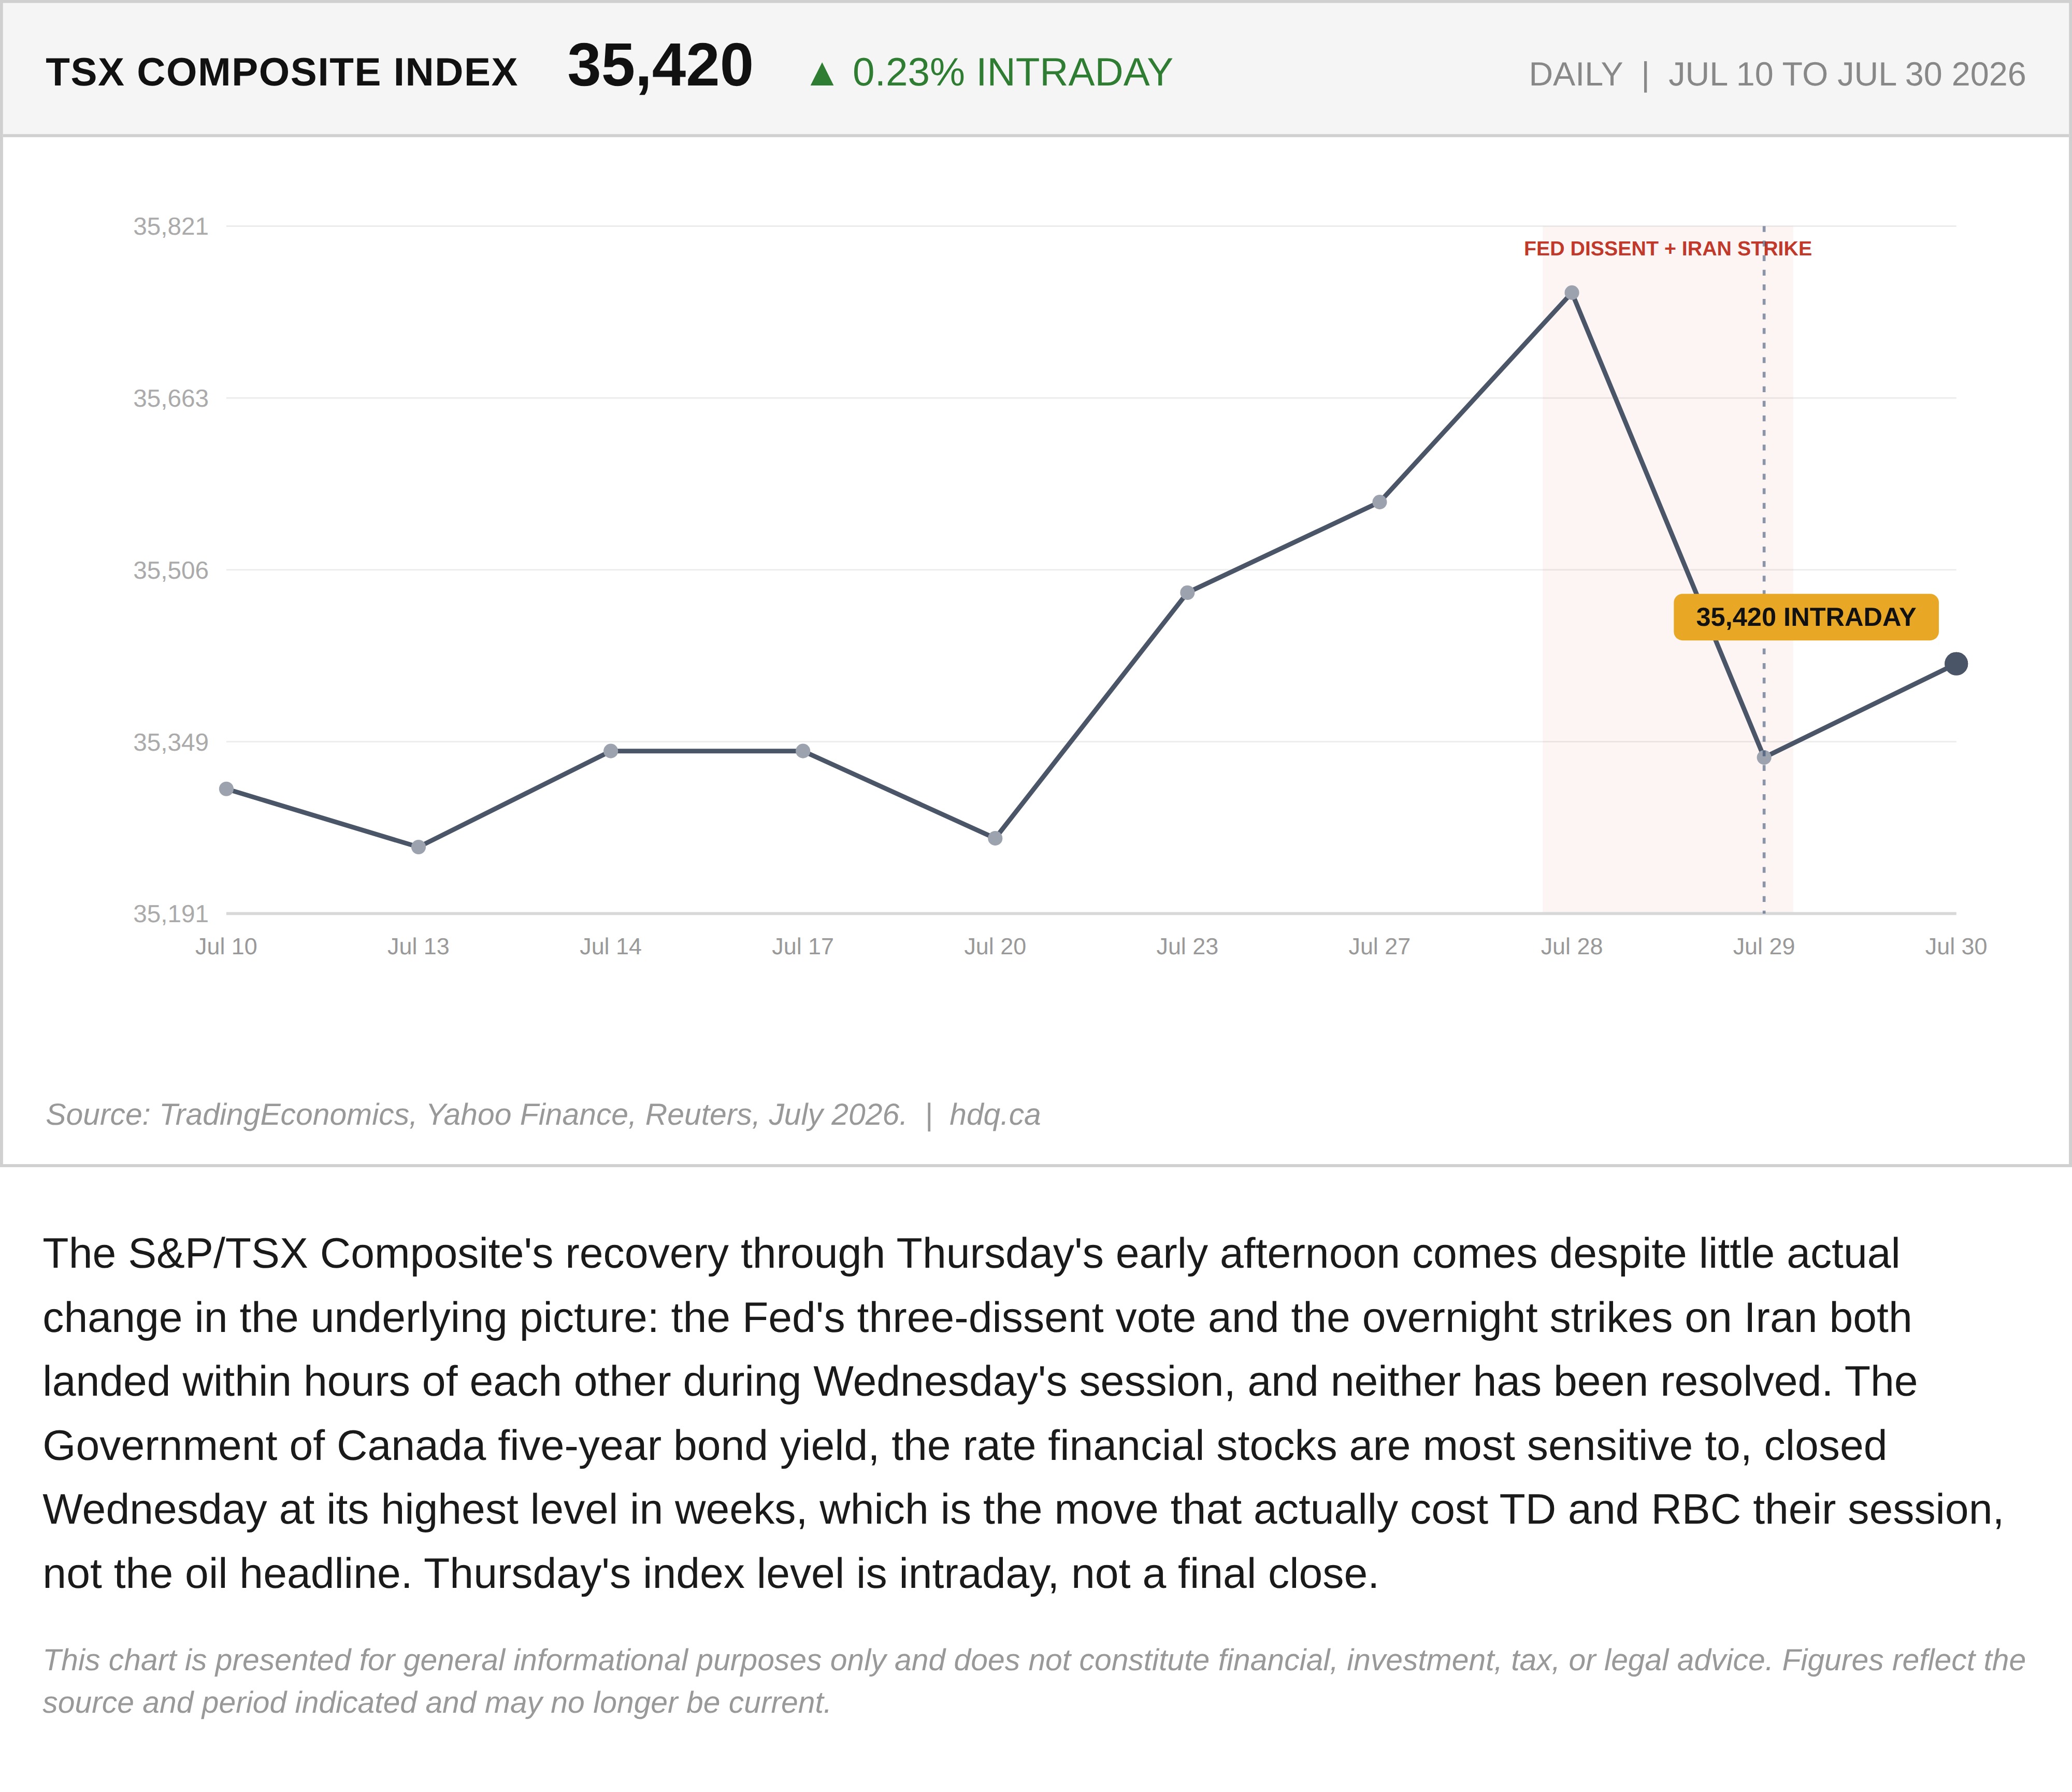
The S&P/TSX Composite's recovery through Thursday's early afternoon comes despite little actual change in the underlying picture: the Fed's three-dissent vote and the overnight strikes on Iran both landed within hours of each other during Wednesday's session, and neither has been resolved. The Government of Canada five-year bond yield, the rate financial stocks are most sensitive to, closed Wednesday at its highest level in weeks, which is the move that actually cost TD and RBC their session, not the oil headline. Thursday's index level is intraday, not a final close.
This chart is presented for general informational purposes only and does not constitute financial, investment, tax, or legal advice. Figures reflect the source and period indicated and may no longer be current.
Related charts
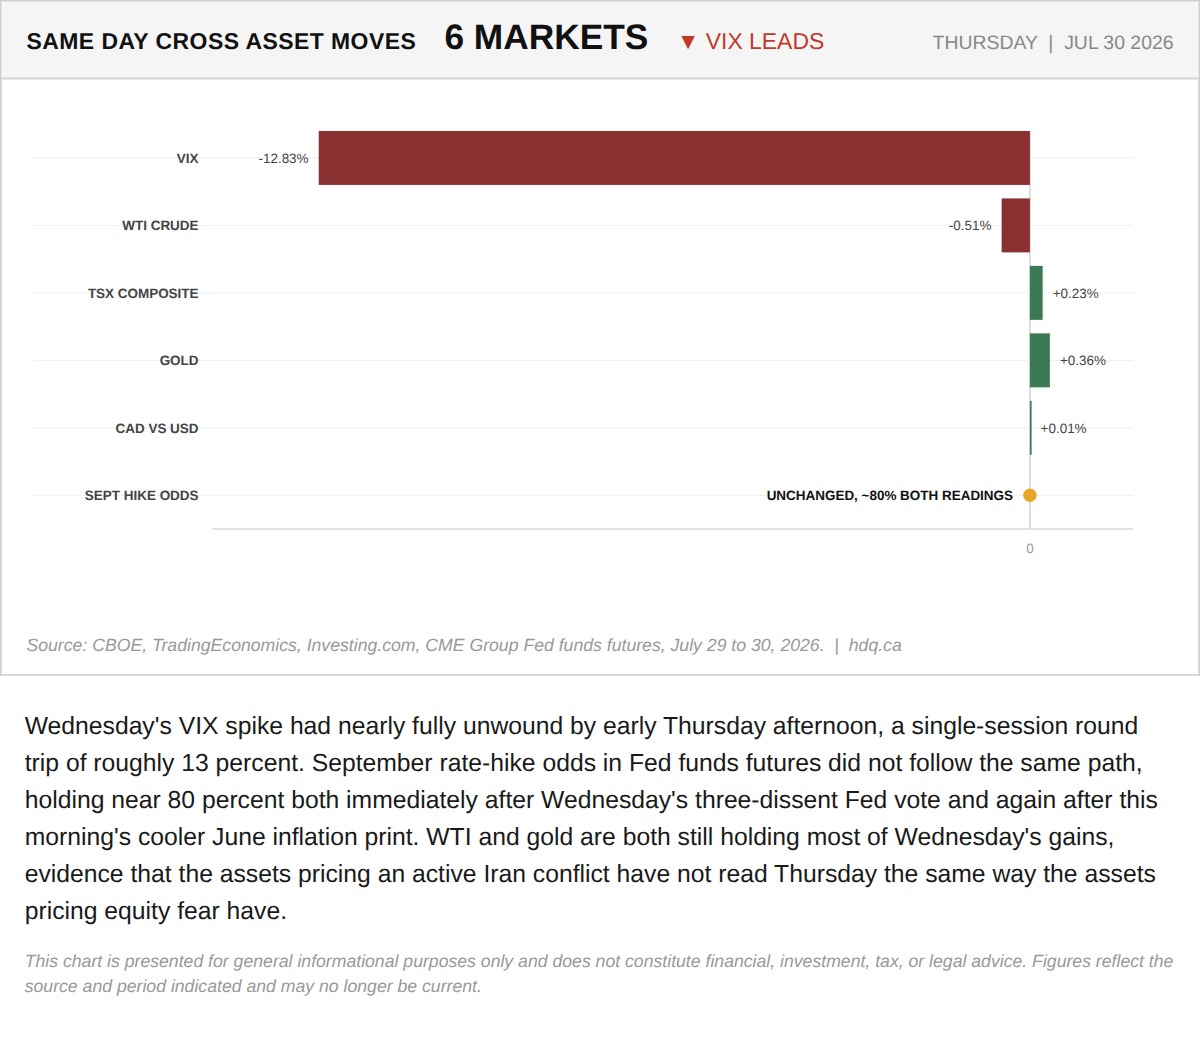
Wednesday's VIX spike had nearly fully unwound by early Thursday afternoon, a single-session round trip of roughly 13 percent.
The VIX Erased Wednesday's Spike. September Rate-Hike Odds Did Not Move With It.
July 30, 2026
View chart & download
The S&P/TSX Composite closed July at 35,226, up 1.06% for the month, a modest headline figure that conceals sharp intra-month swings.
S&P/TSX Composite closes July up 1.06% after a volatile month
July 31, 2026
View chart & download
Brent and WTI crude both surged in July, with WTI ending the month at $85.47, up 23.0%, after round-tripping from a five-month low near $68.74.
WTI and Brent crude surge in July as the Iran ceasefire collapses
July 31, 2026
View chart & download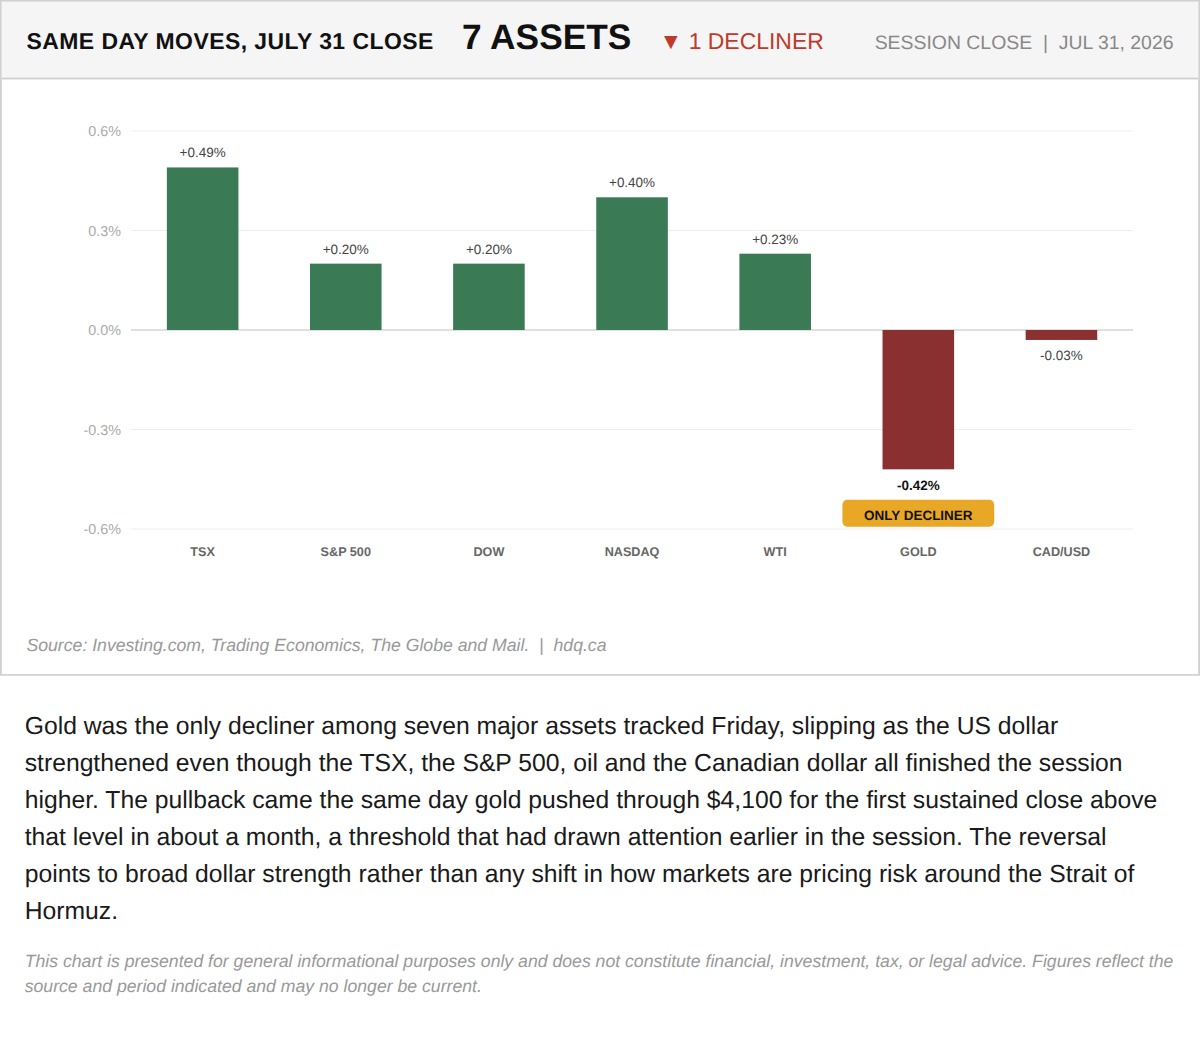
Gold was the only decliner among seven major assets tracked Friday, slipping as the US dollar strengthened even though the TSX, the S&P…
Gold Was the Only Asset to Fall Friday, as Six Others Rose
July 31, 2026
View chart & download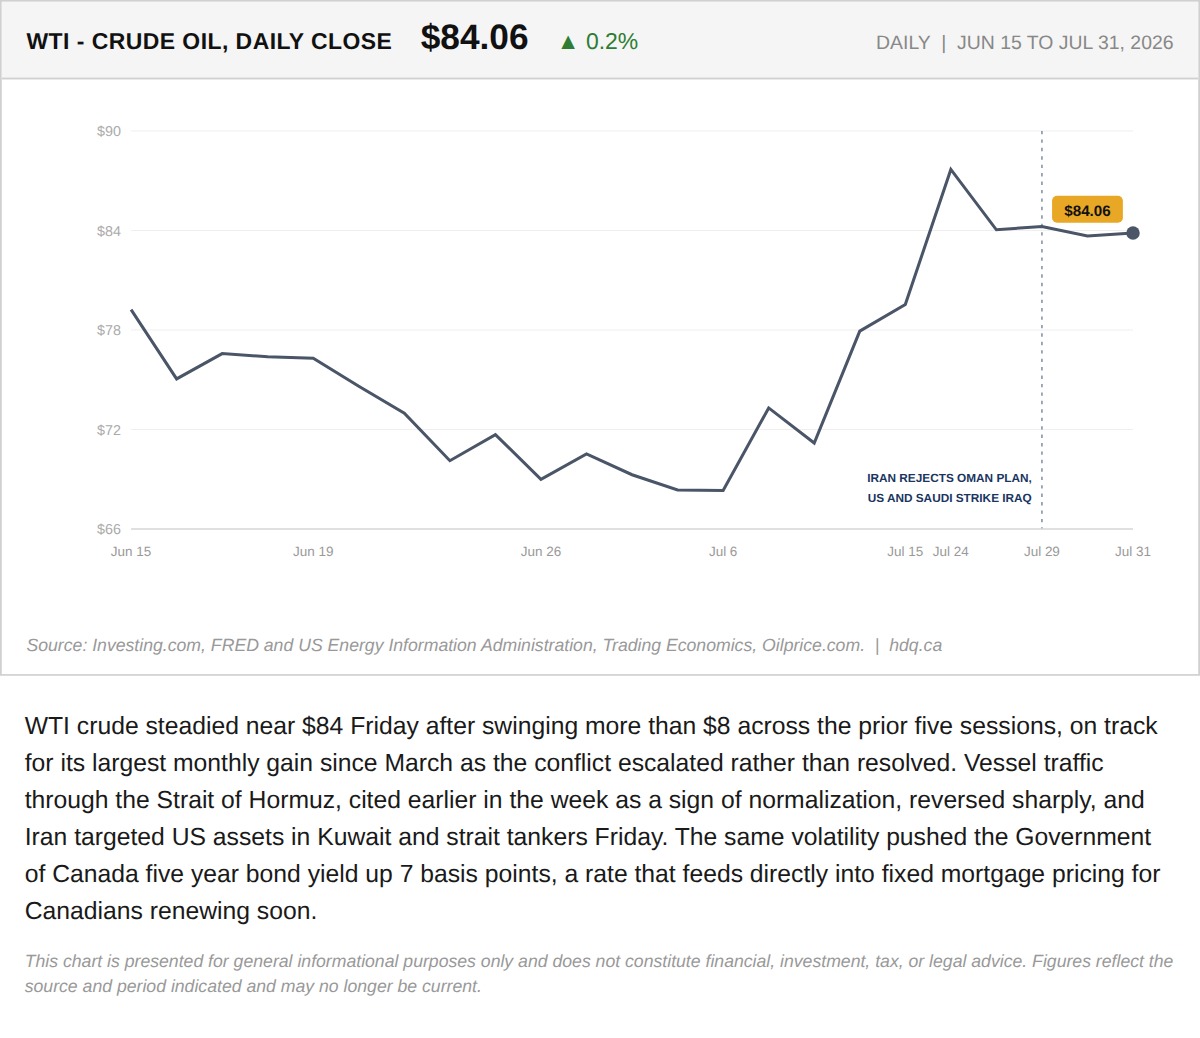
WTI crude steadied near $84 Friday after swinging more than $8 across the prior five sessions, on track for its largest monthly gain since…
WTI Crude Steadies Near $84 After a Volatile Week Tied to Hormuz Tensions
July 31, 2026
View chart & download
Brent was the only one of the three to finish above its starting level, while the index and gold both fell.
Brent, TSX and Gold Rebased to the August 31 Close
September 30, 2026
View chart & download